
Abstract
Background
Lythraceae belongs to the order Myrtales, which is part of Archichlamydeae. The family has 31 genera containing approximately 620 species of herbs, shrubs and trees. Of these 31 genera, five large genera each possess 35 or more species. They are Lythrum, with 35; Rotala, with 45; Nesaea, with 50; Lagerstroemia, with 56; and Cuphea, with 275 species.
Results
We reported six newly sequenced chloroplast (cp) genomes (Duabanga grandiflora, Trapa natans, Lythrum salicaria, Lawsonia inermis, Woodfordia fruticosa and Rotala rotundifolia) and compared them with 16 other cp genomes of Lythraceae species. The cp genomes of the 22 Lythraceae species ranged in length from 152,049 bp to 160,769 bp. In each Lythraceae species, the cp genome contained 112 genes consisting of 78 protein coding genes, four ribosomal RNAs and 30 transfer RNAs. Furthermore, we detected 211–332 simple sequence repeats (SSRs) in six categories and 7–27 long repeats in four categories. We selected ten divergent hotspots (ndhF, matK, ycf1, rpl22, rpl32, trnK-rps16, trnR-atpA, rpl32-trnL, trnH-psbA and trnG-trnR) among the 22 Lythraceae species to be potential molecular markers. We constructed phylogenetic trees from 42 Myrtales plants with 8 Geraniales plants as out groups. The relationships among the Myrtales species were effectively distinguished by maximum likelihood (ML), maximum parsimony (MP) and Bayesian inference (BI) trees constructed using 66 protein coding genes. Generally, the 22 Lythraceae species gathered into one clade, which was resolved as sister to the three Onagraceae species. Compared with Melastomataceae and Myrtaceae, Lythraceae and Onagraceae differentiated later within Myrtales.
Conclusions
The study provided ten potential molecular markers as candidate DNA barcodes and contributed cp genome resources within Myrtales for further study.
Background
Lythraceae belongs to the order Myrtales and is named after the genus Lythrum [1]. The flowering family is composed of five subfamilies, Lythroideae, Punicoideae, Sonneratioideae, Duabangoideae and Trapoideae, with 31 genera. The subfamily Punicoideae was formerly the family Punicaceae, and the subfamily Trapoideae was formerly the Trapaceae. The genera Cuphea, Lagerstroemia, Nesaea, Rotala, and Lythrum represent the largest groups of Lythraceae. Lythraceae species are distributed around the world, with most in tropical regions and some in temperate climate regions [2,3,4,5,6,7].
Most Lythraceae species are herbs, while shrubs or trees are less common [8]. Lythraceae differ from other plant families by the petals, which are crumpled inside their buds, and the many-layered outer integument of their seeds [2, 3]. Many species occur in aquatic or semiaquatic habitats, such as Didiplis, Rotala, Morus and Trapa. Some species in the family are of high economic value, such as Punica granatum as a fruit tree, Trapa natans as edible food, Heimia myrtifolia as an important medicinal plant [9] and Lawsonia inermis as a natural dye. Overall, the species of Lythraceae have high economic and ornamental value and are widely used in horticulture [10, 11].
Past studies of Lythraceae have concentrated on morphology [2, 12], palynology [13, 14] and anatomy [15]. However, these studies did not distinguish the intraspecific relationship within Lythraceae. More recently, to deepen our understanding of the relationship among Lythraceae species, the modern branch method was used to make a preliminary estimate of the phylogeny within Lythraceae species [16]. Based on rbcL genome data, the psaA-ycf3 spacer in the cp genome and the ITS sequence of the nuclear ribosomale DNA, the phylogenetic relationship within Lythraceae ware preliminarily inferred [17]. These two noncoding regions improved the resolution between species in an rbcL bifurcation diagram [17]. However, due to the use of certain DNA fragments, these studies lead to incomplete conclusions. Complete cp genomes will provide better solutions to relationship reconstruction within Lythraceae and allow exploration of its phylogenetic position within Myrtales.
The chloroplast is an essential organelle for land plants [18], and is mostly inherited maternally [19]. The cp genome usually consists of a two-stranded DNA molecule, and most cp genomes are 120–220 kb in length with 120–140 coding genes [20, 21]. The cp genome usually has four parts: a large single copy (LSC) region, a small single copy (SSC) region, and two copies of the inverted repeat region (IRA and IRB). Because the cp genome is more conserved and shorter in length than the nuclear and mitochondrial genomes, some cp genome sequence have been used to distinguish species and conduct phylogenetic studies [22,23,24,25]. An increasing number of cp genomes have recently been reported because complete cp genome sequences provides better data to distinguish marginal taxa, especially below the species level.
In this study, we report six newly sequenced Lythraceae cp genomes and compare them with those of 16 other species within Lythraceae including nine published cp genomes (P. granatum, H. myrtifolia, Lagerstroemia fauriei, Lagerstroemia floribunda, Lagerstroemia guilinensis, Lagerstroemia indica, Lagerstroemia speciosa, Lagerstroemia subcostata and Lagerstroemia intermedia) downloaded from GenBank and seven unpublished Lagerstroemia cp genomes (Lagerstroemia excelsa, Lagerstroemia limii, Lagerstroemia villosa, Lagerstroemia siamica, Lagerstroemia tomentosa, Lagerstroemia venusta and Lagerstroemia calyculata). Our objectives were as follows: (1) To detect differences between the cp genomes of 22 Lythraceae species; (2) to select 10 highly variable regions to act as candidate barcodes for identifying related species of Lythraceae; (3) to reconstruct phylogenetic relationships to verify branch relationships within Lythraceae and explore its status in Myrtales.
Results
Chloroplast genome structure and content
The complete cp genomes of the 22 Lythraceae species ranged in length from 152,049 bp (L. subcostata) to 160,769 bp (L. villosa) (Table 1). All cp genomes had the typical four conjoined structures, including the LSC and SSC regions separated by two IR regions (Fig. 1). The LSC regions ranged from 83,817 bp (L. guilinensis) to 89,569 bp (W. fruticosa) and accounted for 55.10–56.90% of the total length. The SSC regions varied between 16,501 bp (D. grandiflora) and 33,301 bp (L. speciosa) and accounted for 10.60–21.80% of the total length. The IR regions ranged from 17,541 bp (L. floribunda) to 26,906 bp (L. villosa) and accounted for 11.50–17.00% of the total length.

Structural map of the Lythraceae chloroplast genome. Genes drawn inside the circle are transcribed clockwise, and those outside are counterclockwise. Small single copy (SSC), Large single copy (LSC), and inverted repeats (IRa, IRb) are indicated. Genes belonging to different functional groups are color-coded
A total of 112 unique genes were detected in the cp genomes of the 22 Lythraceae species, including 78 coding genes, 30 tRNA genes and 4 rRNA genes (Table 2). Among the 22 Lythraceae species, the lengths of the protein coding exons ranged from 73,401 bp (L. indica) to 81,047 bp (H. myrtifolia), rRNA ranged from 9022 bp (T. natans) to 9068 bp (L.fauriei), tRNA ranged from 2741 bp (L. guilinensis) to 2913 bp (L. excelsa), intergenic regions ranged from 44,031 bp (L. guilinensis) to 51,367 bp (L. villosa) and intronic regions ranged from 14,786 bp (L. calyculata) to 18,099 bp (L. villosa). Each of these accounted for 37.00–38.00%, 3.00–6.00%, 1.80–1.90%, 28.90–32.40% and 9.70–11.30% of the total length, respectively (Table 3).
Among the 112 distinct genes, a total of 17 genes contained introns. Three genes (rps12 and ycf3) contained two introns, similar to Melastomataceae cp genomes [26]. Fourteen genes contained one intron, including eight coding genes (rps16, rpoC1, atpF, petB, petD, ndhB, ndhA, rpl16) and 6 tRNA genes (trnK-UUU, trnL-UAA, trnV-UAC, trnI-GAU, trnA-UGC, trnG-UCC). Of the 17 genes containing introns, one gene was distributed in the SSC regions, three genes was distributed in the IR regions and 13 genes in the LSC regions (Additional file 1: Table S1).
Codon usage
A total of 79 coding genes were used to estimate the codon usage frequency. They were encoded by 25,068 (L. indica) to 27,111 (L. guilinensis) codons. The termination codons were UGA, UAG and UAA. For the 22 species, the GCU encoded alanine had the highest RSCU value and the UAC encoded tyrosine had the lowest at approximately 0.45. Among most of the 22 Lythraceae species, the AAA encoded lysine had the highest number of occurrences, at more than 1000. This result was also reported in the cp genomes of H. myrtifolia, Aquilaria sinensis, Epipremnum aureum and Papaver rhoeas [9, 27,28,29]. The RSCU results (Table 4, Additional file 2: Table S2) showed that A or T had a higher nucleotide frequency than G or C in the third codon position. It is often the case in terrestrial species that the third codon position prefers A/T over C/G, and the richness of A/ T in the IR regions may be the main reason [30, 31].
Comparative genomic analysis within 22 Lythraceae species
Taking the annotation of L. excelsa as a reference, MVISTA was carried out with the cp genome sequences of 22 Lythraceae species. After the 22 cp genomes were pair wise compared, we found that the similarity between the sequences was rather high. From Fig. 2, it is apparent that the 14 Lagerstroemia species are separated from the eight other Lythraceae species. The divergence among the 14 Lagerstroemia species was low. The LSC and SSC regions had more variation than the IR regions, and the noncoding regions had greater differentiation than the coding regions. Some regions contained more variation, such as ndhF, ndhH, matK, ycf2, rpl22, accD, rpoB, rbcL, psbK among the coding genes and psbM-trnD, trnI-trnA, ndhF-rp132, rp132-trnL, ndhD-psaC, atpA-atpF, trnI-GAU intron, trnK-rps16, trnH-psbA among the intergenic regions (Fig. 2). Similar divergence levels were measured for these regions previously [32, 33].

Sequence alignment of whole chloroplast genomes using the Shuffle LAGAN alignment algorithm in mVISTA. Lagerstroemia fauriei was chosen to be the reference genome. The vertical scale indicates the percentage of identity, ranging from 50 to 100%
Compared to the LSC and SSC regions of the 22 cp genomes, the IR regions were most conserved in terms of the sequence and number of genes. However, large variations also existed in connections between the IR, LSC and SSC regions. Inversion and translocation were not detected in the compared genomes. IR amplification and contraction were the main reasons for the difference in the size of these 22 cp genomes.
Significant differences in evolutionary rates were present among the genes across the 22 Lythraceae species analyzed. Overall, the mean Ka/Ks were less than 0.5 for most genes (92.21%). 17 genes showed Ka/Ks higher than 1 for at least one species. Among the 17 genes, seven genes (rbcL, psbJ, rpl2, rpl20, rpl23, ccsA and ycf4) presented these high rates for at least 15 species. The results showed that the seven genes may be under positive selection. Seven genes associated with photosynthesis (psbN, psbI, psaC, atpH, petD, psbD and psbM) showed the lowest rates of evolution (mean Ka/Ks = 0 to 0.0057), and showed uniform rates in most species evaluated. The Ka/Ks of psbN, psbI, psaC and atpH were 0 because there were no non-synonymous substitutions (Additional file 3: Table S3).
In order to detect a possible evolutionary rate acceleration in particular phylogenetic branches, We analyzed three genes with most variable Ka/Ks, namely rpl23 (large subunit of ribosome), rbcL (large subunit of rubisco) and ycf4 (genes of unknown function). Since the Ka/Ks in comparison among 14 Lagerstroemia species were almost 0, we compared the Ka/Ks at rpl23, rbcL and ycf4 in comparison of 14 Lagerstroemia species and the remaining eight Lythraceae species. For the rpl23 gene, the Ka/Ks ranged from 0.891 to 1.8077 except for the comparison with D. grandiflora. There was no non-synonymous substitution between Lagerstroemia species and D. grandiflora in addition to L. excelsa. As seen in the phylogenetic tree, the relationship between the D. grandiflora and the 14 Lagerstroemia species was closer than the other seven Lythraceae species. For the rbcL gene, the Ka/Ks ranged from 0.1119 to 0.3849, which may be due to a low Ks value (0.0046–0.0177). For the ycf4 gene, in addition to the comparison with W. fruticosa (2.4259–2.8340), the ratio of Lagerstroemia species and other seven Lythraceae species ranged from 0.0305 to 0.8758. The result showed that the rpl23 gene evolved faster than rbcL and ycf4. The Ka/Ks for the three genes of clade L. intermis-R. rotundifolia were invalid due to the Ks was 0. The Ka/Ks for the ycf4 and rbcL of clade P. granatum-W. fruticosa were 0.04 and 2.205, for rpl23 was invalid (Additional file 3: Table S3).
Genome size differences among the 22 Lythraceae cp genomes
Of the 22 Lythraceae species, L. subcostata was the shortest (152,049 bp), and L. villosa was the longest (160,769 bp). Except for L. villosa, the lengths of the cp genomes of Lagerstroemia species varied between 152,049 bp and 152,519 bp, while the cp genomes of the other genera of Lythraceae varied from 155,555 bp to 159,380 bp (Table 1). In general, the cp genomes of 13 Lagerstroemia species were significantly smaller than those of other Lythraceae. The longer length of the cp genome of L. villosa resembled those of the 6 newly sequenced species of Lythraceae more than it resembled the Lagerstroemia species. The lengths of the intergenic regions (IGS) ranged from 44,031 bp to 46,156 bp among the 13 Lagerstroemia species and 45,923 bp to 51,357 bp among the remaining species of Lythraceae, which was in accord with the lengths of the complete cp genomes (Table 4). As in other angiosperm plants, differences in IGS length contributed greatly to the variation in genome size. The percentage of GC content in the chloroplast genomes of the 22 species was 36.41–37.72%, with an average of 37.34%. The average GC content of Lagerstroemia species was 37.56%, which was higher than that of the other genera (36.88%).
Contraction and expansion of inverted repeats (IRs)
The genomic structure, including the number and sequence of genes, was highly conserved among the 22 Lythraceae species. However, there were structural changes in the IRA and IRB boundaries (Fig. 3). Although the IR region is more conserved than the other regions, the enlargement and contraction of IR boundaries played a major role in genome size [34,35,36].

Comparison of junctions between the LSC, SSC, and IR regions among 22 species. Distance in the figure is not to scale. LSC, Large single-copy; SSC, Small single -copy; IR, inverted repeat
The sizes of the IRs varied from 24,421 bp (T. natans) to 26,907 bp (L. villosa). Within the IRA-LSC boundaries of the 22 species, the boundaries of 18 species fell within the rps19 coding gene and caused an rps19 pseudogene in the IRB region. The IRA-LSC boundary of L. villosa was located on the left side of the rps19 coding gene and the IRA-LSC borders of D. grandiflora, W. fruticosa and H. myrtifolia were located on the right of the rps19 coding gene. The distance between rps19 and the IRA-LSC boundary ranged from 3 bp to 279 bp.
Except for the 14 Lagerstroemia species and W. fruticosa, the IRA-SSC boundary was embedded in the ndhF encoding gene and had a length of 7 bp (W. fruticosa) to 158 bp (L. guilinensis) in the IRA region. For the other 7 Lythraceae species, ndhF was located on the right side of the IRA-SSC at a distance of 28 bp to 55 bp from the boundary. For all species, the SSC-IRB boundary was located in the ycf1 gene with a length of 1062 bp to 2252 bp in the IRB region, causing a ycf1 pseudogene in the IRA region with a corresponding length. The trnH-GUG noncoding gene was located on the right side of the IRB-LSC boundary ranging from 69 bp to 75 bp at a distance of 0 to 33 bp from the IRB-LSC boundary.
Long repeat structure analysis
Twenty-two Lythraceae species had 383 long repeats of four types. Eighteen species had only forward and palindromic repeats, and only T. natans had all four kinds of repeats. L. indica had the largest number of repeats, including 22 forward and six palindromic repeats. W. fruticosa, P. granatum, L. salicaria and P. granatum had only seven long repeats. As a whole, H. myrtifolia and the 14 Lagerstroemia species had more long repeats than D. grandiflora, T. natans, L. salicaria, L. inermis, P. granatum, W. fruticosa and R. rotundifolia (Fig. 4a, Additional file 4: Table S4). The copy length ranged from 30 bp to 81 bp. Repeat sequences of 30, 31 and 41 accounted for most of the total length (Fig. 4b).

Number of long repetitive repeats on the complete chloroplast genome sequence of 22 Lythraceae species. a Frequency of repeat type; b Frequency of the repeats more than 30 bp long
Simple sequence repeat (SSR) analysis
SSRs, also called short tandem repeats or microsatellites, are made up of nucleotide repeat units 1–6 bp in length [37]. SSRs play a significant role in plant taxonomy and are widely applied as molecular markers [38, 39]. There were 211–332 SSRs in each Lythraceae species that ranged from 8 to 16 bp in length (Fig. 5, Additional file 5: Table S5). Six kinds of SSRs were discovered: mononucleotide, di-nucleotide, tri-nucleotide, tetra-nucleotide, penta-nucleotide and hexa-nucleotide. However, hexa-nucleotide repeats were detected in only the cp genomes of L. siamica, L. intermedia, T. natans and L. salicaria. Among each Lythraceae species, mononucleotide repeats were the most common, with numbers ranging from 123 to 212; followed by trinucleotide ranging from 56 to 68; dinucleotide ranging from 16 to 52; tetranucleotide ranging from 6 to 12; pentanucleotide ranging from 0 to 2 and hexa-nucleotide ranging from 0 to 1. (Fig. 5a). It was previously found that mono-nucleotide repeats were richest in Fritillaria, Lilium and Epimedium [22, 40]. As a result, mononucleotide repeats may play a more important role in genetic variation than the other SSRs.

The comparison of simple sequence repeats (SSR) distribution in 22 chloroplast genomes. a Number of different SSR types detected in 22 chloroplast genomes; b Frequency of common motifs in the 22 chloroplast genomes; c Frequency of SSRs in the LSC, IR, SSC region; d Frequency of SSRs in the intergenic regions, protein-coding genes and introns
In the 22 Lythraceae species, A/T mononucleotide repeats accounted for 45.30 and 50.00%, respectively. C/G mononucleotide repeats accounted for 1.40 and 3.30%, respectively. Most of the other SSRs were composed of A/T, which may have led to the high AT content covering 62.66% of the whole cp genomes within the 22 Lythraceae species (Fig. 5b). Similar biases were also reported in Quercus [41]. Moreover, the number of A/T mononucleotide repeats in D. grandiflora, T. natans, L. salicaria, L. intermis, P. granatum, W. fruticosa, R. rotundifolia and H. myrtifolia were more than 13 Lagerstroemia species, ranging from 71 to 92/71–103. Among the 14 Lagerstroemia species, the number of A mononucleotide repeats ranged from 54 to 58, with T mononucleotide repeats ranging from 65 to 71, except in L. villosa. These results show that the A/T mononucleotide repeats numbers in the same genus are similar. However, the number of A/T mononucleotide repeats of L. villosa was 88/117, which was much higher than those of the other 13 Lagerstroemia species. We can infer that the longer intergenic spacers are the main reason.
SSRs were much more frequently located in the LSC regions (62.90%) than in the IR regions (23.20%) and the SSC regions (13.90%) (Fig. 5c). Furthermore, SSRs in the cp genomes of the Lythraceae species were located mainly in the intergenic spacers, with an average of 132. SSRs dispersed in coding genes were second, with an average of 92. The fewest SSRs were located in the introns, with an average of 37 (Fig. 5d). The SSR loci were located in 31 coding genes (matK, atpI, rpoC2, rpoB, trnS-UGA, rps14, psaB, psaA, ndhK, accD, ycf4, cemA, petA, psaJ, psbB, rpoA, rpl22, rps19, rpl2, ycf2, rrn23, ndhF, rpl32, ccsA, ndhD, ndhA, ycf1, trnI-GAU, ndhB, ycf2) and 57 intergenic regions of the 22 Lythraceae species. Yu et al. found 20 SSRs located in 9 coding genes (matK, rpoC1, rpoC2, cemA, ndhD, ndhG, ndhH, ycf2 and ycf1) of the Fritillaria cp genome [23]. These results indicate that SSRs with large variation in cp genomes can be applied to identify related species and used in research on phylogeny.
Divergence hotspots among 22 Lythraceae species
Divergent hotspots on cp genomes can be utilized to identify closely related species and provide information about phylogeny [42, 43]. The nucleotide diversity (Pi) values of the coding regions and intergenic regions of the 22 cp genomes within Lythraceae were computed using the program DnaSP 5.1. It can be seen in Fig. 6 that the values for the intergenic regions were higher than those for the coding regions, indicating that intergenic regions were more differentiated. For the coding regions, the Pi values of the IR region ranged from 0.0029–0.0144, the Pi values of LSC ranged from 0.00261–0.04547 and the Pi values of SSC ranged from 0.01254–0.04532. For the intergenic regions, the Pi value of the IR region ranged from 0.00232–0.15964, the Pi values of the LSC ranged from 0 to 0.22362 and the Pi values of the SSC ranged from 0.03567–0.17653 (Fig. 6, Additional file 6: Table S6). A total of 10 hotspots with high divergence were selected as potential molecular markers to identify related species and examine phylogeny within Myrtales.

The nucleotide variability (Pi) value in the 22 aligned Lythraceae chloroplast genomes. a Protein-coding genes; b Intergenic regions
Combining the results of DnaSP and mVISTA, we assessed the ability of 10 regions to distinguish the 22 Lythraceae species using ML trees. In the coding regions, the four most variable genes were ndhF, matK, rbcL, and rpl22. For the intergenic regions, trnK-rps16, rpl32-trnL, trnM-atpE, psbM-trnD, trnH-psbA and ndhF-rpl32 were the most variable. The regions with the greatest divergence according to their Pi values were similar to the regions obtained from the mVISTA program. Among the 10 divergent hotspots, 7 hotspots were distributed in the LSC region, and the other 3 hotspots were located in the SSC region. The IR regions were so conserved that no highly divergent hotspots were detected. According to the ML trees, trnK-rps16, ndhF, and rpl32-trnL had the highest resolution. The trnK-rps16 gene clearly separated all the genera within Lythraceae, but the 14 Lagerstroemia species could only be divided into five large branches. The ndhF gene could also divide all the genera within Lythraceae with bootstrap values of 36–100%, and it separated all 14 Lagerstroemia species. Except for the node subtending L. venusta, L. intermedia and L. speciosa with the bootstrap value of 22%, the 14 Lagerstroemia species were separated with bootstrap values of 64–100%. The rpl32-trnL gene divided all the genera except for Lythrum and Heimia, and the 14 Lagerstroemia species could only be divided into five large branches. Compared with trnK-rps16 and rpl32-trnL, ndhF had the highest resolution and was the best candidate marker for barcoding.
Phylogenetic analysis of 22 Lythraceae species with related cp genomes within Myrtales
MP, ML and BI trees were constructed based on the 66 shared protein coding genes of 50 cp genomes (Additional file 7: Table S7). These cp genomes included those of 22 Lythraceae species, 12 Myrtaceae species, three Onagraceae species, five Melastomataceae species and eight species included as out groups. The 22 Lythraceae species included H. myrtifolia, P. granatum, 14 Lagerstroemia species and 6 newly sequenced species (D. grandiflora, T. natans, L. inermis, R. rotundifolia, L. salicaria and W. fruticosa).
The topological structures of the ML trees, MP trees and BI trees were consistent, and the four families (Lythraceae, Onagraceae, Myrtaceae and Melastomataceae) were classified into four monophyletic clades. In addition, Melastomataceae was identified as the basal group in Myrtales. The five subfamilies of the Lythraceae gathered into one clade, demonstrating that P. granatum and T. natans, formerly considered to belong to Punicaceae, and Trapaceae belong to Lythraceae. The 14 Lagerstroemia species gathered into one clade. Only two nodes with bootstrap values under 90% in the ML tree. The remaining nodes had support values of more than 92%. The bootstrap values of all nodes reached 100% in the MP tree (Fig. 7). The results showed that the Melastomataceae family, which was sister to the other families within Myrtales, was the earliest differentiating group. The next family to diverge was the Myrtaceae family, followed by the Onagraceae and Lythraceae. The 22 Lythraceae species gathered into one clade, which was resolved as sister to three Onagraceae species (Ludwigia octovalvis, Oenothera argillicola and Oenothera biennis). As a whole, the phylogenetic tree showed clear internal relationships among Myrtales species.
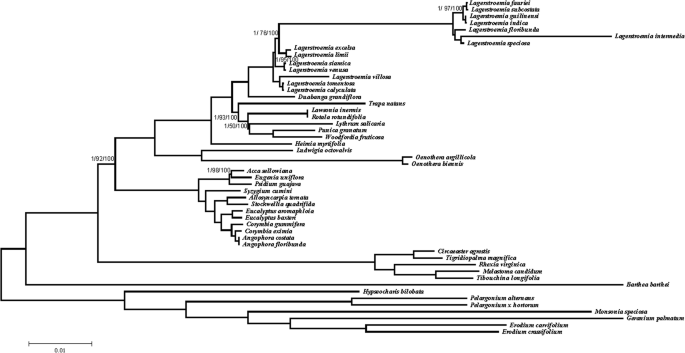
The phylogenetic tree is based on 66 shared protein-coding genes of 50 species. Numbers indicated the bootstrap values from the BI (left), ML (middle) analyses and MP (right) analyses
Discussion
Each of the 22 Lythraceae cp genomes had four conjoined structures and contained 110–112 distinctive genes consisting of 76–78 coding genes, 29–30 tRNAs and 4 rRNAs. The genome length ranged from 152,049 to 16,0769 bp with GC content between 36.41 and 37.72%. It was clear that the 22 cp genomes were highly conserved in genome size, structure and organization, which were also consistent with the cp genomes of Melastomataceae species reported previously [26]. The largest location of variation among the 22 Lythraceae cp genomes was in the intergenic areas, which is a common phenomenon in cp genomes [10, 44, 45].
The slow evolutionary rate and the low Ka/Ks detected in the analyzed Lythraceae species were within expectations, and Ka/Ks varied among groups of different functional genes. As a common evolutionary pattern for photosynthetic plants, photosynthesis genes (psbN, psbI, psaC, atpH, petD, psbD and psbM) had the lowest evolutionary rates. The genes rpl2, rpl20 and rpl23 involved in replication, rbcL and psbJ involved in photosynthesis, ycf4 of unknown functions and other genes including ccsA evolved more quickly and had high Ka/Ks (≥1). The seven genes evolved faster among 22 Lythraceae species analyzed were also found in Capsicum and Sesamum indicum species [23, 46]. Some genes are species-specific in terms of the rates of evolution, such as clpP gene. Although it is highly conserved in most green plants, it is by far the fastest evolving plastid-encoded gene in some angiosperms. The rates of evolution in the plastid Clp protease complex are extreme different [47]. The mean Ka/Ks of the clpP gene within Lythraceae species was 0.0395, which was different from the high ratio of Ka/Ks in some plants. Williams also found that clpP1 has undergone remarkably frequent bouts of accelerated sequence evolution, which may result from the intron loss in many lineages, such as Oenothera. However, the clpP gene contained two introns across 22 Lythraceae species, which may be the reason for its low Ka/Ks. The clpP experiencing negative (purifying) selection among Lythraceae species may result from conserved lengths (591 bp). Genes under positive selection typically have large insertions of more or less repeating amino acid sequence motifs [48]. Genes under positive selection may also be bound up with a recent increase in diversification rate after adapted to novel ecological conditions [49].
The boundaries between the four cp genomes regions are important in the evolution of some taxa [50]. For example, pseudogenes such as ψycf1 or ψrps19 were produced by contraction and expansion of the IR region. The ψycf1 pseudogene exists in all 22 Lythraceae species while the ψrps19 pseudogene was absent in 4 Lythraceae species. The rps19 gene was located in the LSC regions of H. myrtifolia, W. fruticosa and D. grandiflora. In the cp genome of L. villosa, the rps19 gene was fully duplicated in IRA, as has also been reported in some Malpighiales species [51].
In previous studies, comparative analysis based on complete cp genomes was scarce due to the limited number of published cp genomes of Lythraceae species, and the phylogenetic relationships within Lythraceae were not clear. P. granatum and T. natans were placed alone in the Punicaceae family and the Trapaceae family respectively. The relationship between T. natans and the other species within Myrtales could not be confirmed because of the large morphological variation in T. natans, so DNA data were necessary to confirm the location of T. natans in Myrtales. The rbcL gene, the pasA-ycf3 spacer, and the ITS sequences have been used to establish trees and infer phylogenetic relationships within Lythraceae, and these relationships were corroborated by our results. The sister relationship between Trapa and Sonneratia was strongly supported, while the sister relationship between Trapa and Lythrum was weakly supported. Overall, the position of T. natans in the family Lythraceae was confirmed in our phylogenetic analysis. Our results further show that P. granatum belong to the Lythraceae.
Conclusion
In this study, the newly sequenced cp genomes of D. grandiflora, T. natans, L. salicaria, L. inermis, W. fruticosa and R. rotundifolia were reported and combined with those of 16 other species to compare a total of 22 Lythraceae cp genomes. The cp genomes of the 22 Lythraceae species were similar in structure, composition and gene order, showing that they are highly conserved. Three phylogenetic trees showed that 42 Myrtales species were completely divided into four branches representing four families with high bootstrap values. From previously existing cp genomes, the evolutionary history of Myrtales had been preliminarily understood. The results of this study provide additional rich genetic resources for phylogenetic research and will play an important role in further study within Myrtales.
Materials and methods
DNA extraction of plant materials and sequencing
The fresh leaves of six species of Lythraceae within Myrtales (D. grandiflora, T. natans, L. salicaria, L. inermis, W. fruticosa and R. rotundifolia) were obtained from the nursery of Zhejiang A&F University, and then immediately stored in silica gel. A CTAB method was used to extract the genomic DNA [52]. A NanoDrop 2000 Micro spectrophotometer and an Agilent 2100 Bioanalyzer (Agilent Technologies, Santa Clara, CA) were employed to evaluate the concentration and quality of the extracted DNA. Following the manufacturer’s instructions, the purified DNA was used to build a sequencing library. The Illumina HiSeq 2000 sequencer (Illumina Biotechnology Company, San Diego, CA) was used to obtain paired-end (PE) reads of 150 bp [9].
Chloroplast genome assembly, annotation, and structure
Trimmomatic v0.3 was used to trim and filter raw reads with a Phred quality score ≤ 20. The other parameters in Trimmomatic v0.3 were set as follows: the sliding window was set to 4:15, the trailing was set to 3, the leading was set to 3 and the minlen was set to 50 [53]. CLC version 9.11 (Qiagen Company, Hilden) with default parameters was used to perform de novo assembly. Four to eight different contigs were created for each species [54]. The BLAST algorithm was used with the L. fauriei cp genome as a reference to align all contigs. The ends of each contig could be overlapped by 50 to 80 bp and combined as one large cp genome. The Re-read mapping was also conducted to validate the genome. The coverage of each genome varied from 500x to 900x. DOGMA v1.2 was used to perform genome annotation [8,9,10, 55]. OGDRAW (http://ogdraw.mpimp-golm.mpg.de/) was used to draw the circular cp genome map of the Lythraceae species and then manually edited [56].
Codon usage
The relative synonymous codon usage (RSCU) is the ratio of the frequency of the specific codon to the expected frequency [57]. An RSCU > 1.00 means that a codon is used more frequently than expected, while an RSCU < 1.00 denotes that a codon is used less frequently than expected. The RSCU was obtained using DAMBE5 [58].
Genome comparative analysis and molecular marker identification
A total of 22 Lythraceae species were compared. Taking the L. excelsa annotation as the reference, the mVISTA in LAGAN mode was used to make pairwise alignments among the 22 cp Lythraceae species genomes [59].
The 77 protein coding regions of 22 Lythraceae species were used to evaluate evolutionary rate variation. DnaSP 5.1 was to calculate the rates of nonsynonymous (Ka) and synonymous substitutions (Ks) [60]. A total of 13,318 Ka/Ks were obtained; the value could not be calculated if Ks = 0.
MEGA 6 was used to align the cp genomes after manual adjustments in BioEdit software [61]. Then, DnaSP 5.1 was used to separately evaluate the Pi values of the coding and noncoding sequences. Pi values across the complete cp genomes, LSC, SSC, and IR regions were also calculated using DnaSP 5.1 [62].
Identification of long repetitive sequences and simple sequence repeats (SSRs)
REPuter was used to detect four kinds of long repeats: forward, reverse, palindromic, and complementary repeats [63]. The parameters were set as follows: (1) the minimum repeat was more than 30 bp; (2) the sequence identity was more than 90%; (3) the Hamming distance was equal to 3. Msatcommander 0.8.2.0 was used to detect the location and number of SSRs [64] with the following settings: mononucleotides ≥8; dinucleotides ≥4; trinucleotides, tetranucleotides, pentanucleotide and hexanucleotide SSRs ≥3.
Phylogenetic analysis
To reconstruct the phylogenetic relationships and examine the phylogenetic status of Lythraceae within Myrtales, the complete cp genomes of 42 Myrtales species were used for analysis. Clustal X 2.1 software with default parameter settings was used to align 66 protein coding gene sequences, with manual adjustments to the alignment ends when necessary [65]. The data matrix used in phylogenetic analysis is provided as supplementary data. Evolutionary relationships were analyzed using MEGA 6 for maximum likelihood (ML) and maximum parsimony (MP), MrBayes 3.1.2 for Bayesian inference (BI) trees [60, 66]. If the bootstrap values of the nodes were equal to 100%, they were not marked on the tree. In all analyses, eight species were considered outgroups. The phylogenetic trees were plotted in FigTree [67].
Availability of data and materials
The complete chloroplast genomes of the 13 Lythraceae species have been submitted to the NCBI database under the accession number MK881626 (https://www.ncbi.nlm.nih.gov/nuccore/MK881626), MK881627 (https://www.ncbi.nlm.nih.gov/nuccore/MK881627), MK881628 (https://www.ncbi.nlm.nih.gov/nuccore/MK881628), MK881629 (https://www.ncbi.nlm.nih.gov/nuccore/MK881629), MK881630 (https://www.ncbi.nlm.nih.gov/nuccore/MK881630), MK881631 (https://www.ncbi.nlm.nih.gov/nuccore/MK881631), MK881632 (https://www.ncbi.nlm.nih.gov/nuccore/MK881632), MK881633 (https://www.ncbi.nlm.nih.gov/nuccore/MK881633), MK881634 (https://www.ncbi.nlm.nih.gov/nuccore/MK881634), MK881635 (https://www.ncbi.nlm.nih.gov/nuccore/MK881635), MK881636 (https://www.ncbi.nlm.nih.gov/nuccore/MK881636), MK881637 (https://www.ncbi.nlm.nih.gov/nuccore/MK881637) and MK881638 (https://www.ncbi.nlm.nih.gov/nuccore/MK881638). Other data used in the analysis are included within the article and the additional files.
Abbreviations
- CTAB:
-
Cetyltrimethy lammonium Ammonium Bromide
- di-:
-
Dinucleotides
- IGS:
-
Intergenic Regions
- IRs:
-
Inverted repeats
- Ka:
-
Non-synonymous site
- Ka/Ks:
-
the ratio of Non-synonymous site and Synonymous site
- Ks:
-
Synonymous site
- LSC:
-
Large single-copy region
- ML:
-
Maximum likelihood
- mono-:
-
Mononucleotides
- MP:
-
Maximum parsimony
- penta-:
-
Pentanucleotides
- Pi:
-
Nucleotide diversity values
- rRNA:
-
Ribosomal RNAs
- RSCU:
-
Relative synonymous codon usage
- SSC:
-
Small single-copy region
- SSRs:
-
Simple-Sequence Repeats
- tetra-:
-
Tetranucleotides
- tri-:
-
Trinucleotides
- tRNA:
-
Transfer RNAs
References
Dahlgren R, Thorne RF. The order Myrtales: circumscription, variation and relationships. Ann Mo Bot Gard. 1984;71:633–99.
Graham SA, Crisci J, Hoch PC. Cladistic analysis of the Lythraceae sensu lato based on morphological characters. Bot J Linn Soc. 1993a;113:1–33.
Graham SA, Thorne RF, Reveal JL. Validation of subfamily names in Lythraceae. Taxon. 1998;47:435–6.
Conti E, Litt A, Sytsma KJ. Circumscription of Myrtales and their relationships to other rosids: evidence from rbcL sequence data. Am J Bot. 1996;83:221–33.
Conti E, Litt A, Wilson PG, Graham SA, Briggs BG, Johnson LAS, et al. Interfamilial relationships in Myrtales: molecular phylogeny and patterns of morphological evolution. Syst Bot. 1997;22:629–47.
Shi SH, Huang YL, Tan FX, He XJ, Boufford ED. Phylogenetic analysis of the Sonneratiaceae and ITS relationships to Lythraceae based on ITS sequences of nrDNA. J Plant Res. 2000;113:253–8.
Thorne RF. The classification and geography of the flowering plants: dicotyledons of the class angiospermae (subclasses Magnoliidae, Ranunculidae, Caryophyllidae, Dilleniidae, Rosidae,and Lamiidae). Bot Rev. 2000;66:441–647.
Gu CH, Tembrock LR, Wu ZQ. The complete chloroplast genome of Lagerstroemia intermedia (Lythraceae), a threatened species endemic to southwestern Yunnan province, China. Conserv Genet Resour. 2017;9:357–60.
Gu CH, Dong B, Xu L, Tembrock LR, Zheng SY, Wu ZQ. The complete chloroplast genome of H. myrtifolia and comparative analysis within Myrtales. Molecules. 2018;23:846.
Gu CH, Tembrock LR, Wu ZQ, Simmons MP. The complete plastid genome of Lagerstroemia fauriei and loss of intron in rpl2 gene from Lagerstroemia. PLoS One. 2016;11:e0150752.
Xu C, Dong W, Li W, Lu Y, Xie X, Jin X, et al. Comparative analysis of six Lagerstroemia complete chloroplast genomes. Front Plant Sci. 2017;8:15.
Graham SA, Graham A. Ovary, fruit, and seed morphology of the Lythraceae. Int J Plant Sci. 2014;175:39.
Graham A, Nowicke J, Skvarla J, Graham S, Patel V, Lee S. Palynology and systematics of the Lythraceae. II. Genera Haitia through Peplis. Am J Bot. 1987;74:829–50.
Graham A, Graham S, Patel V, Lee S. Palynology and systematics of the Lythraceae. III. Genera Physocalymma through Woodfordia, addenda, and conclusions. Am J Bot. 1990;77:159–77.
Baas P, Zweypfenning RCVJ. Wood anatomy of the Lythraceae. Acta Bot Neerl. 1979;28:117–55.
Graham SA, Oginuma K, Raven RH, Tobe H. Chromosome numbers in Sonneratia and Duabanga (Lythraceae s. l.) and their systematic significance. Taxon. 1993b;42:35–41.
Huang YL, Shi SH. Phylogenetics of Lythraceae sensu lato: a preliminary analysis based on chloroplast rbcL gene, psaA-ycf3 spacer and nuclear rDNA internal transcribed spacer (ITS). Int J Plant Sci. 2002;163:215–25.
Daniell H, Chan HT, Pasoreck EK. Vaccination via chloroplast genetics: affordable protein drugs for the prevention and treatment of inherited or infectious human diseases. Annu Rev Genet. 2016;50:595–618.
Asaf S, Khan AL, Khan MA, Waqas M, Kang SM, Yun BW, et al. Chloroplast genomes of Arabidopsis halleri ssp. gemmifera and Arabidopsis lyrata ssp. petraea: structures and comparative analysis. Sci Rep. 2017;7:7556.
Alejandra BML, Jingya G, Elisabeth AM, Jerry W, Jean MS, Anil D. The chloroplast genome of the marine microalga Tisochrysis lutea. Mitochondrial DNA Part B. 2019;4:253-255.
Rogalski M, Vieira LN, Fraga HP, Guerra MP. Plastid genomics in horticultural species: importance and applications for plant population genetics, evolution, and biotechnology. Front Plant Sci. 2015;6:586.
Ronsted N, Law S, Thornton H, Fay MF, Chase MW. Molecular phylogenetic evidence for the monophyly of Fritillaria and Lilium (Liliaceae; Liliales) and the infrageneric classification of Fritillaria. Mol Phylogenet Evol. 2005;35:509–27.
D’Agostino N, Tamburino R, Cantarella C, De Carluccio V, Sannino L, et al. The complete plastome sequences of eleven Capsicum genotypes: insights into DNA variation and molecular evolution. Genes. 2018;9(10):503.
Scarcelli N, Barnaud A, Eiserhardt W, Treier UA, Seveno M, D'Anfray A, et al. A set of 100 chloroplast DNA primer pairs to study population genetics and phylogeny in monocotyledons. PLoS One. 2011;6:e19954.
Gao YD, Harris AJ, He XJ. Morphological and ecological divergence of Lilium and Nomocharis within the Hengduan Mountains and Qinghai-Tibetan plateau may result from habitat specialization and hybridization. BMC Evol Biol. 2015;15:147.
Reginato M, Neubig KM, Majure LC, Michelangeli FA. The first complete plastid genomes of Melastomataceae are highly structurally conserved. Peer j. 2016;4:e2715.
Ying W, Zhan DF, Xian J, Mei WL, Dai HF, Chen XT, et al. Complete chloroplast genome sequence of Aquilaria sinensis (lour.) gilg and evolution analysis within the malvales order. Front Plant Sci. 2016;7:280.
Tian N, Han L, Chen C, Wang Z. The complete chloroplast genome sequence of epipremnu maureum and its comparative analysis among eight araceae species. PLoS One. 2018;13:e0192956.
Zhou J, Cui Y, Chen X, Li Y, Xu ZDB, et al. Complete chloroplast genomes of Papaver rhoeas and Papaver orientale: molecular structures, comparative analysis, and phylogenetic analysis. Molecules. 2018;23:437.
Chen J, Hao Z, Xu H, Yang L, Liu G, Sheng Y, et al. The complete chloroplast genome sequence of the relict woody plant Metasequoia glyptostroboides. Front Plant Sci. 2015;6:447.
Gu CH, Tembrock LR, Zheng SY, Wu ZQ. The complete chloroplast genome of Catha edulis: a comparative analysis of genome features with related species. Int J Mol Sci. 2018;19:525.
Qian J, Song J, Gao H, Zhu Y, Xu J, Pang X, et al. The complete chloroplast genome sequence of the medicinal plant Salvia miltiorrhiza. PLoS One. 2013;8:e57607.
Redwan RM, Saidin A, Kumar SV. Complete chloroplast genome sequence of MD-2 pineapple and its comparative analysis among nine other plants from the subclass Commelinidae. BMC Plant Biol. 2015;15:294.
Gu CH, Tembrock LR, Zhang D, Wu ZQ. Characterize the complete chloroplast genome of Lagerstroemia floribunda (Lythraceae), a narrow endemic crape myrtle native to Southeast Asia. Conserv Genet Resour. 2016b;9:1–4.
Yang M, Zhang X, Liu G, Yin Y, Chen K, Yun Q, et al. The complete chloroplast genome sequence of date palm (Phoenix dactylifera L.). PLoS One. 2010;5:e12762.
Raubeson LA, Peery R, Chumley TW, Dziubek C, Fourcade HM, Boore JL, et al. Comparative chloroplast genomics: analyses including new sequences from the angiosperms Nupharadvena and Ranunculus macranthus. BMC Genomics. 2007;8:174.
Chen C, Ping Z, Choi YA, Shu H, Jr FGG. Mining and characterizing microsatellites from citrus ESTs. Theor Appl Genet. 2006;112:1248–57.
Doorduin L, Doorduin L, Gravendeel B, Lammers Y, Ariyurek Y, Chin-A-Woeng T, et al. The complete chloroplast genome of 17 individuals of pest species Jacobaea vulgaris: SNPs, microsatellites and barcoding markers for population and phylogenetic studies. DNA Res. 2011;18:93–105.
He S, Wang Y, Volis S, Li D, Yi T. Genetic diversity and population structure: implications for conservation of wild soybean (Glycine sojaSieb. Et Zucc) based on nuclear and chloroplast microsatellite variation. Int J Mol Sci. 2012;13:12608–28.
Zhang Y, Du L, Liu A, Chen J, Wu L, Hu W, et al. The complete chloroplast genome sequences of five Epimedium species: lights into phylogenetic and taxonomic analyses. Front Plant Sci. 2016;7:306.
Yang Y, Zhou T, Duan D, Yang J, Feng L, Zhao G. Comparative analysis of the complete chloroplast genomes of five Quercus species. Front Plant Sci. 2016;7:57.
Du YP, Bi Y, Yang FP, Zhang MF, Chen XQ, Xue J, et al. Complete chloroplast genome sequences of Lilium: insights into evolutionary dynamics and phylogenetic analyses. Sci Rep. 2017;7:5751.
Dong W, Liu J, Yu J, Wang L, Zhou S. Highly variable chloroplast markers for evaluating plant phylogeny at low taxonomic levels and for DNA barcoding. PLoS One. 2012;7:e35071.
Ren T, Yang Y, Zhou T, Liu ZL. Comparative plastid genomes of primula species: sequence divergence and phylogenetic relationships. Int J Mol Sci. 2018;19:1050.
Wicke S, Schneeweiss GM, Depamphilis CW, Muller KF, Quandt D. The evolution of the plastid chromosome in land plants: gene content, gene order, gene function. Plant Mol Biol. 2011;76:273–97.
Zhang H, Li C, Miao H, Xiong S. Insights from the complete chloroplast genome into the evolution of Sesamum indicum L. PLoS One. 2013;8:e80508.
Alissa M, Williams AM, Friso G, van Wijk KJ, Sloan DB. Extreme variation in rates of evolution in the plastid Clp protease complex. Plant J. 2019. https://doi.org/10.1111/tpj.14208.
Erixon P, Oxelman B. Whole-gene positive selection, elevated synonymous substitution rates, duplication, and indel evolution of the chloroplast clpP1 gene. PLoS One. 2008;3:e1386.
Piot A, Hackel J, Christin PA, Besnard G. One-third of the plastid genes evolved under positive selection in pacmad grasses. Planta. 2018;247:255–66.
Nazareno AG, Carlsen M, Lohmann LG. Complete chloroplast genome of Tanaecium tetragonolobum: the first Bignoniaceae plastome. PLoS One. 2015;10:e0129930.
Menezes APA, Resendemore IRALC, Buzatti RSO, Nazareno AG, Carlsen M, Lobo FP, et al. Chloroplast genomes of byrsonima species (malpighiaceae): comparative analysis and screening of high divergence sequences. Sci Rep. 2018;8:1.
Zhang X, Zhou T, Kanwal N, Zhao Y, Bai G, Zhao G. Completion of eight gynostemmabl. (cucurbitaceae) chloroplast genomes: characterization, comparative analysis, and phylogenetic relationships. Front Plant Sci. 2017;8:1583.
Bolger AM, Lohse M, Usadel B. Trimmomatic: a flexible trimmer for Illumina sequence data. Bio-informatics. 2014;30:2114–20.
Wu Z, Tembrock LR, Ge S. Are differences in genomic data sets due to true biological variants or errors in genome assembly: an example from two chloroplast genomes. PLoS One. 2015;10:1–14.
Wyman SK, Jansen RK, Boore JL. Automatic annotation of organellar genomes with DOGMA. Bioinformatics. 2004;20:3252–5.
Conant GC, Wolfe KH. Genome Vx: simple web-based creation of editable circular chromosome maps. Bioinformatics. 2008;24:861–2.
Cauzsantos LA, Munhoz CF, Rodde N, Cauet S, Santos AA, Penha HA, et al. The chloroplast genome of Passiflora edulis (Passifloraceae) assembled from long sequence reads: structural organization and phylogenomic studies in Malpighiales. Front Plant Sci. 2017;8:334.
Xia X. DAMBE5: A comprehensive software package for data analysis in molecular biology and evolution. Mol Biol Evol. 2013;30:1720–8.
Frazer KA, Pachter L, Poliakov A, Rubin EM, Dubchak I. VISTA: computational tools for comparative genomics. Nucleic Acids Res. 2004;32:273–9.
Librado P, Rozas J. DnaSP v5: a software for comprehensive analysis of DNA polymorphism data. Bioinformatics. 2009;25:1451–2.
Tamura K, Stecher G, Peterson D, Filipski A, Kumar S. MEGA6: molecular evolutionary genetics analysis version 6.0. Mol Biol Evol. 2013;30:2725–9.
Rozas J, Sánchez-DelBarrio JC, Messeguer X, Rozas R. DnaSP, DNA polymorphism analyses by the coalescent and other methods. Bioinformatics. 2003;19:2496–7.
Kurtz S, Choudhuri JV, Ohlebusch E, Schleiermacher C, Stoye J, Giegerich R. REPuter: The manifold applications of repeat analysis on a genomic scale. Nucleic Acids Res. 2001;29:4633–42.
Faircloth BC. MSATCOMMANDER: detection of microsatellite repeat arrays and automated, locus-specific primer design. Mol Ecol Resour. 2008;8:92–4.
Larkin MA, Blackshields G, Brown NP, Chenna R, Mcgettigan PA, Mcwilliam H, et al. Clustal W and ClustalX version2.0. Bioinformatics. 2007;23:2947–8.
Huelsenbeck JP, Ronquist F. MRBAYES: Bayesian inference of phylogenetic trees. Bioinformatics. 2001;17:754–5.
Simmons MP, Cappa JJ, Archer RH, Ford AJ, Eichstedt D, Clevinger CC. Phylogeny of the Celastreae (Celastraceae) and the relationships of Catha edulis (qat) inferred from morphological characters and nuclear and plastid genes. Mol Phylogenet Evol. 2008;48:745–57.
Acknowledgments
We are grateful to Zhejiang Provincial Natural Science Foundation of China and the National Natural Science Foundation of China. We are also grateful to the editors and all valuable comments of the reviewers, who helped improve the quality of our manuscript.
Funding
This work research and publication costs were supported by funding to Zhejiang Provincial Natural Science Foundation of China (LY17C160003) and the National Natural Science Foundation of China (No. 31770681, 31370641). The funding agencies had no role in the design of the experiment, analysis, and interpretation of data and in writing the manuscript.
Author information
Authors and Affiliations
Contributions
GC, WZ and ML designed the experiments, wrote the manuscript, and revised manuscript. ML, CK and WY performed the experiments and analyzed the data. All authors read and approved the final manuscript.
Corresponding author
Ethics declarations
Ethics approval and consent to participate
Not applicable.
Consent for publication
Not applicable.
Competing interests
The authors declare that they have no competing interests.
Additional information
Publisher’s Note
Springer Nature remains neutral with regard to jurisdictional claims in published maps and institutional affiliations.
Additional files
Additional file 1:
Table S1. The genes having intron in the 22 Lythraceae chloroplast genomes. (XLSX 50 kb)
Additional file 2:
Table S2. Codon usage and codon-anticodon recognition pattern of 22 Lythraceae species. (XLSX 117 kb)
Additional file 3:
Table S3. The rates of Ka、Ks and Ka/Ks of 77 genes among 22 Lythraceae species. (XLSX 1497 kb)
Additional file 4:
Table S4. The comparison of Long repeats among 22 Lythraceae species. (XLSX 72 kb)
Additional file 5:
Table S5. The comparison of SSRs among 22 Lythraceae species. (XLSX 525 kb)
Additional file 6:
Table S6. The nucleotide variability (Pi) value of Protein-coding genes and Intergenic regions. (XLSX 23 kb)
Additional file 7:
Table S7. The GenBank accession numbers of 50 species using in phylogenetic. (DOCX 17 kb)
Rights and permissions
Open Access This article is distributed under the terms of the Creative Commons Attribution 4.0 International License (http://creativecommons.org/licenses/by/4.0/), which permits unrestricted use, distribution, and reproduction in any medium, provided you give appropriate credit to the original author(s) and the source, provide a link to the Creative Commons license, and indicate if changes were made. The Creative Commons Public Domain Dedication waiver (http://creativecommons.org/publicdomain/zero/1.0/) applies to the data made available in this article, unless otherwise stated.
About this article

Cite this article
Gu, C., Ma, L., Wu, Z. et al. Comparative analyses of chloroplast genomes from 22 Lythraceae species: inferences for phylogenetic relationships and genome evolution within Myrtales. BMC Plant Biol 19, 281 (2019). https://doi.org/10.1186/s12870-019-1870-3
Received:
Accepted:
Published:
DOI: https://doi.org/10.1186/s12870-019-1870-3