
Abstract
Background
The Immunoglobulins (IG) and the T cell receptors (TR) play the key role in antigen recognition during the adaptive immune response. Recent progress in next-generation sequencing technologies has provided an opportunity for the deep T cell receptor repertoire profiling. However, a specialised software is required for the rational analysis of massive data generated by next-generation sequencing.
Results
Here we introduce tcR, a new R package, representing a platform for the advanced analysis of T cell receptor repertoires, which includes diversity measures, shared T cell receptor sequences identification, gene usage statistics computation and other widely used methods. The tool has proven its utility in recent research studies.
Conclusions
tcR is an R package for the advanced analysis of T cell receptor repertoires after primary TR sequences extraction from raw sequencing reads. The stable version can be directly installed from The Comprehensive R Archive Network (http://cran.r-project.org/mirrors.html). The source code and development version are available at tcR GitHub (http://imminfo.github.io/tcr/) along with the full documentation and typical usage examples.
Background
The power of the human adaptive immunity is realised throughout the immunoglobulins (IG) and T cell receptors (TR): the highly diverse antigen receptors which recognise pathogens and provide specific immune responses. Until recently, studies on the structural composition of immune repertoires, receptor sequence sharing and quantitative estimation of particular B or T cell clones abundance have remained a challenge due to an extremely high diversity of IG and TR sequences: the maximal theoretical diversity of the most variable TR beta chains is estimated as 1 × 10¹⁴ [1] and 1 × 10¹⁸ for the heterodimeric T cell receptor consisting of α and β chains [2–4].
Next-generation sequencing (NGS) technologies have opened a new era in the field of IG and TR repertoires research, which includes the studies on adaptive immune system ageing [5], immune repertoire reconstitution after therapy [6], response to vaccines [7] and subpopulation repertoire structure [8, 9]. In addition to standard IMGT/HighV-QUEST [10–12] recent studies provided powerful tools for processing raw IG/TR NGS data: extraction of complementarity determining regions (CDR) from reads and generation of clonotype (hereafter clonotype is a group of sequencing reads with identical aminoacid or nucleotide CDR3 sequence and V/J genes) sets [12–18], as well as advanced algorithms for the correction of PCR and sequencing errors [19, 20]. However, the interpretation of TR repertoires (i.e., lists of TR clonotypes with their quantities) in terms of biological relevance requires further downstream analysis of the resultant clonotype sets.
In order to examine TR repertoires of different individuals a number of strategies can be employed such as quantifying the number of shared nucleotide and amino acid sequences between repertoires, comparisons of gene usage frequencies and repertoire diversity estimation [21]. Only two software tools that apply a limited number of the analysis methods - MiTCRViewer [13] and ViDJiL [15] are available.
Here, we introduce tcR: an R package for the analysis of TR repertoires that integrates widely used methods for individual repertoires analyses and TR repertoires comparison: gene usage comparison, customisable search for clonotypes shared among repertoires, spectratyping, random TR repertoire generation, various repertoire diversity measures and other commonly used approaches to the repertoire analysis.
Implementation
This section describes the input data format, methods and procedures implemented in tcR. The R package vignette presents a more detailed overview of methods included in tcR.
-
1)
Input data and data manipulation: The input data for tcR are tab-delimited files with rows representing clonotypes and columns representing read counts, nucleotide and amino acid sequences of the CDR3, names and borders of the identified V(ariable), D(iversity) and J(oining) genes and the number of insertions at gene junctions. This file format is a default output of the MiTCR software [13] that is widely used for TR NGS data extraction and raw clonotype set generation (see the package vignette for the detailed information on valid input file formats). TR repertoires are represented in tcR as R data frames, therefore they could be easily assigned to subsets, filtered and transformed using basic and effective R subroutines.
-
2)
Descriptive statistics: The tcR package provides utilities for computing primary descriptive statistics for TR repertoires, including, but not limited to, counts and percentages of TR nucleotide or amino acid clonotypes, V and J gene usage, clonal count skewness and distribution of CDR3 sequence lengths.
-
3)
Shared clonotypes analysis and repertoire comparison: The tcR applies a diverse set of intersection procedures and a set of similarity measures to the compared repertoires: intersection by nucleotide or amino acid CDR3 sequences, Jaccard index, Morisita’s overlap index and sequential intersection of the most abundant clonotypes among repertoires (”top cross”, i.e. intersection between top-1000 from one repertoire with top-1000 from the other, then between top-2000 clonotypes, etc., see Fig. 1c).
Fig. 1 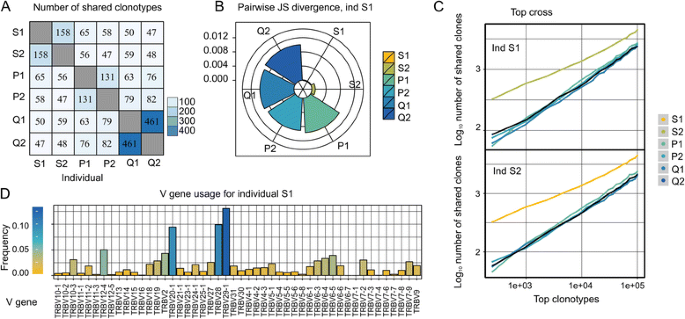
Examples of tcR data analysis visualisation. a. Heatmap of number of clonotypes with identical CDR3 amino acid sequences shared among individuals. b. Jensen-Shannon divergence of V gene usage for individual S1 and other individuals. c. The normalised number of identical TRB CDR3 nucleotide sequences in the top 1000 most abundant clonotypes, 2000 most abundant clonotypes, etc. for each possible pair of individuals. d. V gene usage for individual S1
-
4)
Repertoire diversity and gene usage analysis: For the analysis of the V and J gene usage, the package employs Shannon entropy measure, Jensen-Shannon divergence and Principal Component Analysis. To evaluate the repertoire diversity, the effective number of types (“true diversity”), Gini and Gini-Simpson indices, inverse Simpson index, Chao1 index and rarefaction analysis were implemented.
-
5)
Visualisation procedures: The package provides a number of functions for generating plots, including heatmaps of the number of shared CDR3 sequences, (see Fig. 1a), histograms of V and J gene usage (see Fig.1d), radar bar plots of the Jensen-Shannon divergence of the V gene usage among individuals (see Fig.1b) and TR length spectratyping.
-
6)
Artificial repertoire generation: The tcR package incorporates a procedure for artificial TR repertoire generation. Generative model provided with the package has been adopted from [1].

Results and discussion
The rapidly increasing number of B and T cells high-throughput sequencing studies has led to the development of specialised programs able to manipulate with the specific IG and TR sequencing data [12–18]. The downstream analysis of generated clonotype sets is usually performed by researchers in each lab individually using various algorithms generating diverse results and conclusions. Here we made an attempt to collect the most widely used downstream processing applications in a single package to simplify the immune receptors data analysis. The R package tcR is mainly dedicated to two types of users. First, it can be utilised by the beginners in TR repertoire data analysis. We provide two alternative pipelines with automatic report generation similar to that described in [22] for the analysis of either a single repertoire or a group of repertoires. Second, it is suitable for needs of advanced users. With the power and flexibility of the R language and the tcR platform providing the common subroutines a user can easily employ his own analysis methods and concentrate on research without spending time on reinventing the wheel.
The existing software is mainly tailored to perform the first stage of the TR data analysis – CDR3 sequence extraction and clonotype sets generation. Some of these programs include several simple options for downstream data processing. However this set is limited to primary descriptive statistics and restricted visualization (see Table 1 for the detailed comparison). Thus we believe that our tcR package will be useful for the researchers working with adaptive immune repertoires data. The development of such software could result in standardisation of data analysis making possible the proper interpretation of results obtained by different groups worldwide.
Case studies
tcR was applied to TR alpha (TRA) and TR beta (TRB) repertoires analysis in our recent papers. In [22] we have shown distinctive properties of identical twins repertoires such as higher similarity of V and J gene usage (see Fig.1b, Jensen-Shannon divergence for twin pair S1-S2) and an increased number of in-frame and out-of-frame CDR3 sequences shared among the most abundant clonotypes (see Fig.1c). In [23] we demonstrate that mother and child have an increased portion of shared clonotypes with identical V genes in the shared clonotypes pool. As this study was applied to the previously obtained data no ethic committee conclusion was required.
Future directions
In future we plan to continue adding new methods of repertoire comparisons, diversity estimation, to add parsers for data generated by Decombinator, IgBLAST and other software for extracting CDR3 sequences and aligning genes, and to optimise the package to efficiently handle large volumes of TR data for the analysis of massive repertoire data (tens of repertoires with millions of clonotypes). We plan to add more options for the automatic report generation, e.g. for tracking TR repertoires dynamics.
Conclusions
The R package tcR is a platform designed for the analysis of TR repertoire data, which has two major advantages. First, it consolidates a wide spectrum of possible approaches to TR repertoire analysis in a single package. Second, it offers new methods for the comparative analysis of TR repertoires. The package has been applied to the experimental NGS data and allowed to obtain valuable observations of the inter-individual similarity of TR repertoires. The developed package is providing a wide range of new opportunities for the TR repertoire data analysis.
Availability and requirements
Project name: tcR
Project home page: http://imminfo.github.io/tcr/
Operating system(s): Platform independent
Programming language: R [24], C++
Other requirements: R packages data.table, dplyr, ggplot2, grid, gridExtra, gtable, igraph, Rcpp, reshape2, roxygen2, stringdist, utils.
License: Apache v2.0 License
Any restrictions to use by non-academics: None
Abbreviations
- IG:
-
Immunoglobulin
- TR:
-
T cell receptor
- CDR:
-
Complementarity determining regions
- V:
-
Variable
- J:
-
Joining
- D:
-
Diversity
- PCA:
-
Principal component analysis
References
Murugan A, Mora T, Walczak AM, Callan CG. Statistical inference of the generation probability of T-cell receptors from sequence repertoires. Proc Natl Acad Sci U S A. 2012;109:16161–6.
Davis M, Bjorkman P. T-cell antigen receptor genes and T-cell recognition. Nature. 1988;334:395–402.
Lefranc M-P, Lefranc G. The T Cell Receptor FactsBook. Gulf Professional Publishing; 2001.
Lefranc M-P. Immunoglobulin and T Cell Receptor Genes: IMGT and the Birth and Rise of Immunoinformatics. Front Immunol. 2014;5:22.
Britanova OV, Putintseva EV, Shugay M, Merzlyak EM, Turchaninova MA, Staroverov DB, et al. Age-Related Decrease in TCR Repertoire Diversity Measured with Deep and Normalized Sequence Profiling. J Immunol. 2014;192:2689–98.
Mamedov IZ, Britanova OV, Bolotin DA, Chkalina AV, Staroverov DB, Zvyagin IV, et al. Quantitative tracking of T cell clones after haematopoietic stem cell transplantation. EMBO Mol Med. 2011;3:201–7.
Jiang N, He J, Weinstein JA, Penland L, Sasaki S, He X-S, et al. Lineage structure of the human antibody repertoire in response to influenza vaccination. Sci Transl Med. 2013;5:171ra19.
Venturi V, Quigley MF, Greenaway HY, Ng PC, Ende ZS, McIntosh T, et al. A mechanism for TCR sharing between T cell subsets and individuals revealed by pyrosequencing. J Immunol. 2011;186:4285–94.
Wang C, Sanders CM, Yang Q, Schroeder HW, Wang E, Babrzadeh F, et al. High throughput sequencing reveals a complex pattern of dynamic interrelationships among human T cell subsets. Proc Natl Acad Sci U S A. 2010;107:1518–23.
Alamyar E, Giudicelli V, Li S, Duroux P, Lefranc M-P. IMGT/HighV-QUEST: the IMGT web portal for immunoglobulin (IG) or antibody and T cell receptor (TR) analysis from NGS high throughput and deep sequencing. Immunome Res. 2012;8:26.
Alamyar E, Duroux P, Lefranc M-P, Giudicelli V. IMGT tools for the nucleotide analysis of immunoglobulin (IG) and T cell receptor (TR) V-(D)-J repertoires, polymorphisms, and IG mutations: IMGT/V-QUEST and IMGT/HighV-QUEST for NGS. Methods Mol Biol. 2012;569–604.
Li S, Lefranc M-P, Miles JJ, Alamyar E, Giudicelli V, Duroux P, et al. IMGT/HighV QUEST paradigm for T cell receptor IMGT clonotype diversity and next generation repertoire immunoprofiling. Nat Commun. 2013;4(May):2333.
Bolotin DA, Shugay M, Mamedov IZ, Putintseva EV, Turchaninova MA, Zvyagin IV, et al. MiTCR: software for T-cell receptor sequencing data analysis. Nat Methods. 2013;10:813–4.
Thomas N, Heather J, Ndifon W, Shawe-Taylor J, Chain B. Decombinator: A tool for fast, efficient gene assignment in T-cell receptor sequences using a finite state machine. Bioinformatics. 2013;29:542–50.
Giraud M, Salson M, Duez M, Villenet C, Quief S, Caillault A, et al. Fast multiclonal clusterization of V(D)J recombinations from high-throughput sequencing. BMC Genomics. 2014;15(D):409.
Ye J, Ma N, Madden TL, Ostell JM. IgBLAST: an immunoglobulin variable domain sequence analysis tool. Nucleic Acids Res. 2013;41(May):34–40.
Munshaw S, Kepler TB. SoDA2: A Hidden Markov Model approach for identification of immunoglobulin rearrangements. Bioinformatics. 2010;26:867–72.
Gaëta BA, Malming HR, Jackson KJL, Bain ME, Wilson P, Collins AM. iHMMune-align: Hidden Markov model-based alignment and identification of germline genes in rearranged immunoglobulin gene sequences. Bioinformatics. 2007;23:1580–7.
Nguyen P, Ma J, Pei D, Obert C, Cheng C, Geiger TL. Identification of errors introduced during high throughput sequencing of the T cell receptor repertoire. BMC Genomics. 2011;12:106.
Shugay M, Britanova OV, Merzlyak EM, Turchaninova MA, Mamedov IZ, Tuganbaev TR, et al. Towards error-free profiling of immune repertoires. Nat Methods. 2014;11:653–5.
Calis JJA., Rosenberg BR. Characterizing immune repertoires by high throughput sequencing: strategies and applications. Trends Immunol. 2014;35:581–90.
Zvyagin IV, Pogorelyy MV, Ivanova ME, Komech E, Shugay M, Bolotin DA, et al. Distinctive properties of identical twins’ TCR repertoires revealed by high-throughput sequencing. Proc Natl Acad Sci U S A. 2014;111:5980–5.
Putintseva EV, Britanova OV, Staroverov DB, Merzlyak EM, Turchaninova MA, Shugay M, et al. Mother and child T cell receptor repertoires: deep profiling study. Front Immunol. 2013;4(December):463.
R Core Team. R: A language and environment for statistical computing. R Foundation for Statistical Computing, Vienna, Austria. 2014. http://www.R-project.org/
Acknowledgments
This study was supported by state contract 14.604.21.0118; MCB program RAS; RFBR grants 14-04-01823, 13-04-01124, 14-04-01062; MK-4583.2015.4 and Dynasty Foundation Fellowship to IVZ; RFBR 15-34-21052 and MD-3044.2014.4 to DMC.
Author information
Authors and Affiliations
Corresponding author
Additional information
Competing interests
The authors declare that they have no competing interests.
Authors’ contributions
VIN and MVP have written the software code. VIN, MS, EAK and IVZ performed the review and analysis of existing software tools. MVP, EAK, DAB and IVZ tested the package and performed the analysis of experimental data sets. VIN, IZM, DMC and YBL supervised the software development and prepared the manuscript. All authors read and approved the final manuscript.
Vadim I. Nazarov and Mikhail V. Pogorelyy contributed equally to this work.
Rights and permissions
This article is published under an open access license. Please check the 'Copyright Information' section either on this page or in the PDF for details of this license and what re-use is permitted. If your intended use exceeds what is permitted by the license or if you are unable to locate the licence and re-use information, please contact the Rights and Permissions team.
About this article

Cite this article
Nazarov, V.I., Pogorelyy, M.V., Komech, E.A. et al. tcR: an R package for T cell receptor repertoire advanced data analysis. BMC Bioinformatics 16, 175 (2015). https://doi.org/10.1186/s12859-015-0613-1
Received:
Accepted:
Published:
DOI: https://doi.org/10.1186/s12859-015-0613-1