
Abstract
This work optimises the collection of solar energy within the period of its availability in order to increase its utilisation and also to enhance performance of heating systems that depend on it through appropriate determination of optimum solar collector tilt angles. Buoyancy-induced flow equation in solar collector pipe was established by continuity, energy and Navier–Stokes equations in cylindrical coordinates. Fundamental solar radiation equations were programmed to determine optimum tilt angles in locations within latitudes 1° and 14°. A set of data recorded from a pryanometer located on latitude 6.45° north of the equator was used to generate average monthly radiation over the latitudes. Graphs obtained from latitude 6° and 13° data were analysed to investigate solar radiation on some tilt angles. The optimum tilt angles for solar heating for periodic tracking of the sun in the region within latitudes 1° and 14° were predicted as ∅ + 25° for November, December and January; ∅ + 15° for February, September and October; ∅ − 15° for August; ∅ − 25° for May, June and July; and ∅ for March and April. The results of this work confirmed that solar radiation on tilted surface increases with latitude.
Background
Renewable energy obtained from the sun is very important because of the fact that it is free and environment-friendly [1]. The importance of detailed knowledge of solar radiation received from the sun at a site in the design and selection of solar devices cannot be overstated [2]. In order to optimise solar isolation on solar collectors, appropriate method to determine solar tilt angles at any given time is essential to increase the efficiencies of the collectors and that of the devices connected to them [3, 4]. The position of the earth relative to the sun changes with time; the change must be monitored adequately in order to increase the amount of energy being received by solar devices [5].
Solar radiation in low-latitude tropical region is not as intensified as that in high latitude tropical region due to cloudiness and high humidity in the former region [2]. For example, Nigeria is located between longitude 3° and 14° east of Greenwich and latitude 4° and 14° north of equator. Ojosu's [6] study on the iso-radiation map of Nigeria showed that the annual average solar radiation along the coastal areas is 3.7 kW/m2/day, while that in the semi-arid zone is 7.0 kW/m2/day. Interestingly, Abubakar [7] in an independent study showed that the mean annual average of total solar radiation varies from 3.5 kW/m2/day in the coastal latitudes to about 7.0 kW/m2/day along the semi-arid areas in the far north. The emerging conclusion from the past studies was that solar energy must be managed effectively in the southern region of Nigeria.
The magnitude of solar radiation received by a collector is a function of many factors such as location latitude, the declination angle (the angular position of the sun at solar noon with respect to the plane of the equator), tilt angle, the sunrise hour angle and the azimuth angle [8]. According to Benghanem [9], both the orientation and tilt angles have significant effects on the magnitude of the solar radiation reaching the surface of a collector. Many investigations have been carried out to determine the optimum tilt angle for solar collector. Honsberg [10] suggested the following tilt angles: ∅ + 15° for optimum, ∅ − 15° for maximum and ∅ for uniform power production. Some other research works suggested two values for optimum tilt angle, one for summer (rainy season in tropical region) and the other for winter (dry season in tropical region): ∅ ± 8° [11, 12] and ∅ ± 5° [11, 13] (‘+’ is for winter or dry season, while ‘−’ is for summer or rainy season).
In a solar system where thermal fluid is to be heated, mathematical simulation shows that for maximum flow rate, the solar collector tilt angle is 90° [14]. This specification is not suitable for solar collector, either in low or high latitude region for maximum solar energy collection. Therefore, the required optimum tilt angle of the solar collector should be less than 90°.
A lot of awareness is ongoing worldwide on solar energy utilisation. This research study determines appropriate periodic optimum tilt angles for solar collectors in different locations at different days of the year using Nigeria as a case study.
Fundamentals of solar radiation on earth surface
When solar rays hit a flat surface at an oblique angle, the rays are more spread out [5]. This means, the power of the beam is being spread out over a larger area. Figure 1 shows the relationship between radiation on horizontal surface and that on tilted surface. The ratio of normal radiation on tilted surface (HT) to that on horizontal surface (H) is given in terms of θz (the angle between the beam from the sun and vertical), θT and Hn as shown below [15]:

Radiation on horizontal and tilted surfaces.
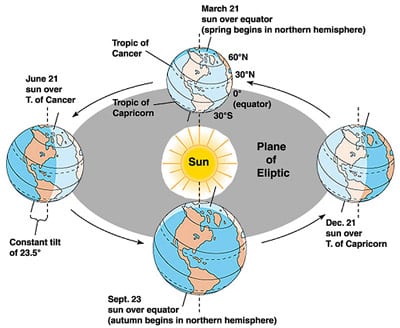
Maximum power into the solar collector occurs when the surface is normal to the incident solar radiation; however, it is not always possible with fixed solar collector since the relative position of the earth to the sun varies [10]. Outside the earth's atmosphere, at any given point in space, the energy given off by the sun (insolation) is nearly constant. On earth, however, that situation changes as a result of earth rotation about its axis, change in earth position in space as indicated in Figure 2 and the earth atmosphere which includes gases, clouds and dust [5].

The positions of the earth at different seasons of the year[16].
Fundamentals of induced thermo-siphoned flow through circular pipes
For simplicity without compromising the usefulness of the results, steady flow analysis can be adopted to determine the fluid flow regimes [20]. The three fundamental steady flow equations that govern the flow of thermal fluid in solar collector pipes are continuity, momentum and energy equations.
The continuity equation is
Navier–Stokes equation (momentum equation) for steady flow is
Below is the modified Navier–Stokes equation in cylindrical coordinate:
Energy equation for temperature distribution analysis is presented below:
The following assumptions prevailed [14]:
-
1.
Fluid properties are independent of temperature, i.e. μ, cp, β and k are constants.
-
2.
The Boussinesq approximation characterizes the buoyancy effects.
-
3.
The flow is fully developed, .
The momentum equation model for inclined pipe flow is shown in Figure 3.

Inclined pipe showing thermal fluid and energy flows.
Equation (8) can be simplified using Boussinesq approximation for free convection. By putting the assumption (3) above into consideration and by assuming that radial flow equals zero (v = 0)
Volumetric coefficient of thermal expansion is expressed through this equation:
For incompressible liquids, the term ρβ is nearly constant. This approximation is good for gravity-induced flow over vertical surfaces with negligible temperature variation of T∞ with x. It should be noted that Equation (10) should not be applied if the dependence between density and temperature is nonlinear in the temperature range of interest [17].
Momentum (9) was integrated to generate
By finding the average velocity of the flow in the pipe based on Equation (12), hence, Equation (13) is produced. The pressure-gradient term in the momentum equation is due to the hydrostatic pressure field outside the boundary layer [17], with
By substituting, Equation (14) in (13),
Furthermore, by substituting Equation (10) in Equation (15),
Simplifying the energy balance equation for the pipe line under steady state condition yields
By eliminating T − T∞ in Equation (16) using Equation (17) and by rational mathematical manipulation using Equation (18),
given that modified Grashof number is [14] and .
Equations (20) and (21) are produced from Equation (19) by substituting the relevant dimensionless parameters:
where H p = L sinθ
From Equation (21), it can be deduced that the fluid mass flow rate increases as the collector tilt angle increases; the maximum mass flow rate occurs at θ = 90° for any given length of the pipe. It is obvious from Equation (21) that Prandlt number plays an important role in the determination of magnitude of thermal fluid flow rate induced by buoyancy. The following deductions about thermal fluid used in solar collector are valid:
-
1.
Highly viscous thermal fluid will reduce heat transfer in the solar collector.
-
2.
Thermal fluid with low specific heat capacity is required for effective heat transfer from the solar collector.
-
3.
Thermal fluid with relatively high thermal conductivity is required for effective heat transfer from the solar collector.
Methods
A computer program was written to investigate suitability of water or methanol as thermal fluid for heat transfer in solar collector using Equations (20) and (21) above. The pipe length used for the simulation was 700 mm, while the pipes nominal diameters used were 12 and 20 mm, respectively. The simulation was carried out with solar radiation ranging between 0 and 1,000 W/m2, while the tilt angle of the collector was 30°. Methanol and water at average temperature (70°C) were used as thermal fluids in succession. The graphs in Figure 3 obtained from the simulation showed that the induced flow rates in the pipes increase with solar radiation intensity.
A pyranometer was used to measure horizontal radiation intensity at latitude 6.45° on a clear and sunny day at an hour interval from 7:00 am to 5:00 pm. The measurements are as shown in Table 1, and a bar chart plotted from them is shown in Figure 4. The assumption made in this study is that horizontal solar radiation received by similar solar collectors located at different latitudes within 1.0° and 14.0° is the same throughout the year. In other words, the measured data was assumed hypothetically for the different locations within latitude 1.0° and 14.0° throughout the year. The fundamental objective of this assumption is to investigate the resultant effect of the latitudes at the various locations, days of the year and tilt angles on the quantity of heat energy collected by the solar collectors. However, it should be noted that solar radiation measured at different latitudes are affected by humidity and other environmental conditions. The effects of these conditions are not considered in this paper to reduce avoidable complexities. The results from this analysis are expected to provide good platforms to predict the influence of the unconsidered factors. The appropriate tilt angles at different latitudes for different sessions of the year based on the above assumption were determined from a program developed from Equations (2) and (3) using C sharp software in Microsoft.net studio. The data simulated between latitudes 1° and 14° north of the equator are as shown in Tables 2 and 3.
Results and discussions
The graphs in Figure 5 show that methanol is better than water as thermal fluid for heat transfer in solar collector due to its low specific heat capacity and low viscosity. However, water is preferred to methanol where heat energy storage is required due to its high specific heat capacity. It is also observed that the size of the pipe, radiation intensity, tilt angle and properties of the thermal fluid determine the flow regime. The graph in Figure 6 shows the effect of solar collector tilting on flow rates of methanol in a 20-mm nominal diameter pipe under average solar intensity of 500 W/m2. It can be observed that tilting increases the flow rate of the thermal fluid in the solar collector. In the flow rate Equation (21) above, it was observed that maximum flow rate is produced when the tilt angle is 90°; this angle is not appropriate for maximum solar radiation collection.

Measured solar radiation intensity in W/m 2 against hour of the day.

Flow regime in 30° tilted pipeline in solar collector.

Methanol flow rate variation with tilt angles under 500 W/m 2 average solar intensity.
Several tilt angles for solar collectors as recommended from past and recent literatures were tested with the program developed from Equations (2) and (3). Tables 2 and 3 contain the data simulated for locations within latitudes 1° and 14° . The solar collector tilt angle in each location in Table 2 is equal to the location latitude (∅) plus 25°, while that of each location in Table 3 is equal to the location latitude (∅) minus 25°. It is important to note that a positive tilt angle in the northern hemisphere means that the collector is tilted facing south, while negative tilt angle in the northern hemisphere means that the collector is tilted facing north [1, 18, 19]. Figures 7 and 8 displayed the graphs of average monthly solar radiation against different months of the year for regions located on latitude 6° and 13°. The graphs show the different tilt angles investigated.

Average monthly solar intensity on tilted solar collector on location latitude 6°.

Average monthly solar intensity on tilted solar collector on location latitude 13°.
The average monthly solar radiation on horizontal solar collector surface for this simulation is 430 W/m2. It is indicated by dotted line in Figure 7 and Figure 8. Many publications on optimum tilt angle for solar collector favoured ∅ + 15° and ∅ + 10°. The inclusion of Tables 2 and 3 was deliberate in order to show data distributions on latitudes from 1° to 14° for tilt angles ∅ + 25° and ∅ − 25°. From Figures 7 and 8, it can be inferred approximately that from November to mid of January, the tilt angle obtained from ∅ + 25° produces more solar radiation intensity in the solar collector than tilt angles ∅ + 15° and ∅ + 10°. Close observation further revealed that tilt angle ∅ + 15° has better performance from middle of January to March and from middle of September to middle of October. The figures also show that appropriate tilt angle for the first 2 weeks of April and the last 2 weeks of July is ∅ − 15°. After the first 2 weeks of April to the last 2 weeks of July, appropriate tilt angle for maximum solar radiation in the solar collector is ∅ − 25°. About the last week of March and middle of August, none of the tilt angles investigated produced radiation above the average radiation on horizontal solar collector. However, to sustain thermal fluid flow in the collector, the tilt angle recommended is the solar collector location latitude.
The above recommendations on tilting are ideal for system, the efficiency of which depends on instantaneous thermal energy received rather than average thermal energy received over a period of time. Solar collector with large surface area may be difficult to tilt as recommended; in that respect, such collector may be tilted permanently to its location latitude. An important observation from Figures 7 and 8 above is that when solar collector is tilted to a permanent angle without periodical tilting to track the sun position at certain months of the year, the received solar radiation on tilted surface is less than that on horizontal surface. Under this condition, solar collector tilting is counter-productive.
The thermo-siphon mass flow rate equation in solar collector for fluid heating based on periodic tilting at different latitudes is given by
Observations from the Figures 7 and 8 are summarised in Table 4.
The chart shown in Figure 9 above was produced from Figures 7 and 8. It can be used to estimate appropriate tilt angles of solar collectors at locations having different latitudes.

Chart for estimating weekly tilting for optimum solar radiation collection.
Conclusion
The induced flow generated from tilted solar collector has been established for effective monitoring of solar collector performance. This work has successfully investigated recommendations from past research activities on solar collector tilting for enhanced performances with simplified approach, as far as data collection for analyses is concerned. The results obtained can be summarised as follows: for periodic tracking of solar collector throughout the year, the following are the recommended tilt angles: ∅ + 25° for November, December and January; ∅ + 15° for February, September and October; ∅ − 15° for August; ∅ − 250 for May, June and July; and ∅ for March and April. These recommendations are appropriate for solar collectors with tilting devices. The tilt angles ∅ + 25° and ∅ − 25° are not common in the literature; however, the results showed that they are relevant for periodic tracking of solar collector even though they are for a short period. It is further showed that solar radiation on tilted surface increases with latitude. This method of analysis demonstrated efficient management of time, energy and capital investment required in data collection to analyse appropriate tilt angles of solar collectors in comparison with past works done in this area. Finally, this paper has been able to provide formula for estimating thermo-siphon-induced flow rate in solar collector, and it has established the need to incorporate tilting mechanisms in solar collectors for better thermal efficiency.
Authors’ information
SIO is a chief lecturer in the Department of Industrial Maintenance Engineering, Yaba College of Technology, Lagos, Nigeria. He received his B.Eng. in Mechanical Engineering from the University of Benin, Nigeria in 1987 and M.Sc. in Chemical Engineering from the University of Lagos, Nigeria in 1996. He is a corporate member of the Nigerian Society of Engineers as well as a registered mechanical engineer of the Council for the Regulation of Engineering in Nigeria (COREN). His present area of research is optimisation of heat and mass transfer phenomena in solar adsorption refrigeration system using hybrid solar collector at University of Ibadan, Nigeria. He has published several journal papers on virtual prototyping of systems and renewable energy.
MOO obtained B.Sc. (First Class Honours) in Mechanical Engineering from the Obafemi Awolowo University (OAU), Ile-Ife, Nigeria in 1997 and Ph.D. in Mechanical Engineering from the University of Newcastle, NSW, Australia in 2004. He is an editorial board member of several international engineering journals. He has been a member of the American Society of Engineers (ASME) since 2003. MOO is a reader in the Mechanical Engineering Department, University of Ibadan, Nigeria. He specialises in energy analyses and thermo fluids. He has scores of publications in learned international journals and conference proceedings.
IFO obtained B.Eng. and M.Sc. in Mechanical Engineering from the University of Ibadan in 1986 and 1990 respectively. He also obtained his Ph.D. in Mechanical Engineering from the same University in 2009. He is a corporate member of the Nigerian Society of Engineers as well as a registered mechanical engineer of the Council for the Regulation of Engineering in Nigeria (COREN). He is also a corporate member of Institute of Environmental Engineers in Nigeria. IFO is a senoir lecturer in the Mechanical Engineering Department, University of Ibadan, Nigeria. He has several publications in peer-reviewed international and local journals.
Abbreviations
- Β:
-
Volumetric coefficient of thermal expansion
- δ:
-
Declination
- ∅:
-
Latitude (north positive)
- Μ:
-
Dynamic viscosity of thermal fluid
- Ω:
-
Hour angle, solar noon being zero, and each hour equals to 150 of longitude with morning positive and afternoon negative
- Ρ:
-
Fluid density in kg/m3
- θ:
-
Thermal fluid tilt angle in radian
- θT:
-
Angle between the beam from the sun and the vertical on the tilted plane
- θZ:
-
Zenith angle
- c:
-
Constant (values 0 or ±15 or ±25, etc.)
- cp:
-
Specific heat capacity of thermal fluid at constant pressure KJ/kgk
- d:
-
Number of days starting from 1 January to the given date
- g:
-
Acceleration due to gravity
- Gr*:
-
Modified Grashof number
- H:
-
Solar radiation on horizontal surface
- Hp:
-
Vertical distance between inlet and exit of the collector pipe
- HT:
-
Solar radiation on tilt surface
- k:
-
Thermal conductivity of thermal fluid (w/mk)
- L:
-
Pipe length
- Lat:
-
Latitude
- m:
-
Mass flow rate in kg/s
- p:
-
Fluid pressure in N/m2
- Pr:
-
Prandt number
- q:
-
Heat flux per unit length (W/m2)
- r/R:
-
Pipe radius in m
- Rb:
-
Ratio of radiation on tilted surface to that of horizontal surfaceS, Angle between the solar collector and the horizontal plane (angle of tilt)
- T:
-
Temperature in Kelvin
- T∞:
-
Temperature at infinity in K
- u/v:
-
Fluid velocities in m/s
- x/y:
-
Coordinates in m.
References
Chandrakumar BP, Jiwanlal LB: Development and performance evaluation of mixed-mode solar dryer with forced convection. IJEEE 2013, 4: 23.
Fagbenle RL: Optimum collector tilt angles and annual global radiation for Nigerian locations. Nigerian J. Renew. Energy 1991, 2(17):1–8.
Oko COC, Nnamchi SN: Optimum collector tilt angles for low latitudes the open renewable. Energy Journal 2012, 5: 7–14.
Gunerhan H, Hepbasli A: Determination of the optimum tilt angle of solar collectors for building applications. Build. Env. 2007, 42: 779–783. 10.1016/j.buildenv.2005.09.012
Gavin DJN: Solar Energy Projects for the evil Genius. 1st edition. Chicago: McGraw-Hill; 2007.
Ojosu JO: The iso-radiation map of Nigeria. Solar and Wind Technology 1990, 7(5):563–575. 10.1016/0741-983X(90)90065-A
Abubakar SS: Strategic developments in renewable energy. Nigeria: International Association for Economics, Sept-Dec; 2009. Accessed July 2013 http://www.iaee.org/en/publications/newsletterdl.aspx?id=75.
Kumarasamy S, Tulika S, Guddy S, Manicam P: Modelling and estimation of photosynthetically active incident radiation based on global irradiance in Indian latitudes. IJEEE 2013, 4: 21.
Benghanem M: Optimization of tilt angle for solar panel: case study for Madinah. Saudi Arabia Applied Energy 2011, 88: 1427–1433.
Honsberg C: Solar radiation. University of Delaware. (2008). Accessed 2 September 2012 http://www.eecis.udel.edu/~honsberg/Eleg620/02_Solar_radiation.pdf
Pavlović T, Pavlović ZL, Pantić L, Kostić J: Determining optimum tilt angles and orientations of photovoltaic panels in Nis Serbia. Contemporary Materials. 2010, 2: 151–156.
Lewis G: Optimum tilt of solar collectors. Solar and Wind Technology. 1978, 4: 407.
Garp HP, Gupta GL: Flat plate collectors: experimental studies and design data for India. New Delhi: Paper presented at the international solar energy congress; 16–21 January 1978.
Prayagi SV, Thombre SB: Parametric studies on buoyancy induced flow through circular pipes in solar water heating system. Journal of Engineering Science and Technology 2011, 3(1):616–627.
Duffie JA, Beckman WA: Solar engineering of thermal processes. 1st edition. New York: Wiley; 1974.
St. Rosemary Education Institution. The effect of the Earth's rotation and revolution. St. Rosemary Education Institution's Schoolworkhelper. (2013). Accessed 9 December 2012 http://schoolworkhelper.net/wp-content/uploads/2010/08/01m.jpg
Kays W, Crawford M, Weigan B: Convective heat and mass transfer. 4th edition. New York: McGraw-Hill; 2005.
Landau CR: Optimum tilt of solar panels. MACS Lab, Inc. (2012). Accessed 15 December 2012 http://www.macslab.com/optsolar.html
Pragya S: Solar energy generation potential along national high ways. IJEEE. 2013, 4: 16.
Bruce RM, Donald FY, Theodore HO: Fundamentals of Fluid Mechanics. 1st edition. New York: Wiley; 1990.
Acknowledgements
The authors wish to acknowledge the World Bank for initiating STEP-B project in higher institutions of learning in Nigeria. The project provided the pyranometer and computer used for this work. We appreciate people that contributed in one way or the other towards successful completion of this publication.
Author information
Authors and Affiliations
Corresponding author
Additional information
Competing interests
The authors declare that they have no competing interests.
Authors’ contributions
SIO carried out the preliminary studies, programming and prepared the draft of the manuscript. MOO and IFO both provided technical guide and review of the manuscript. All authors read and approved the final manuscript.
Authors’ original submitted files for images
Below are the links to the authors’ original submitted files for images.
Rights and permissions
Open Access This article is distributed under the terms of the Creative Commons Attribution 2.0 International License (https://creativecommons.org/licenses/by/2.0), which permits unrestricted use, distribution, and reproduction in any medium, provided the original work is properly cited.
About this article
Cite this article
Idowu, O.S., Olarenwaju, O.M. & Ifedayo, O.I. Determination of optimum tilt angles for solar collectors in low-latitude tropical region. Int J Energy Environ Eng 4, 29 (2013). https://doi.org/10.1186/2251-6832-4-29
Received:
Accepted:
Published:
DOI: https://doi.org/10.1186/2251-6832-4-29