
Abstract
The green regeneration of urban inventory is now much more viewed as a strategy to create “green finance”, in contrast to the urban renewal movement that was started in the 1950s and focused on the physical renovation of the built environment. This study draws on evidence-based theory to examine the spatial forms of residential communities in 36 urban districts of China. From a morphological perspective, it summarizes the spatial forms of residential environments at the level of buildings and microdistricts. The results indicate that in urban areas, the aspect ratio and shape coefficient of residential buildings have a significant impact on household energy consumption, and an appropriate increase in building density will help reduce carbon emissions. In conclusion, this study emphasizes the role of carbon reduction as a kind of “green finance” and provides a reference for subsequent urban renewal decisions in combination with China’s actual cases.
Introduction
According to UN Habitat, cities consume 78% of the world’s energy and produce more than 60% of greenhouse gas emissions (UN Habitat, 2022). In the field of energy and the environment, reducing the energy consumption of cities is listed as one of the main issues for both developing and developed countries (Lombardi, et al., 2017; Zhang, 2023). In addition to applying new green development strategies in urban growth in our world today, it is more important to carry out green transformation of the existing urban space, i.e., urban inventory (Dhakal, 2010). Generally, these urban inventories were constructed decades or even hundreds of years ago, and at that time, green and low-carbon construction was far from becoming an important principle of urban construction (Mumford, 1961; Yu and Zhang, 2021). Green renewal of urban inventory, which can increase the well-being of urban residents and can obtain extensive green finance support, has been endowed with more significance than ordinary urban renewal (Chan and Lee, 2008; Berrou, et al., 2019).
In the 1950s and 1960s, Western countries experienced a wave of urban renewal, which was also called urban regeneration in the United Kingdom and urban redevelopment in the United States (Caves, 2005). During this period, urban inventory renewal initiatives were motivated by dwindling tax revenue, unsightly circumstances, or difficult urban living conditions (Teaford, 2000; Hyra, 2012). Economic, social, and environmental rejuvenation are the core objectives of urban renewal (Davis and Whinston, 1961; Couch, 1990). As a typical contentious program, urban renewal has been viewed as a tool for control by detractors and as an economic engine and reform vehicle by supporters (Chuol, 2010). However, in the last two decades, however, renewal of urban inventory has reemerged as a crucial issue in the context of green transformation (Zheng et al., 2014). Instead of serving a single economic or social aim, it is increasingly understood that the primary objective of urban inventory renewal is to enhance the operational mode of urban inventory to promote sustainability (Pérez, et al., 2018). On this basis, a number of empirical studies have demonstrated the role of inventory spatial planning in carbon reduction (e.g., Komatsu et al., 2013; Onat et al., 2014; Huo et al., 2022; Mumtaz et al., 2023).
However, these practices have not received the same attention in the fast-growing cities of Asia, although such cities face more serious urban challenges. Since 1990, China has seen the world’s quickest urbanization and has one of the largest urban sprawl scales (Wang and Zhao, 2018). Economic revival was brought about by extensive construction and real estate development (Wang and Watson, 2007). Not surprisingly, the Chinese mainland has been increasing its carbon emissions, putting it in first place with a notable volume and a contribution of 28.8% in 2019 (Zhang et al., 2020). This is because the land inventory in urban centres has not been fully explored according to a scientific system, thereby leading to the inappropriate application of existing mature green carbon reduction methods; on the other hand, due to the lack of effective practical tools for local governments to guide and organize development, these governments can only focus on the short-term economic benefits of a new city development, which results in a larger amount of carbon emissions (Guo et al., 2023). These combined economic and political factors have led to a situation where local governments are willing to use carbon reduction methods in urban renewal but do not know how to reduce carbon emissions through green renewal.
The renewal of the urban inventory provides an opportunity to address the enormous challenges in terms of urban structure, urban function and human living conditions faced in China’s urbanization process and to achieve sustainable development goals (SDGs) (Xie et al., 2021). Urban inventory and inefficient urban land redevelopment are the major strategies of China’s urban renewal (Ye et al., 2021). As a typical rapidly urbanizing emerging economy, China’s urban inventory space is spatially renewed to repair the defects in the urban development process. Therefore, unlike urban regeneration in industrialized countries, China’s urban regeneration is mainly aimed at rejuvenating land that has not been fully utilized during rapid development (Zhao et al., 2021). In China, as the reform of territorial spatial planning continues, new land for construction is strictly controlled by national policy and has been significantly characterized by inventory planning (Liu and Zhou, 2021). The current problems in urban inventory planning can be summarized as the plurality of interested parties, the complexity of theoretical connotations, the dynamics of planning preparation and the ambiguity of decision-making mechanisms, which together lead to challenging approval decisions. Ultimately, the fact that China has not yet established scientific standards for urban inventory renewal constitutes the founding cause of these issues (Zhuang et al., 2019). In summary, inventory renewal, as an important solution to reduce urban carbon emissions, has yet to develop a sound decision-making system based on a systematic scientific basis. A complete set of solutions is needed to respond to the issue of green carbon reduction in urban regeneration to provide actionable recommendations for decision-makers.
Appropriate and science-based government policy leadership will help unlock innovative private investment and market-based solutions (Taghizadeh-Hesary, Yoshino (2019)). While research into evidence-based planning decisions is becoming a recent research area of heightened interest, there are very few further responses to urban inventory space. Research gaps still exist. First, evidence-based planning studies tend to focus on the city scale (e.g., Munier, 2011; Manupati et al., 2018) or individual building scale (e.g., Ho et al., 2012; Varela and Rada, 2017) rather than the neighborhood level. Urban renewal initiatives at the neighborhood level can be planned in terms of the local context in the neighborhood exists and operates (Boyle et al., 2018; Pérez et al., 2018) and at the same time such initiatives are able to reflect the sustainability vision at the city level. Furthermore, there is a distinctive lack of studies on urban renewal decision-making at the neighborhood level in the Chinese context. Second, the current planning decision-making mechanisms are still lacking in terms of scientific support, and this considerably affects policy effectiveness (Wu et al., 2014). Strategies and practical methods lack a specific scientific system for urban inventory renewal. Third, planning decisions are seen as an important tool for governments to achieve green finance in cities (Lv et al., 2021; Lee and Lee, 2022). These planning decision studies have established a link between science, planning and green renewal but lack systematic research, especially in terms of the green renewal of urban inventory. These lacunae seem to be particularly regrettable for the studies of sustainable urban development.
To fill this lacuna, this study aims to establish a scientific indicator system for planning decision-making relying on evidence-based theories and methods to provide a systematic, green and low-carbon scientific basis for the government’s urban planning decision-making. In this research, we specifically gathered the digital map database and the data on residential energy consumption of 36 urban districts of China to characterize the morphological aspects of the urban inventories. Considering the rise in residential energy consumption in Chinese cities during the COVID-19 epidemic lockdown, this study further examined the relationship between residential spatial form and energy use in an urban inventory, providing the groundwork for future green restoration of urban stock space. According to the results of an empirical study, there is a sizable window of opportunity for green financing in the rehabilitation and enhancement of existing urban residential neighborhoods. Residents’ carbon emissions, which account for a sizable portion of society’s overall carbon emissions, can be significantly reduced by modernizing the city’s current built environment. There is an urgent need to conduct a comprehensive assessment of the potential for transforming existing residential communities and developing green finance for cities and towns located in areas with less comfortable climate zones.
By doing so, this paper complements existing research in three ways: theoretical, methodological and policy recommendations. First, the paper develops a link between green finance, sustainable development and evidence-based theories. Second, it provides a research methodology for the evidence-based green carbon reduction of urban inventory space based on spatial patterns and an indicator evaluation system. Third, it provides feasible and operational solutions and policy recommendations for urban decision-makers based on the synthesis of theoretical and practical experiences in the urban economy, politics, and spatial patterns with evidence-based theories.
This study is structured as follows: in the following section, we review the theoretical insights drawn from the literature on urban inventory and green renewal, evidence-based decision-making, and evidence-based methodologies for urban inventory renewal. The third section identifies and describes the dataset and methodology and outlines the empirical analysis framework. Next, we present the empirical analysis results and discuss significant findings. The final section includes a discussion of the implications of the findings for future research on the green renewal of urban inventory.
Literature review
Primacy of “Green Finance” in carbon reduction and support for urban renewal
Green finance, as a direct and indirect element related to various SDGs, is a prominent initiative to reduce carbon emissions and their negative health impacts, develop climate-resilient infrastructure for cities and ensure environmental sustainability (Sachs et al., 2019; Taghizadeh-Hesary, Yoshino (2019)). It is usually defined as “financing of investments that provide environmental benefits” or “local, national or transnational financing-drawn from public, private and alternative sources of financing-that seeks to support mitigation and adaptation actions that will address climate change” (International Finance Corporation IFC (2016)). More attention has been increasingly devotedin the current research to its strong association with policy (Zhang, 2018).
Recent studies on green finance have gathered moreconcerns in understanding carbon reduction and support for urban renewal. Through the process of economic-environmental interactions, studies have examined environmental and urban sustainability as a pivotal principle of green finance and have shown that technological innovation is a crucial growth point in this process (Xie et al., 2022; Cheng et al., (2023); Sun et al., 2023). Renewable energy and energy transition have emerged as key players in promoting green finance. Renewable energy in green finance can support the reduction of new carbon emissions; for instance, renewable energy has a positive impact on the ecological footprint (Ulucak, Khan (2020); Nathaniel et al., 2020). Scholars have responded to this theme using a multitude of methods, such as using panel data, using the generalized method of moment (GMM) estimation, quarterly frequency time series data, heterogeneous econometric models, etc. (Khan et al., 2018; Wang et al., 2021; Akadiri et al., 2022; Ali et al., 2022), to provide specific approaches to measuring green finance.
Dilanchiev et al. (2023) noted that the common theme of preexisting studies is investigating the relationship between renewable energy and urbanization and the impact of this relationship on environmental outcomes such as greenhouse gas emissions, energy intensity, ecological footprint and pollution. Based on this, they developed a scale to identify the link between renewable energy, carbon emissions, urbanization and economic growth in 12 developing countries using a dynamic panel data approach. This reinforces the link between carbon reduction and related effects and green economic growth, which in turn guides green finance.
Studies have established the link between green finance and sustainable urban development through a range of approaches, but there is still a gap and a room for further improvement. The first is scale. Studies linking green finance and urban carbon reduction have been mostly focusing on the regional or municipal level, and hence there is room for further development of studies at a more granular level, especially in urban centres as areas with concentrated carbon emissions. The second is methodology. There are fewer studies that analyse carbon emission reductions in graphical form or by combining various econometric methods as a source of evidence (a small number of studies, e.g., Ali et al., 2023). The third is that interdisciplinary studies are still rare. Urban research is comprehensive, with studies scattered in economics, environmental governance, pollutant treatment, etc., but there are fewer studies that propose an integrative research framework from a macro perspective; such an integrative research framework can be used to synthesize the economic, political, and spatial patterns of cities, especially the linkages between the political systems of Asian countries, green finance, and urban sustainability. This is unfortunate with respect to the contribution of green finance to urban development. A few innovative studies focus on the impact of institutions on green finance, such as examining renewable energy from the perspectives of value orientation, utilitarian benefits, and collectivism, and describing the important role of political systems and policies on economic recovery from a macro perspective (Liu et al., 2022; Asif et al., 2023) and providing proven policy recommendations, and innovative directions for interdisciplinary research. Evidence-based policy-making, as a cutting-edge field of green finance and spatial renewal of inventory, helps to unify the above issues.
Urban inventory and green renewal as a cutting-edge direction
Urban regeneration based primarily on social or economic benefits is not a new problem, as was previously indicated, but it has received much academic discussion (Roberts, Sykes (1999)). However, over the last two decades, the significant urban carbon emissions and the pressing climate change pressure have served as a reminder of the healing potential of urban green renewal for the entire human society. Since well before the COVID-19 outbreak, various European research initiatives have focused on encouraging a more sustainable way of living, particularly in urban areas (Sessa et al., 2022). In an effort to generally enhance sustainable urban living circumstances, these projects (e.g., Dortmund in Germany, Turin in Italy, and Zagreb in Croatia) use natural solutions to address core environmental concerns (Kim et al., 2020). To increase wellbeing and map out a route towards a more sustainable socioeconomic system, they bring together cities via the topic of green urbanism (Beatley, 2012; Rodriguez-Rey et al., 2022).
It is important to include the green renewal concept in urban inventory planning. Research has increasingly focused on green renewal applications at small units and scales, such as energy consumption analysis in multiunit settlement planning (Dujardin et al., (2014); Fichera et al., 2016; Zhang et al., 2023), GIS-based subdivision of unit planning or neighborhood planning energy consumption (Camporeale and Mercader-Moyano, 2021; Zhang et al., 2022), parsing green renewal and other strategies at multiple meso-micro levels, such as planning units, control plans, neighborhoods and communities (Pérez et al., 2018; Guo et al., 2023), and strategies for sustainable urban renewal decision-making at the neighborhood level (Huang et al., 2020; Guo et al., 2023).
Only a small number of these studies have provided cutting-edge analysis of green renewal approaches in inventory spaces (Guo et al., 2023), and they still pay less attention to green renewal and scientific evidence implications. A great deal of original, exploratory work is still needed around green renewal-oriented planning decisions. Furthermore, in practical terms, the literature acknowledges the existence of a decision-research-practice disconnect in green-oriented planning (Farooq et al., 2022) and the need for scientific means to address this issue. This leads us to evidence-based theory and evidence-based planning.
Evidence-based decision-making and evidence-based planning as an intensely debated topic
The importance of “Evidence-based Policy-making” has been intensely debated in recent years, with the idea that policy development, change and implementation should be based on ‘evidence from scientific data analysis (Cairney, 2016; Alagna, 2022). “Evidence-based” ideology originated in the UK in the 1990s. As evidence-based medicine (Sackett et al., 1996) developed, it gradually expanded into social sciences such as social policy, psychology, education and justice. “Evidence-based policy-making” was introduced in the UK in 1999, with the expectation that there would be more new thinking, more active questioning of traditional ways of doing things, better use of evidence and research in policy-making, and more focus on policies that would have a long-term impact. To address macro- to microl-level issues such as policy complexity, irrational decision-making, innovation by decision-makers, and subject diversity, evidence-based approaches have been gradually developing as a theory and method of policy decision-making for the scientific formulation of public policy in various countries, and there has been a trend to use the theory for policy decision-making. The research tradition of evidence-based policy-making in academia can be broadly divided into four categories: first, research on evidence-based policy-making theory from different fields or at different levels (Head, 2010; Oliver & Cairney, 2019). Second, there are methodological inquiries into evidence-based decision-making and empirical research in specific domains (Triantafillou, 2015; Fleming and Rhodes, 2018; Hawkins and Alvarez Rosete, 2019; Mills et al., 2022), among others. Third is the role of experts being specific ‘evidence holders’ as actors in evidence-based decision-making (Synnot et al., 2018; Andrews et al., 2020; Christensen, 2021; Pistone et al., 2022). The fourth is “systematic research methods to judge the validity of evidence in evidence-based decision-making” (Christensen, 2018; Stewart et al., 2020).
In the field of urban planning, early research focused on evidence-based perspectives in planning, where a range of evidence (data and information) is collected and used in the planning process, and emphasized more pragmatically rather than adopting ideological forms of governance (Davoudi, 2006; Faludi and Waterhout, 2006). Scholars have used theory to examine the basic principles of evidence-based planning decisions (Forsyth et al., 2017; Johansson, 2019) and used quantitative methods to calculate (Valcárcel-Aguiar et al., 2022) or combine such methods with GIS-related visualization methods to generate evidence indicators for planning decisions (Hammond et al., 2021); moreover the use of integrative evidence and knowledge in local planning has emerged (Tobah et al., 2019; Kraaz et al., 2022; Willetts et al., 2022), with all these methods corroborating the enormous scope and research value of evidence-based applications in planning decision-making.
Evidence-based methods are a promising approach with a large number of applications in other fields, and there is scope for further research in planning. Evidence-based theory can provide a method for planning studies to assess the effects of green growth.
New interdisciplinary evidence-based methodologies for urban inventory space renewal green sustainability
Academics have focused on evidence-based green and low carbon planning decisions in recent years, and academic research on green and low carbon planning is expanding from a technical approach to a ‘technology-policy combination’. There is a long-standing discussion of the sources of evidence for green planning, where the quality of urban green spaces is investigated based on expertize of various attributes and characteristics of beauty (Clark, 1968; Nilsson, 1988), such as the Scenic Beauty Estimation Method, which focuses on whether public or expert knowledge constitutes “scientific evidence”, which in turn influences green low-carbon planning (Chen et al., 2019), and discursive discussions following artistic practice or following scientific evidence (Moosavi, Browne (2021)). Recent academic research has identified the need to define ‘evidence’ for the implementation of green low carbon planning, particularly the advantages of applying this perspective in areas where the urban built environment is largely complete (Matthews et al., 2015; McWilliam et al., 2015; Johns, 2019; Jerome et al., 2019; Nilsson et al., 2019), and a qualitative inductive approach to develop ‘comprehensive sources of evidence’ frameworks to help planning practitioners (Xiang et al., 2022; Fearn, 2022; Mofrad et al., 2022); moreover, quantitative approaches to framing and proposing responses (Reed et al., 2017; Gerlak et al., (2021); Guo & Yuan, 2022), integrating qualitative and quantitative foundations using different experimental designs (Stoltz & Grahn, 2021), or generating evidence-based conditions with affective semantics, discourse analysis and machine learning methods are established (Guo et al., 2022; Wang et al., 2022).
Research has shown that links between evidence-based urban inventory planning and green planning have been established, and directions for exploration at the meso-micro level have been recognized, but systematic analysis is rare due to the research-to-practice gap. In addition, evidence-based inventory planning decisions require specific technical approaches. For instance, based on the understanding that “inefficient urban land redevelopment is an inevitable option for sustainable urban transformation”, Han et al. (2022) develop a framework for assessing the spatial redevelopment potential that includes four dimensions: benefit, cost, supply, and expectation of redevelopment, while incorporating stakeholder needs into the framework. The study developed a multiscale redevelopment classification system using GIS and landscape index analysis, which have the advantage of being comprehensive in terms of decision dimensions and scales.
However, exploring the inclusion of a morphological approach in indicator assessment systems at the city scale is still rarely found. The logical basis for proposing mechanisms to optimize “how scientific evidence can better influence urban inventory green renewal planning decisions” is thin, and there is still a lack of exploration of frontier areas and the generation of an integrated and replicable research framework based on an interdisciplinary context.
Data and methodology
Data
When selecting empirical research objects, we first focus on the hot summer and cold winter (HSCW) zone among China’s building climate zones (Xu et al., 2013), which mainly covers the middle and lower reaches of the Yangtze River. Literally, the main border of the HSCW zone is hot, humid summers and cold, humid winters. More importantly, there is basically no central heating or central cooling in the cities of the HSCW zone. Whether in summer or in winter, residents can only use household air conditioners for cooling or heating. In such cases, the total electricity consumption of residents is sufficient to characterize their energy consumption and carbon emissions. Within the HSCW zone, we screened the official statistical data of residents’ daily electricity consumption in each city one by one and ultimately selected 36 districts, counties, and county-level cities as the research regions (Fig. 1). It should be noted that the residential energy consumption data we use are not the whole electricity consumption of the entire city (including industry-used electricity) but only the electricity consumption for residents’ daily lives. In addition, because these districts, counties, and county-level cities are all located in the same climate zone and are close to each other, this study ignored the climate micro differences in these sample areas to simplify the research content.

The sampled districts, counties, and county-level cities in China.
In terms of basic datasets on the spatial form of residential communities, this study used the digital map database of China from Baidu Map and AMAP, which are similar to Google Map and Open Street Map (Sun et al., 2021). As of July 2022, a total of over 300,000 residential building contour data and AOI (Area of Interest) data were collected from the 36 sampled districts. In terms of measuring energy consumption, this study uses urban residential electricity consumption as residential energy consumption data, as electricity is the main form of energy for residential life in the HSCW zone. The data are sourced from statistical yearbooks of relevant Chinese cities. In addition, previous studies have shown that socioeconomic indicators such as the per capita disposable income of residents are also important factors affecting residential energy consumption, and hence are included in this study.
Methodology
We proposed a list of indicators to fully grasp the morphological characteristics of residential buildings and communities. As shown in Table 1, 7 indicators are divided into two groups: indicators at the building level and those at the microdistrict level. The five indicators of the building level include contour width, depth, height, aspect ratio, and shape coefficient. In general, residential buildings with excessive depth might have poor lighting effects and could force residents to use electricity to supplement lighting, which can increase energy usage. Residential buildings’ width and height can also have an impact on the microclimate and ventilation effect inside the residential area, which in turn affects residents’ energy consumption. The aspect ratio and shape coefficient are generated based on the above three parameters and are crucial parameters for analysing the shape characteristics of buildings. Numerous studies have shown how these factors significantly affect how much energy a building uses (Catalina et al., 2008; Lin et al., 2015). For the microdistrict level, we included the plot floor area ratio (FAR) and building density. Properly increasing density can aid in achieving sustainable goals (for example, the ideal of “sustainability-as-density” in North America), but excessively congested areas can result in a considerable need for air conditioning (for example, space congestion in high-density East Asian cities), necessitating careful consideration (Noah et al., 2012; Guo et al., 2023). The calculation for each morphological indicator is given in Table 1.
Before conducting indicator calculations, preliminary cleaning of the digital map database is necessary. Microdistrict AOI data were used to filter out residential building contours from building contour data. Based on residential building contour vector data, this study conducted rectangular processing on residential building data to facilitate the calculation of contour width (Wc) and depth (D). According to China’s regulations, such as the Code for Design of Civil Buildings, data with floors and areas that do not comply with residential building standards, as well as data containing empty values, will be deleted. After the indicator calculation is completed, the data on the continuous expansion of aspect width, depth, and aspect ratio that are unreasonable will be deleted, ultimately obtaining more accurate residential building form indicator data.
We use multiple linear regression analysis to study the impact of different residential building form indicators on household energy consumption. Multiple linear regression analysis is a regression analysis based on the given values of multiple explanatory variables. It is a method of studying the linear relationship between a dependent variable and multiple independent variables.
Results and discussion
Morphological characteristics
Based on clarifying the dataset and research methods, this study takes Nantong city, Jiangsu Province, as an example to introduce the morphological characteristics and differences of urban residential space forms in different parts of each city. Specifically, a comparative study will be conducted using Chongchuan District and Tongzhou District of Nantong City as representative areas. The building level indicators, namely, building height (H), contour width (Wc), depth (D), aspect ratio (Ar), and shape coefficient (Sc), will be analysed one by one. Then, different types of residential buildings in the two districts will be identified for their morphological characteristics to characterize the morphological characteristics of residential buildings in the central urban area (Chongchuan District) and the surrounding urban area (Tongzhou District).
By comparing these two typical districts, it is observed that there may be significant differences in the form of residential space across different areas of the same city, which helps explain the significant differences in residential energy consumption between Tongzhou and Chongchuan.
Building height (H)
Referring to China’s Code for Design of Civil Buildings, Code for Fire Protection Design of Tall Buildings, and Residential Building Code, residential buildings are divided into four height groups: low rise (3 floors and below), multirise (4–6 floors), medium high rise (7–11 floors), and high rise (12 floors and above). As shown in Table 2, both Chongchuan District and Tongzhou District exhibit building height characteristics mainly consisting of high-rise and multistory residential buildings. Among them, although the proportion of low-rise and medium- to high-rise residential buildings in Chongchuan District is relatively small, they still have a certain scale. In Tongzhou District, there are no mid- to high-rise residential buildings, and the number of low-rise residential buildings only accounts for 0.5% (7 buildings). Due to the early construction of the central urban area, the new residential area includes the old area. The old areas are mainly low-rise residential buildings, mostly located in the centre of the urban area, and have historical and cultural value. The construction of the outer walled area was relatively late, and the new area was transformed from suburbs or old towns, with a relatively mature planning concept, presenting the urban appearance of a modern new city. Therefore, the central urban area represented by Chongchuan District has various types of residential buildings with varying heights, such as low-rise, multistory, medium- to high-rise, and high-rise buildings, presenting diversity and disorder. The peripheral urban areas, mainly in Tongzhou District, only have multistory and high-rise residential buildings, with very few low-rise and medium- to high-rise buildings, presenting uniformity of microdistrict.
Contour width (W c) and depth (D)
Based on the height analysis of residential buildings, this article summarizes the characteristics of the continuous width and depth of different height types of residential buildings in Chongchuan District and Tongzhou District of Nantong City. As shown in Figs. 2 and 3, various types of scattered points have good clustering near the mean point, and the standard deviation is small, and thus it can better reflect the overall architectural characteristics. According to Table 3, the four height types of residential buildings in Chongchuan District exhibit morphological characteristics of “small depth, large continuous expansion surface width” (Fig. 2a), “small depth, small continuous expansion surface width” (Fig. 2b), “large depth, small continuous expansion surface width” (Fig. 2c), and “large depth, large continuous expansion surface width” (Fig. 2d). The multistory and high-rise residential buildings in Tongzhou District exhibit the morphological characteristics of “small depth, small continuous expansion surface width” (Fig. 3b) and “large depth, large continuous expansion surface width” (Fig. 3d), which is similar to the corresponding height type of residential buildings in Chongchuan District. The average depth of multistory residential buildings in Tongzhou District is 1.75 m larger than that in Chongchuan District, and the average continuous width of high-rise residential buildings is 3.03 m larger than that in Chongchuan District. This indicates that multistory buildings in Chongchuan District are flatter and more elongated than those in Tongzhou District, while high-rise buildings in Tongzhou District are flatter and more elongated than those in Chongchuan District. According to the standard deviation, the difference in the width of the continuous expansion surface between Chongchuan District and Tongzhou District is stronger than the difference in the depth.

a–d Illustrate the scatter diagrams of low rise buildings, multi-rise, medium high rise, and high rise buildings separately.

a–d Illustrate the scatter diagrams of low-rise buildings, multi-rise, medium high rise, and high rise buildings separately.
Aspect ratio (A r ) and shape coefficient (S c)
In addition to basic residential building form indicators such as height, continuous width, and depth, the aspect ratio and shape coefficient are important indicators for characterizing building form. From Fig. 4, it can be seen that the aspect width to depth ratio in both areas is distributed in a bimodal pattern. The peak values in Chongchuan District are approximately 1.25 and 3.55 (Fig. 4a), with peak ranges of [1.0,2.1] and (2.1,4.6], accounting for 26.42% and 60.38%, respectively. The peak values in Tongzhou District are approximately 1.55 and 3.65 (Fig. 4b), with peak ranges of [1.0,2.2] and (2.2,4.4), accounting for 26.76% and 55.38%, respectively. It is evident that both areas exhibit a moderate aspect width to depth ratio (Ar ∈ (2.2,4.6)) for residential buildings. The distribution characteristics of residential buildings with a small aspect width to depth ratio (Ar ∈ [1.0,2.2]) are more common, while residential buildings with a large aspect width to depth ratio (Ar ∈ (4.6,8)) are less common. The body shape coefficients of both regions are distributed in a single peak shape, with a peak value of approximately 0.20 and a peak range of [0.10, 0.23]. The difference is that the peak range data of the body shape coefficient in Tongzhou District account for 75.38%, while Chongchuan District only accounts for 58.49%. The body shape coefficient still accounts for a certain scale (27.46% and 14.05%) in the two larger ranges (0.23,0.32% and (0.33,0.50). Both Chongchuan District and Tongzhou District are mainly residential buildings with small body shape coefficients, but there are many residential buildings with large body shape coefficients in Chongchuan District.

a, b Illustrate the aspect ratio and shape coefficient of residential buildings of Chongchuan District and Tongzhou District separately.
From the perspective of scatter distribution, the shape coefficient and aspect width to depth ratio of the two areas show a roughly negative correlation. The larger the aspect width to depth ratio of the building, the smaller the shape coefficient, that is, the longer the residential building, the less concave and convex its surface, and the closer it is to a simple rectangle.
Based on the above analysis of the indicators of the building level, we conduct feature recognition on residential buildings in Chongchuan District and Tongzhou District, Nantong city.
-
(1)
The low-rise residential buildings demonstrate a large average contour width and a small average depth, and the layout of residential units basically follows the same pattern. Most of them are connected by parallel combinations of low elevator households (Fig. 5a, b). This kind of residential microdistrict shows a large average aspect ratio and a larger average shape coefficient but a small average plot FAR.
Fig. 5: Typical layout of residential buildings. 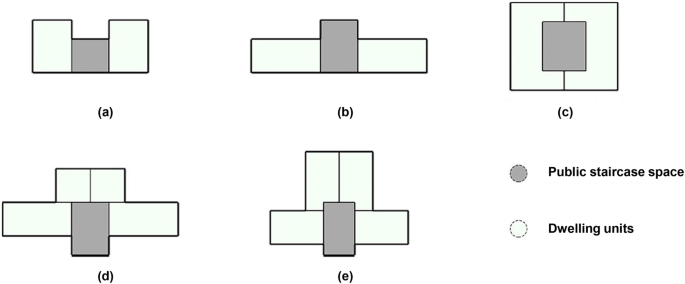
a–e Illustrate five typical layout of residential buildings separately.
-
(2)
In contrast, the multirise residential buildings present both small contour widths and small depths, as well as diverse layout patterns. There are single-family layouts with one elevator, one household, and two elevators, two households (Fig. 5c), as well as parallel combinations of two elevators, four households, or two elevators, six households (Fig. 5a, b). Single-family residential buildings have a smaller average aspect ratio, a larger average shape coefficient, and a higher average plot FAR. The aspect ratios of parallel residential buildings are moderate, and the shape coefficients are small. The average plot FAR of Chongchuan District is lower, while that of Tongzhou District is higher.
-
(3)
The medium high-rise residential buildings show a small average contour width but a large depth, mostly displaying a triangle-shaped layout (Fig. 5d, e). This type of residential community demonstrates a small average aspect ratio and a small average shape coefficient but a high average plot FAR.
-
(4)
The high-rise buildings show a large average contour width and depth, and most of them present a parallel layout (Fig. 5a, b). This kind of residential pattern has a moderate average aspect ratio, a low average shape coefficient, and a high average plot FAR.

Mechanism of energy consumption
This article uses multiple linear regression analysis to explore the impact of different forms of indicators on energy consumption at the building and community levels. Electricity consumption per unit area is selected as the dependent variable, and indicators such as spatial form and per capita disposable income are used as explanatory variables, namely, independent variables. To ensure the correctness of the analysis results, a collinearity test was carried out to eliminate obvious collinearity indicators (VIF > 10), such as the width of the continuous development surface, depth, and area perimeter ratio, and the final regression variables are summarized in Table 3.
The results of multiple linear regression analysis are shown in Table 4, and the final coefficient of determination (R-squared) and adjusted R-squared are both 0.139, indicating that the fitting performance is good. The F test is a significance test of the regression equation. The larger the F value, the greater the difference, and the more statistically significant the regression equation. The significance of this model is less than 0.01, and the F value is large, indicating that the model is very significant. According to the regression coefficients and significance tests of each indicator (Table 4):
-
(1)
The significance of the building height is higher than 0.05, indicating that the impact of building height on energy consumption is not significant enough. In comparison, the significance of other indicators is less than 0.05, with strong significance.
-
(2)
At the building level, the aspect ratio and shape coefficient are positively correlated with the energy (electricity) consumption per residential building area. The regression coefficient (Beta) of the aspect ratio is greater than that of the shape coefficient, indicating that the larger the aspect ratio or shape coefficient is, the higher the energy consumption of residential buildings. More importantly, the aspect ratio of residential buildings has a greater impact on energy consumption than the shape coefficient.
-
(3)
At the microdistrict level, the plot FAR and building density are negatively correlated with electricity consumption per unit area. The regression coefficient (Beta) of the plot FAR is smaller than that of the building density, indicating that the higher the community plot ratio or building density is, the lower the energy consumption of residential buildings, and the impact of plot ratio on energy consumption is greater than that of building density.
-
(4)
Overall, per capita disposable income, aspect ratio, and plot ratio have a significant impact on building energy consumption.
The final regression model is:
E = −17.890 + 0.326 I + 0.136 Ar + 0.035 Sc - 0.117 FAR - 0.083 BD
Overall, the results verify the spatial differences in residential communities in different urban districts. From the significance of the regression results, the impact of building height on residential energy consumption is not significant, while other spatial form indicators show good significance. From the perspective of regression normalization coefficients, different morphological parameters demonstrate different impacts on residential energy consumption. Referring to the Design Standard for Energy Efficiency of Residential Buildings in Severe Cold and Cold Zones of China, the shape coefficient is directly related to building energy consumption, and the energy consumption of residential buildings increases with the increase in the shape coefficient. This study found through regression analysis that the shape coefficient of residential buildings in the HSCW zone is positively correlated with energy consumption, proving that reducing the shape coefficient is an important way to reduce building energy consumption.
However, we also found that the impact of the aspect ratio on energy consumption is much greater than that of the body shape coefficient. The larger the aspect ratio is, the greater the energy consumption. In areas with hot summers and cold winters, the planning, design, and renovation of residential areas need to pay attention to controlling the aspect width to depth ratio. On the one hand, it is necessary to avoid excessive combination or connection of residential buildings resulting in excessive continuous expansion of aspect width. On the other hand, it is possible to explore increasing the depth of residential buildings appropriately to reduce the aspect width to depth ratio. In addition, the designer should optimize the composite pattern of the house type and maintain a reasonable aspect depth ratio while having complete functions. Finally, there is a negative correlation between community-level indicators and energy consumption, and the impact of building-level indicators on energy consumption is relatively close. The larger the plot FAR is, the higher the building density and the lower the energy consumption of residential buildings. However, excessive plot FAR and building density can reduce living comfort, requiring design solutions to achieve a balance between comfort and energy efficiency.
These empirical research findings show that there is a significant opportunity for green financing in the renovation and improvement of existing urban residential areas. On the one hand, it has been established that renovating the city’s current built environment can effectively reduce residents’ carbon emissions, which make up a sizeable amount of society’s total carbon emissions. According to the notion of green finance, financial investments are made in the repair of urban built environments. On the other hand, the reduced carbon emissions from urban renewal can be transformed into capital through the carbon emissions trading market, fostering a positive flow of money in urban renewal investment and financing.
Conclusions and policy recommendations
Since cities are the primary contributors to carbon emissions, creating green and low-carbon cities should be a major focus of efforts to combat climate change (UN habitat, 2022). Over half of the world’s population now lives in urban areas, making green urban stock space renewal the primary goal for achieving low-carbon development goals. Generally, one of the biggest obstacles to urban renewal efforts is a lack of funding (Samara, 2010). However, as green and low-carbon urban development and construction become the primary objectives, the effect of carbon emission reduction has emerged as a significant source of “green finance” supporting the urban renewal process.
This study organized the spatial forms of residential communities in 36 regions of China from the standpoint of evidence-based theory, summarized the spatial forms of residential spaces in various regions from a morphological perspective, extracted a number of indicators at the level of residential buildings and residential communities, and confirmed the spatial differences of residential communities in various urban areas. According to the results, residential space design has a major influence on how much energy is used by urban residents, and enhancing residential space form can significantly lower carbon emissions from urban residents. It can encourage a positive cycle of capital flow and further optimize and improve the urban built-up space, as is typical of green financing. Therefore, we call on all cities and towns, especially those located in areas with less comfortable climate zones, to conduct a comprehensive assessment of the potential for transforming existing residential communities and developing green finance. By proposing targeted “green finance generation policies based on spatial renewal”, the green and sustainable transformation of these urbanization areas could be accelerated.
Several limitations with respect to these results need to be acknowledged. The digital map database from Baidu Map and AMAP accounts for only a limited share of all residential communities on the Chinese mainland (Shao et al., 2021). The proportion of newly constructed buildings may be higher than that in the real world. Another source of uncertainty is our ignorance of climate micro differences between the 36 districts in mainland China. The lack of a rigorous check of the microclimates of intercity flows means that the study findings need to be interpreted cautiously. Notwithstanding these limitations, the study offers some insight into the energy consumption and carbon emission mechanism of urban residential districts.
Overall, the research in this article is still a macro, top-down argument and analysis, and numerous data issues raise doubts about the validity of some of its conclusions. To further support the potential of residential spaces to provide sustainable green finance, we believe that conducting field investigations on representative urban built-up areas and using vivid and authentic real-life cases can support the research conclusions from a bottom-up perspective. The most significant source of inspiration for this study came from looking at green city plans from the perspectives of architectural and urban design.
Data availability
The data that support the findings of this study are available from Baidu and AMAP but restrictions apply to the availability of these data, which were used under licence for the current study, and so are not publicly available. Data are however available from the authors upon reasonable request and with permission of Baidu and AMAP.
References
Akadiri SS, Adebayo TS, Nakorji M, Mwakapwa W, Inusa EM, Izuchukwu OO (2022) Impacts of globalization and energy consumption on environmental degradation: what is the way forward to achieving environmental sustainability targets in Nigeria. Environ Sci Pollut Res 29(40):60426–60439. https://doi.org/10.1007/s11356-022-20180-7
Alagna, F (2022) So much promise, so little delivery: evidence-based policy-making in the EU approach to migrant smuggling. J Eur Integr, 1–17. https://doi.org/10.1080/07036337.2022.2102166
Ali N, Phoungthong K, Khan A, Abbas S, Dilanchiev A, Tariq S, Sadiq MN (2023) Does FDI foster technological innovations? Empirical evidence from BRICS economies. Plos one 18(3):e0282498. https://doi.org/10.1371/journal.pone.0282498
Ali N, Phoungthong K, Techato K, Ali W, Abbas S, Dhanraj JA, Khan A (2022) FDI, Green innovation and environmental quality nexus: new insights from BRICS economies. Sustainability 14(4):2181. https://doi.org/10.3390/su14042181
Andrews N, Gabbay J, Le-May A, Miller E, Petch A, O’Neill M (2020) Story, dialogue and caring about what matters to people: progress towards evidence-enriched policy and practice. Evid Policy 16(4):597–618. https://doi.org/10.1332/174426420X15825349063428
Asif MH, Zhongfu T, Dilanchiev A, Irfan M, Eyvazov E, Ahmad B (2023) Determining the influencing factors of consumers’ attitude toward renewable energy adoption in developing countries: a roadmap toward environmental sustainability and green energy technologies. Environ Sci Pollut Res 30(16):47861–47872. https://doi.org/10.1007/s11356-023-25662-w
Beatley T (2012) Green urbanism: Learning from European cities. Island press, Washington, DC
Berrou, R, Dessertine, P, & Migliorelli, M (2019) An overview of green finance. The rise of green finance in Europe: opportunities and challenges for issuers, investors and marketplaces, 3–29. https://doi.org/10.1007/978-3-030-22510-0_1
Boyle L, Michell K, Viruly F (2018) A critique of the application of neighborhood sustainability assessment tools in urban regeneration. Sustainability 10(4):1005. https://doi.org/10.3390/su10041005
Cairney P (2016) The politics of evidence-based policy making. Springer, Berlin
Camporeale PE, Mercader-Moyano P (2021) A GIS-based methodology to increase energy flexibility in building cluster through deep renovation: a neighborhood in Seville. Energy Build 231:110573. https://doi.org/10.1016/j.enbuild.2020.110573
Catalina T, Virgone J, Blanco E (2008) Development and validation of regression models to predict monthly heating demand for residential buildings. Energy Build 40(10):1825–1832. https://doi.org/10.1016/j.enbuild.2008.04.001
Caves RW (ed) (2005) Encyclopedia of the City Taylor & Francis, London
Chan E, Lee GK (2008) Critical factors for improving social sustainability of urban renewal projects. Soc Indic Res 85:243–256. https://doi.org/10.1007/s11205-007-9089-3
Cheng, C, Yang, X, Jiang, F, & Yang, Z (2023) How to synergize different institutional logics of firms in cross-border acquisitions: a matching theory perspective. Manag Int Rev 1–30. https://doi.org/10.1007/s11575-023-00502-8
Christensen J (2018) Economic knowledge and the scientization of policy advice. Policy Sci 51(3):291–311. https://doi.org/10.1007/s11077-018-9316-6
Christensen J (2021) Expert knowledge and policymaking: a multi-disciplinary research agenda. Policy Politics 49(3):455–471. https://doi.org/10.1332/030557320X15898190680037
Chen H, Qiu L, Gao T (2019) Application of the eight perceived sensory dimensions as a tool for urban green space assessment and planning in China. Urban Forestry Urban Green 40:224–235. https://doi.org/10.1016/j.ufug.2018.10.001
Chuol, JLP (2010) The United States Outer Executive Departments and Independent Establishments & Government Corporations. Xlibris Corporation
Clark SBK (1968) Landscape survey and analysis on a national basis. Plan Outlook 4(1-2):15–29. https://doi.org/10.1080/00320716808711394
Couch, C (1990) Urban renewal: theory and practice, p 79 London: Macmillan
Davis OA, Whinston AB (1961) The economics of urban renewal. Law Contemp Probs 26:105
Davoudi S (2006) Evidence-based planning: rhetoric and reality. disP- Plan Rev 42(165):14–24. https://doi.org/10.1080/02513625.2006.10556951
Dhakal S (2010) GHG emissions from urbanization and opportunities for urban carbon mitigation. Curr Opin Environ Sustain 2(4):277–283. https://doi.org/10.1016/j.cosust.2010.05.007
Dilanchiev, A, Nuta, F, Khan, I, & Khan, H (2023) Urbanization, renewable energy production, and carbon dioxide emission in BSEC member states: implications for climate change mitigation and energy markets. Environ Sci Pollut Res, 1–13. https://doi.org/10.1007/s11356-023-27221-9
Dujardin S, Marique AF, Teller J (2014) Spatial planning as a driver of change in mobility and residential energy consumption. Energy Build 68:779–785. https://doi.org/10.1016/j.enbuild.2012.10.059
Faludi A, Waterhout B (2006) Introducing evidence-based planning. disP- Plan Rev 42(165):4–13. https://doi.org/10.1080/02513625.2006.10556950
Farooq S, Ozturk I, Majeed MT, Akram R (2022) Globalization and CO2 emissions in the presence of EKC: a global panel data analysis. Gondwana Res 106:367–378. https://doi.org/10.1016/j.gr.2022.02.002
Fearn G (2022) The age of the manager is over? Shale gas fracking and the challenge to the post-political regime for English planning. Political Geogr 93:102550. https://doi.org/10.1016/j.polgeo.2021.102550
Fichera A, Inturri G, La Greca P, Palermo V (2016) A model for mapping the energy consumption of buildings, transport and outdoor lighting of neighbourhoods. Cities 55:49–60. https://doi.org/10.1016/j.cities.2016.03.011
Fleming J, Rhodes R (2018) Can experience be evidence? Craft knowledge and evidence-based policing. Policy politics 46(1):3–26. https://doi.org/10.1332/030557317X14957211514333
Forsyth, A, Salomon, E, & Smead, L (2017) Creating healthy neighborhoods: evidence-based planning and design strategies. Routledge
Gerlak AK, Elder A, Pavao-Zuckerman M, Zuniga-Teran A, Sanderford AR (2021) Agency and governance in green infrastructure policy adoption and change. J Environ Policy Plan 23(5):599–615. https://doi.org/10.1080/1523908X.2021.1910018
Guo Y, Li Y, Qian Y (2022) Local government debt risk assessment: a deep learning-based perspective. Inf Process Manag 59(3):102948. https://doi.org/10.1016/j.ipm.2022.102948
Guo Y, Xu H, Wu S (2023) How network resources empower expert involvement? Evidence from urban planning decision-making in China. Chin. Public Adm. Rev. 14(4):238–255. https://doi.org/10.1177/15396754231199170
Guo Y, Yuan Y (2022) Assessing the energy resources policy agenda: evidence from China’s green express policy. Resour Policy 79:103037. https://doi.org/10.1016/j.resourpol.2022.103037
Guo Y, Zhang Z, Burçin B, Lin Q (2023) Novel issues for urban energy-saving management: enewal of leftover space. Sustain Energy Technol Assess 55:102934. https://doi.org/10.1016/j.seta.2022.102934
Hammond EB, Coulon F, Hallett SH, Thomas R, Hardy D, Kingdon A, Beriro DJ (2021) A critical review of decision support systems for brownfield redevelopment. Sci Total Environ 785:147132. https://doi.org/10.1016/j.scitotenv.2021.147132
Han B, Jin X, Wang J, Yin Y, Liu C, Sun R, Zhou Y (2022) Identifying inefficient urban land redevelopment potential for evidence-based decision making in China. Habitat Int 128:102661. https://doi.org/10.1016/j.habitatint.2022.102661
Hawkins B, Alvarez Rosete A (2019) Judicialization and health policy in Colombia: the implications for evidence‐informed policymaking. Policy Stud J 47(4):953–977. https://doi.org/10.1111/psj.12230
Head BW (2010) Reconsidering evidence-based policy: Key issues and challenges. Policy Soc 29(2):77–94. https://doi.org/10.1016/j.polsoc.2010.03.001
Ho AK, Sidanius J, Pratto F, Levin S, Thomsen L, Kteily N, Sheehy-Skeffington J (2012) Social dominance orientation: Revisiting the structure and function of a variable predicting social and political attitudes. Personal Soc Psychol Bull 38(5):583–606. https://doi.org/10.1177/0146167211432
Huang L, Zheng W, Hong J, Liu Y, Liu G (2020) Paths and strategies for sustainable urban renewal at the neighbourhood level: a framework for decision-making. Sustain Cities Soc 55:102074. https://doi.org/10.1016/j.scs.2020.102074
Huo T, Ma Y, Xu L, Feng W, Cai W (2022) Carbon emissions in China’s urban residential building sector through 2060: a dynamic scenario simulation. Energy 254:124395. https://doi.org/10.1016/j.energy.2022.124395
Hyra DS (2012) Conceptualizing the new urban renewal: comparing the past to the present. Urban Aff Rev 48(4):498–527. https://doi.org/10.1177/1078087411434905
International Finance Corporation (IFC) (2016) Green Finance: A Bottom-up Approach to Track Existing Flows
Jerome G, Sinnett D, Burgess S, Calvert T, Mortlock R (2019) A framework for assessing the quality of green infrastructure in the built environment in the UK. Urban Forestry Urban Green 40:174–182. https://doi.org/10.1016/j.ufug.2019.04.001
Johns CM (2019) Understanding barriers to green infrastructure policy and stormwater management in the City of Toronto: a shift from grey to green or policy layering and conversion. J Environ Plan Manag 62(8):1377–1401. https://doi.org/10.1080/09640568.2018.1496072
Johansson K (2019) Evidence-based social service in Sweden: a long and winding road from policy to local practice. Evid Policy: A J Res, Debate Pract 15(1):85–102. https://doi.org/10.1332/174426417X15123846324591
Khan MTI, Yaseen MR, Ali Q (2018) The dependency analysis between energy consumption, sanitation, forest area, financial development, and greenhouse gas: a continent-wise comparison of lower middle-income countries. Environ Sci Pollut Res 25:24013–24040. https://doi.org/10.1007/s11356-018-2460-x
Kim G, Newman G, Jiang B (2020) Urban regeneration: community engagement process for vacant land in declining cities. Cities 102:102730. https://doi.org/10.1016/j.cities.2020.102730
Komatsu S, Ha HD, Kaneko S (2013) The effects of internal migration on residential energy consumption and CO2 emissions: a case study in Hanoi. Energy Sustain Dev 17(6):572–580. https://doi.org/10.1016/j.esd.2013.10.002
Kraaz L, Kopp M, Wunsch M, Plank-Wiedenbeck U (2022) The scaling potential of experimental knowledge in the Case of the Bauhaus. MobilityLab. Erf (Ger) Urban Plan 7(3):274–284. https://doi.org/10.17645/up.v7i3.5329
Lee CC, Lee CC (2022) How does green finance affect green total factor productivity? Evidence from China. Energy Econ 107:105863. https://doi.org/10.1016/j.eneco.2022.105863
Lin M, Pan Y, Long W, Chen W (2015) Influence of building shape coefficient on energy consumption of office buildings in hot-summer-and-cold-winter area of China. Build Energy Efficiency 2015(10):63–68
Liu Y, Zhou Y (2021) Territory spatial planning and national governance system in China. Land Use Policy 102:105288. https://doi.org/10.1016/j.landusepol.2021.105288
Liu Y, Dilanchiev A, Xu K, Hajiyeva AM (2022) Financing SMEs and business development as new post Covid-19 economic recovery determinants. Econ Anal Policy 76:554–567. https://doi.org/10.1016/j.eap.2022.09.006
Lombardi M, Laiola E, Tricase C, Rana R (2017) Assessing the urban carbon footprint: an overview. Environ Impact Assess Rev 66:43–52. https://doi.org/10.1016/j.eiar.2017.06.005
Lv C, Bian B, Lee CC, He Z (2021) Regional gap and the trend of green finance development in China. Energy Econ 102:105476. https://doi.org/10.1016/j.eneco.2021.105476
Manupati VK, Ramkumar M, Samanta D (2018) A multi-criteria decision making approach for the urban renewal in Southern India. Sustain Cities Soc 42:471–481. https://doi.org/10.1016/j.scs.2018.08.011
Matthews T, Lo AY, Byrne JA (2015) Reconceptualizing green infrastructure for climate change adaptation: barriers to adoption and drivers for uptake by spatial planners. Landsc urban Plan 138:155–163. https://doi.org/10.1016/j.landurbplan.2015.02.010
McWilliam W, Brown R, Eagles P, Seasons M (2015) Evaluation of planning policy for protecting green infrastructure from loss and degradation due to residential encroachment. Land Use Policy 47:459–467. https://doi.org/10.1016/j.landusepol.2015.05.006
Mills D, Pudney S, Pevcin P, Dvorak J (2022) Evidence-based public policy decision-making in smart cities: does extant theory support achievement of city sustainability objectives. Sustainability 14(1):3. https://doi.org/10.3390/su14010003
Mofrad, F, Ignatieva, M, & Vernon, C (2022) The discourses, opportunities, and constraints in Canberra’s Green Infrastructure planning. Urban Forestry & Urban Greening, 127628. https://doi.org/10.1016/j.ufug.2022.127628
Moosavi S, Browne GR (2021) Advancing the adaptive, participatory and transdisciplinary decision-making framework: the case of a coastal brownfield transformation. Cities 111:103106. https://doi.org/10.1016/j.cities.2021.103106
Mumford, L (1961). The city in history: Its origins, its transformations, and its prospects (Vol. 67). Houghton Mifflin Harcourt
Mumtaz F, Li J, Liu Q, Tariq A, Arshad A, Dong Y, Liu C (2023) Impacts of green fraction changes on surface temperature and carbon emissions: comparison under forestation and urbanization reshaping scenarios. Remote Sens 15(3):859. https://doi.org/10.3390/rs15030859
Munier, N (2011) A strategy for using multicriteria analysis in decision-making: a guide for simple and complex environmental projects. Springer Science & Business Media
Nathaniel S, Anyanwu O, Shah M (2020) Renewable energy, urbanization, and ecological footprint in the Middle East and North Africa region. Environ Sci Pollut Res 27:14601–14613. https://doi.org/10.1007/s11356-020-08017-7
Nilsson, K (1988) Meetings of industry and landscape. Visual aspects of the design and placement of industrial objects in the landscape. Stad och Land (Sweden)
Nilsson, K, Bentsen, P, Grahn, P, & Mygind, L (2019) What is the scientific evidence with regard to the effects of forests, trees on human health and well-being?. Sante Publique, (HS1), 219–240. https://doi.org/10.3917/spub.190.0219
Noah Q, Moos M, Lynch N (2012) Sustainability-as-density and the return of the social: the case of vancouver, British Columbia. Urban Geogr 33(7):1055–1084. https://doi.org/10.2747/0272-3638.33.7.1055
Oliver K, Cairney P (2019) The dos and don’ts of influencing policy: a systematic review of advice to academics. Palgrave Commun 5(1):1–11. https://doi.org/10.1057/s41599-019-0232-y
Onat NC, Egilmez G, Tatari O (2014) Towards greening the US residential building stock: a system dynamics approach. Build Environ 78:68–80. https://doi.org/10.1016/j.buildenv.2014.03.030
Pérez MGR, Laprise M, Rey E (2018) Fostering sustainable urban renewal at the neighborhood scale with a spatial decision support system. Sustain Cities Soc 38:440–451. https://doi.org/10.1016/j.scs.2017.12.038
Pistone, I, Lidström, A, Bohlin, I, Schneider, T, Zuiderent-Jerak, T, & Sager, M (2022) Evidence-based practice and management-by-knowledge of disability care: rigid constraint or fluid support?. Evid Policy, 1–19. https://doi.org/10.1332/174426421X16390538025881
Reed MS, Allen K, Attlee A, Dougill AJ, Evans KL, Kenter JO, Whittingham MJ (2017) A place-based approach to payments for ecosystem services. Glob Environ change 43:92–106. https://doi.org/10.1016/j.gloenvcha.2016.12.009
Roberts P, Sykes H (eds) (1999) Urban regeneration: a handbook. Sage, New York
Rodriguez-Rey D, Guevara M, Linares MP, Casanovas J, Armengol JM, Benavides J, García-Pando CP (2022) To what extent the traffic restriction policies applied in Barcelona city can improve its air quality? Sci Total Environ 807:150743. https://doi.org/10.1016/j.scitotenv.2021.150743
Sachs JD, Woo WT, Yoshino N, Taghizadeh-Hesary F (2019) Importance of green finance for achieving sustainable development goals and energy security. Handb green Financ: Energy security Sustain Dev 10:1–10
Sackett DL, Rosenberg WM, Gray JM, Haynes RB, Richardson WS (1996) Evidence based medicine: what it is and what it isn’t. Bmj 312(7023):71–72. https://doi.org/10.1136/bmj.312.7023.71
Samara TR (2010) Policing development: Urban renewal as neo-liberal security strategy. Urban Stud 47(1):197–214. https://doi.org/10.1177/0042098009349772
Sessa MR, Russo A, Sica F (2022) Opinion paper on green deal for the urban regeneration of industrial brownfield land in Europe. Land Use Policy 119:106198. https://doi.org/10.1016/j.landusepol.2022.106198
Shao W, Su X, Lu J, Liu J, Yang Z, Cao Y, Wang K (2021) The application of big data in the analysis of the impact of urban floods: A case study of Qianshan River Basin. J Phys: Conf Ser 1955(No. 1):012061. https://doi.org/10.1088/1742-6596/1955/1/012061. Junep.IOP Publishing
Stewart E, Smith-Merry J, Geddes M, Bandola-Gill J (2020) Opening up evidence-based policy: exploring citizen and service user expertise. Evid Policy 16(2):199–208. https://doi.org/10.1332/174426420X15838217456181
Stoltz J, Grahn P (2021) Perceived sensory dimensions: An evidence-based approach to greenspace aesthetics. Urban Forestry Urban Green 59:126989. https://doi.org/10.1016/j.ufug.2021.126989
Sun G, Li G, Dilanchiev A, Kazimova A (2023) Promotion of green financing: Role of renewable energy and energy transition in China. Renew Energy 210:769–775. https://doi.org/10.1016/j.renene.2023.04.044
Sun, Y, Huang, J, Yuan, C, Fan, M, Wang, H, Liu, M, & Qin, B (2021, October). GEDIT: geographic-enhanced and dependency-guided tagging for joint POI and accessibility extraction at baidu maps. In Proceedings of the 30th ACM international conference on information & knowledge management, pp 4135–4144
Synnot AJ, Lowe D, Merner B, Hill SJ (2018) The evolution of Cochrane evidence summaries in health communication and participation: seeking and responding to stakeholder feedback. Evid Policy 14(02):335–347. https://doi.org/10.1332/174426417X14942367785260
Taghizadeh-Hesary F, Yoshino N (2019) The way to induce private participation in green finance and investment. Financ Res Lett 31:98–103. https://doi.org/10.1016/j.frl.2019.04.016
Teaford JC (2000) Urban renewal and its aftermath. Hous policy debate 11(2):443–465. https://doi.org/10.1080/10511482.2000.9521373
Tobah S, Kothari A, Britten N, LeMoine K (2019) Are we addressing the knowledge translation needs of community-based organisations? A mixed-methods study. Voluntary Sect Rev 10(2):129–149. https://doi.org/10.1332/204080519X15638825087468
Triantafillou P (2015) The political implications of performance management and evidence-based policymaking. Am Rev Public Adm 45(2):167–181. https://doi.org/10.1177/0275074013483872
Ulucak R, Khan SUD (2020) Determinants of the ecological footprint: role of renewable energy, natural resources, and urbanization. Sustain Cities Soc 54:101996. https://doi.org/10.1016/j.scs.2019.101996
UN Habitat (2022) World Cities Report 2022: Envisaging the future of cities. United Nations Human Settlements Programme: Nairobi, Kenya, 41–44
Valcárcel-Aguiar B, Murias P, Vecino-Aguirre A (2022) Liveability versus sustainability in Spanish cities: first evidences using synthetic indicators. Appl Res Qual Life 17(4):1935–1960. https://doi.org/10.1007/s11482-021-10005-z
Varela, ES, & Rada, SB (2017) El Programa de Recuperación Urbana Ribera Norte; veinte años de aciertos y desaciertos de una política de proyectos urbanos en Chile. Revista de Urbanismo, (36). https://doi.org/10.5354/ru.v0i36.45676
Wang R, Cao M, Yao Y, Wu W (2022) The inequalities of different dimensions of visible street urban green space provision: a machine learning approach. Land Use Policy 123:106410. https://doi.org/10.1016/j.landusepol.2022.106410
Wang, T, & Watson, J (2007) Who owns China’s carbon emissions. Tyndall Briefing Note, 23(23)
Wang Y, Zhao T (2018) Impacts of urbanization-related factors on CO2 emissions: evidence from China’s three regions with varied urbanization levels. Atmos Pollut Res 9(1):15–26. https://doi.org/10.1016/j.apr.2017.06.002
Wang Z, Jebli MB, Madaleno M, Doğan B, Shahzad U (2021) Does export product quality and renewable energy induce carbon dioxide emissions: evidence from leading complex and renewable energy economies. Renew Energy 171:360–370. https://doi.org/10.1016/j.renene.2021.02.066
Willetts J, Priadi C, Ombasta O, Wulandari D, Imtiyaz I, Sudhiastiningsih NNSN, Listyasari M (2022) Co-developing evidence-informed adaptation actions for resilient citywide sanitation: Local government response to climate change in Indonesia. Environ Plan B: Urban Analytics City Sci 49(8):2129–2150. https://doi.org/10.1177/23998083221098740
Wu J, Chang IS, Lam KC, Shi M (2014) Integration of environmental impact assessment into decision-making process: practice of urban and rural planning in China. J Clean Prod 69:100–108. https://doi.org/10.1016/j.jclepro.2014.01.100
Xiang Y, Hedblom M, Wang S, Qiu L, Gao T (2022) Indicator selection combining audio and visual perception of urban green spaces. Ecol Indic 137:108772. https://doi.org/10.1016/j.ecolind.2022.108772
Xie H, Wen J, Choi Y (2021) How the SDGs are implemented in China——A comparative study based on the perspective of policy instruments. J Clean Prod 291:125937. https://doi.org/10.1016/j.jclepro.2021.125937
Xie X, Zheng W, Umair M (2022) Testing the fluctuations of oil resource price volatility: a hurdle for economic recovery. Resour Policy 79:102982. https://doi.org/10.1016/j.resourpol.2022.102982
Xu L, Liu J, Pei J, Han X (2013) Building energy saving potential in Hot Summer and Cold Winter (HSCW) Zone, China—Influence of building energy efficiency standards and implications. Energy Policy 57:253–262. https://doi.org/10.1016/j.enpol.2013.01.048
Ye L, Peng X, Aniche LQ, Scholten PH, Ensenado EM (2021) Urban renewal as policy innovation in China: from growth stimulation to sustainable development. Public Adm Dev 41(1):23–33. https://doi.org/10.1002/pad.1903
Yu Y, Zhang N (2021) Low-carbon city pilot and carbon emission efficiency: Quasi-experimental evidence from China. Energy Econ 96:105125. https://doi.org/10.1016/j.eneco.2021.105125
Zhang D (2018) Energy finance: background, concept, and recent developments. Emerg Mark Financ Trade 54(8):1687–1692. https://doi.org/10.1080/1540496X.2018.1466524
Zheng HW, Shen GQ, Wang H (2014) A review of recent studies on sustainable urban renewal. Habitat Int 41:272–279. https://doi.org/10.1016/j.habitatint.2013.08.006
Zhang Z, Guan D, Wang R, Meng J, Zheng H, Zhu K, Du H (2020) Embodied carbon emissions in the supply chains of multinational enterprises. Nat Clim Change 10(12):1096–1101. https://doi.org/10.1038/s41558-020-0895-9
Zhang Z, Guo Y, Feng L (2022) Externalities of dockless bicycle-sharing systems: implications for green recovery of the transportation sector. Econ Anal Policy 76:410–419. https://doi.org/10.1016/j.eap.2022.08.009
Zhang Z, Chen M, Zhong T, Zhu R, Qian Z, Zhang F, Yan J (2023) Carbon mitigation potential afforded by rooftop photovoltaic in China. Nat Commun 14(1):2347. https://doi.org/10.1038/s41467-023-38079-3
Zhang, Z (2023) Mapping U.S.-China technological “decoupling”: Beyond U.S.-China relations. Environment and Planning B: Urban Analytics and City Science 50(7):2002–2005. https://doi.org/10.1177/23998083231189938
Zhao Y, An N, Chen H, Tao W (2021) Politics of urban renewal: an anatomy of the conflicting discourses on the renovation of China’s urban village. Cities 111:103075. https://doi.org/10.1016/j.cities.2020.103075
Zhuang T, Qian QK, Visscher HJ, Elsinga MG, Wu W (2019) The role of stakeholders and their participation network in decision-making of urban renewal in China: the case of Chongqing. Cities 92:47–58. https://doi.org/10.1016/j.cities.2019.03.014
Acknowledgements
This research was made possible through funding from the National Social Science Fund of China (Grant No. 22CZZ019). We are also indebted to University Research Centre for Urban and Environmental Studies, Xi’an Jiaotong-Liverpool University, Yuneng Jiang, and Suyu Wang of Soochow University for their support.
Author information
Authors and Affiliations
Contributions
Introduction and literature review were performed by YG. ZZ was involved in data processing (including collection and analysis), discussing the results, and concluding. All authors read and approved the final manuscript.
Corresponding author
Ethics declarations
Competing interests
The authors declare no competing interests.
Ethical approval
Ethical approvalEthical approval was not required as the study did not involve human participants.
Informed consent
This article does not contain any studies with human participants performed by any of the authors.
Additional information
Publisher’s note Springer Nature remains neutral with regard to jurisdictional claims in published maps and institutional affiliations.
Rights and permissions
Open Access This article is licensed under a Creative Commons Attribution 4.0 International License, which permits use, sharing, adaptation, distribution and reproduction in any medium or format, as long as you give appropriate credit to the original author(s) and the source, provide a link to the Creative Commons license, and indicate if changes were made. The images or other third party material in this article are included in the article’s Creative Commons license, unless indicated otherwise in a credit line to the material. If material is not included in the article’s Creative Commons license and your intended use is not permitted by statutory regulation or exceeds the permitted use, you will need to obtain permission directly from the copyright holder. To view a copy of this license, visit http://creativecommons.org/licenses/by/4.0/.
About this article

Cite this article
Guo, Y., Zhang, Z. Reducing carbon emissions through green renewal: insights from residential energy consumption in Chinese urban inventory districts from an evidence-based decision-making perspective. Humanit Soc Sci Commun 11, 54 (2024). https://doi.org/10.1057/s41599-023-02417-z
Received:
Accepted:
Published:
DOI: https://doi.org/10.1057/s41599-023-02417-z
- Springer Nature Limited