
Abstract
We identify the characteristics and specifications that drive the out-of-sample performance of machine-learning models across an international data sample of nearly 1.9 billion stock-month-anomaly observations from 1980 to 2019. We demonstrate significant monthly value-weighted (long-short) returns of around 1.8–2.2%, and a vast majority of tested models outperform a linear combination of predictors (our baseline factor benchmark) by a substantial margin. Composite predictors based on machine learning have long-short portfolio returns that remain significant even with transaction costs up to 300 basis points. By comparing 46 variations of machine-learning models, we find that the models with the highest return predictability apply a feed-forward neural network or composite predictors, with extending rolling windows, including elastic net as a feature reduction, and using percent ranked returns as a target. The results of our nonlinear models are significant across several classical asset pricing models and uncover market inefficiencies that challenge current asset pricing theories in international markets.
Introduction
In recent years, top finance journals have published more than 400 anomaliesFootnote 1 and exponentially expand the factor zoo (Harvey and Liu 2019; Cochrane 2011) calling for different methods and higher hurdle rates (Harvey and Liu 2014; Harvey et al. 2016; Harvey 2017; Harvey and Liu 2019). Thereby, a noticeable tendency of a “(home) bias in academic research in finance” in the United States of America (U.S.) has been highlighted by Andrew Karolyi (2016) for published anomalies. This circumstance ignores potential regional differences, such as the post-publication profitability decline of 58% for numerous anomalies in the US stock market observed by McLean and Pontiff (2016) in contrast to a mostly insignificant post-publication decline in other countries reported by Jacobs and Müller (2020).
In addition to the predominant focus on the US stock universe in the field of asset pricing, there has also been a particular emphasis on linear models, such as ordinary least squares. However, linear models do not seem to be able to handle the multidimensionality of return predictors sufficiently (e.g., Azevedo and Hoegner 2023). Unlike linear models, machine-learning algorithms, with their increased complexity, potentially have enhanced capabilities in handling these issues of anomaly-based research.
Among the recent literature that applies machine learning in asset pricing, Gu et al. (2020) compare a variety of machine-learning methods in a US sample with 94 firms’ characteristics and eight macroeconomic predictors, covering a period from 1957 to 2016. They find that trees and neural networks performed the best. Tobek and Hronec (2020) conduct a similar study with an international sample from 1963 to 2018 and find that machine learning is profitable around the globe and survives on a liquid universe of stocks. Chen et al. (2023) suggest a methodology that integrates four neural networks to leverage conditioning information and predict individual stock returns. Their research employs a dataset comprising 46 stock anomalies and 178 macroeconomic time series, spanning from 1967 to 2016, to estimate stock returns. The results show that their model yields a yearly Sharpe ratio of 2.6, which surpasses the linear special case of their model, which reports a Sharpe ratio of 1.7. More recently, Azevedo and Hoegner (2023) analyze the predictability of 299 capital market anomalies enhanced by 30 machine-learning approaches for the US market. They find that risk-adjusted returns of a machine-learning-based investment strategy are significant across alternative asset pricing models. The results are robust considering transaction costs with round-trip costs of up to 2% and including only anomalies after publication.
While evidence suggests that machine learning can be used to enhance the predictability power of anomalies in international markets (e.g., Tobek and Hronec 2020; Drobetz and Otto 2021; Cakici et al. 2022; Hanauer and Kalsbach 2022; Leippold et al. 2022; Breitung 2023; Fieberg et al. 2023), previous studies do not identify the characteristics and specifications (e.g., machine-learning algorithms, target values, rolling windows, and features reduction) that make machine-learning models successful at predicting stock returns. Furthermore, with exception of the contemporaneous study by Cakici et al. (2022)Footnote 2 there is to our knowledge no other comprehensive overview of the potential return predictability of a wide variety of machine-learning models for a representative global sample.
To examine the characteristics that make machine learning successful at predicting stock returns, our study examines nonlinear relationships among anomalies across the international stock universe, applying a broad range of different machine-learning algorithms and parameters. In contrast to the data sample of Tobek and Hronec (2020) consisting of 153 unique signals, we incorporate 240 individual anomalies for our machine-learning models to avoid omitting essential factors. Even in the first year 2003 of the post-publication scenario, our dataset already contains 90 published anomalies compared to 55 in Tobek and Hronec (2020). In addition, we evaluate a comprehensive international data sample with up to 38,001 firms per month compared to 4058 stocks in the case of Tobek and Hronec (2020). While they primarily focus on 23 developed countries in the regions USA, Japan, Asia Pacific, and Europe, we take a more holistic view, including Emerging and Frontier Markets. Lastly, we do not exclude micro-caps as machine learning is insensitive to outliers (Anand et al. 2019), and we are interested in the impact these particular stocks can have on the predictability of the machine-learning models. Hence, we ensure a vast and multifaceted data sample as the foundation of our analysis within the entire international universe. Nevertheless, we test if the results are robust for economically important stocks.
This versatile foundation embodies complex nonlinear relationships among signals which can be exploited by our models. We largely follow previous studies (e.g., Azevedo and Hoegner 2023; Gu et al. 2020) in which a variety of machine-learning algorithms are applied to develop profitable trading strategies in long-short portfolios. With a larger number of algorithms compared to Tobek and Hronec (2020) and Gu et al. (2020), our set of applied models comprises one Generalized Linear Model (GLM), two trees-based approaches [e.g., Distributed Random Forest (DRF) and Gradient Boosting Machine (GBM)], and two Feedforward Neural Network (FNN) models with both a wide and a narrow architecture. These models are analyzed twice by training them with two target values, namely, the raw returns and the percent-ranked returns as input. Supplementary, we include a variant of a recurrent neural network (RNN) with a long short-term memory (LSTM), typically very suitable for time series. Surprisingly, the FNN models outperform the RNN in both raw-return and percent-ranked portfolios settings with the highest monthly value-weighted return on average of 2.24% within a percent-ranked long-short portfolio for the larger FNN.
As a major difference compared to Gu et al. (2020), we do not support their finding for neural networks in finance “that ‘shallow’ learning outperforms ‘deep’ learning" (Gu et al. 2020, p. 2269). As our results reflect mixed outcomes, we find evidence that the superiority of a FNN rather depends on the target values chosen than on the learning architecture. Our “deep” FNN with five hidden layers (99,021 parameters) seems to outperform with scaled values (i.e., with percent-ranked returns), while our “shallow" large FNN with three hidden layers (251,759 parameters) performs better in comparison with the “deep" FNN trained on raw-returns. Noteworthy, Gu et al. (2020) analyze only 94 anomalies in the US stock market. Since they focus on a substantially lower fraction of the existing factor zoo in the USA, this might be a plausible explanation for their significantly lower Sharpe ratios of up to 1.35 for their neural network forecast compared to the Sharpe ratios for our neural networks ranging between 1.87 and 2.48 for the global market.
Furthermore, this study is accompanied by several additional supporting analyses expanding the research procedure of comparable meta-studies like Tobek and Hronec (2020) and Gu et al. (2020). Firstly, to reduce the influence of unnecessary noise due to correlated anomalies, we simultaneously preprocess our data with a range of feature selection methodologies based on significance levels, unsupervised machine-learning models such as regularization approaches like least absolute shrinkage and selection operator (lasso) regression and elastic net selections. Then, combined with three rolling window training techniques, we complete the set of tested models while improving the performance with some applied techniques. In total, the monthly return on average for a single model can reach up to 2.71% in the case of the percent-ranked FNN with an extending learning window. Finally, we enrich our study by analyzing round-trip costs, the upper limit for transaction costs, in which trading strategies remain significant at the 0.05 level. The round-trip costs estimation of up to 328 basis points is another demonstrative indicator of robust results which are neither traceable to data snooping nor transaction costs.
We also propose a combination of all machine-learning models. As a result, we observe significant monthly returns on average for the composite predictors, ranging between 1.85% and 2.60%, with t-statistics largely above the critical value of 3 proposed by Harvey et al. (2016). Consequently, these results further strengthen the improbability that significant outperformance of the models is justified by p-hacking.
We then identify the characteristics and specifications that make machine-learning models successful at predicting returns. We measure the long-short portfolio returns of portfolios formed on predictions from 46 machine-learning models. We find that a combination of machine-learning models performs at least as well as any single model. Among the single models, the highest returns are achieved with FNN models. Extending and 10-year rolling windows are the window training models with the highest return performance. In terms of target, we find that percent ranked returns outperform raw returns. Finally, elastic net reports the highest average return among feature reduction methods. Despite the superiority of machine-learning models over linear models, we find that specifications can play a major role in return predictability. The difference between the long-short returns of the machine-learning models with the best and worst return predictability is 171 basis points per month.
While we are mindful of reducing data snooping risk, the question is to what extent current factor models explain the return of these models. Testing our findings against eight distinct factor models, such as the two Fama–French factor models (Fama and French 1993, 2015), we find significant alphas for all tested machine-learning models. These results challenge the Efficient Market Hypothesis (EMH) in the international stock universe. Especially as our STATEW models enjoy alpha figures ranging between 1.10% and 2.64% with t-statistic values far above the minimum significance hurdle rate for new factors of 3.00.
Overall, we contribute to the existing literature mainly in the following three aspects. First, we highlight the tremendous potential of machine-learning algorithms for investors seeking profitable trading strategies and for scholars to understand (international) asset pricing in more detail. We offer a wide variety of 40 applied machine learning and six combinations of models using distinct algorithms, different feature reduction methods, and static and rolling training techniques. We quantify significant outperformance almost universally over single anomalies and our linear combined baseline factor benchmark. Thus, this paper extends the broad analysis of machine-learning models in the US market by Gu et al. (2020) and Azevedo and Hoegner (2023) by adding international evidence as well as identifying the characteristics and specifications that drive the out-of-sample performance of machine-learning models.
Second, we extend the literature by comparing models with different features and parameters. By doing so, it is possible to assess the impact on the predictability power of the models by changing the target value, the machine-learning algorithms, the window training, and the feature reduction. In particular, the elastic net can outperform the full feature, which is evidence that for international markets, some predictors might add some noise to the model, and feature reduction can be a solution for dealing with the multidimensionality of international data. Furthermore, we find that training the machine-learning models based on percent-rank returns shows superior results over the most common approach, which is based on raw returns (e.g., Gu et al. 2020).
Third, we alleviate the data dredging risk of comparing a single machine-learning model by combining our entire set of tested machine-learning models into several overarching composite predictors. The approach of combining multiple forecasts is associated with enhanced forecast accuracy as widely proven by the statistical research (Clemen 1989; Bates and Granger 1969; Makridakis and Hibon 2000; Timmermann 2006). Inspired by Rasekhschaffe and Jones (2019), we scale the combination concept to multiple composite predictors with international evidence containing our entire set of applied model variations.
Our study is structured as follows. In section "Data and methodology", we describe the origin of our international sample and the underlying methodology of our paper in detail. Subsequently, we prepare the results of our empirical study in a twofold fashion. Starting with section "Performance evaluation of individual anomalies and the baseline factor", we discuss the performance of the individual anomalies and combine the full feature base into one overarching baseline factor. The purpose of this baseline factor is to serve as a linear benchmark for our complex machine-learning models in section "Portfolio construction with machine learning algorithms in a static window". Here, we construct future return predictors using various training and preprocessing methodologies. Then, we compare and interpret the performance of our tested machine-learning models in section "Comparison and robustness tests of machine learning models". We discuss the findings concerning feature importance, transaction costs, and results against traditional factor models. We further combine our set of tested machine-learning models into several composite predictors. Lastly, we conclude in section "Conclusion".
Data and methodology
Our methodology consists of two phases. Within the first phase, we assess the performance of the individual anomalies (i.e., cross-sectional stock return predictors) with a classical portfolio-sort analysis. Then, we combine the single performance of our anomalies into one overarching signal, the baseline factor, intended to serve as a linear benchmark. We compare this linear benchmark with different nonlinear machine-learning models on their predictive power and additional profits in the second phase. These machine-learning models are built on the international anomaly dataset and encompass several distinct algorithms, feature reduction techniques, rolling windows modifications, and training concepts discussed in the following.
Data, preprocessing, and anomaly calculation
For the performance assessment of the individual signals and the machine-learning models, we use an updated international anomaly data sample comparable to the dataset in Jacobs and Müller (2018), which includes 240 distinct anomalies taken from Green et al. (2017); McLean and Pontiff (2016); Hou et al. (2015), and Harvey et al. (2016). Our dataset rests on three Thomson Reuters databases: Datastream supplies stock returns and other stock-related figures (e.g., unadjusted prices), Worldscope is the data source for accounting figures, and IBES provides analyst data, including recommendations and earnings forecasts.
Our sample period ranges from July 1980, which marks the first year with the availability of accounting data, to June 2019. We download stock data for all countries which belong to one of the major MSCI regional indices as of June 2019 (i.e., MSCI North America, Europe, Pacific, Emerging Markets, or Frontier Markets). By relying on the MSCI classification, we ensure that our sample includes only countries with economically important and sufficiently liquid equity markets. At the same time, the selected countries are still very heterogeneous in terms of their size and financial market development, providing us with a representative sample of global equity markets.
We implement several supplementary filters in Datastream to ensure that our dataset exclusively comprises common equity. Specifically, (i) we select only the primary share class when multiple securities exist for a company (Schmidt et al. 2019), (ii) we ensure the security-type equity (Ince and Porter 2006), (iii) we acquire solely the principal quotations for a security in instances of multiple exchange listings (Fong et al. 2017), and (iv) we include only stocks that Datastream links to one of the countries in our study (Ince and Porter 2006). Lastly, (v) to further eliminate non-common equity securities from our sample, we require all stocks to possess a non-missing Worldscope identifier.
These filtering steps result in a final sample of 9.39 million stock-month observations from more than 66,000 different firms across 68 different countries. Table 1 presents summary statistics at the country level. Around 80% of the total stock sample is from non-US stock markets, which also account for approximately 65% of the average total stock market capitalization. On average, 20,071 stocks are included in our dataset per month in a given year. The number is increasing over time, partly because stock data is not available for all countries at the beginning of our sample period. Table 1 also shows the starting dates per country.
We calculate monthly stock returns in US-Dollar using Datastream’s total return index (code: RI), which includes dividends. Because there are few outliers in the return data, we winsorize returns at the 0.1% and 99.9% level, respectively. Further, we use the methodology of Ince and Porter (2006) to include delisted stocks in our analysis only up to the point of their actual delisting. To calculate the 240 cross-sectional return predictors for our sample, we follow the instructions provided in the original paper of Jacobs and Müller (2018). We list all anomalies together with their reference study in Table A.2 of the Internet appendix. For more details on the gathering, filtering, and calculation process of the anomalies, we refer to Jacobs and Müller (2018).
Due to missing values, we are left on average with 201 out of 240 anomalies for each stock-month observation. Furthermore, we categorize the anomaly set into 113 anomalies based on fundamentals, 75 market-based signals, 18 analyst-based anomalies, 19 valuation-based signals, and 15 other signals. The number of anomalies is comparable to other anomaly studies within current literature, such as Hou et al. (2015) assessing 447 anomalies, Harvey et al. (2016) analyzing 315 anomalies, Azevedo and Hoegner (2023) calculating with 299 signals, McLean and Pontiff (2016) analyzing 97 signals, and Green et al. (2017) evaluating 94 anomalies.
Finally, we use percent-ranked signal values instead of raw signal values as this preprocessing scaling procedure provides an effective and simple solution to deal with outliers and data errors and, therefore, might increase the performance of the linear baseline factor and the nonlinear machine-learning models. Like Jacobs (2016), we first rank stocks as underpriced and overpriced according to each predictor. Ranks are standardized in intervals from (0,1) in each country-month observation. Among the advantages of this procedure, it allows us to fill in missing values with a median of 0.5 without any forward-looking bias.
Portfolio-sort strategy and baseline factor construction
We test our signals with a portfolio-sort strategy for each month-anomaly by assessing statistical significance and performance in terms of signal profitability. Following the approach of Chen and Zimmermann (2022), we assign stocks with the best (worst) performing signals within each country into long (short) positions. We then create a decile (10) minus decile (1) long-short portfolio with a monthly return defined as the spread of these long-short positions.
In order to ensure performance comparability, we use a standardized portfolio-sort methodology with no further stock filtering like minimum price filtering, excluding micro-cap stocks, or adapting to different rebalancing and holding periods. Additionally, a standardized approach diminishes the risk of a limited selection of filters or parameters to boost research results (i.e., p-hacking).
We calculate equally-weighted and value-weighted long-short portfolios with a standardized signal calculation approach. However, according to the bad model problem stated in Fama (1998), an equally-weighted analysis suffers from the potential overweighting of micro-cap stocks, while a value-weighted portfolio is more influenced by stocks with a large market capitalization. Therefore, we focus on the analysis of value-weighted portfolios for our machine-learning models, which offer an intuitive interpretation of results and a foundation for potential investment decisions.
We simultaneously report the number of stock holdings in the long and short legs of the portfolios. In the context of these long and short positions, we determine the one-sided turnover rate defined as the relative amount of shares required for the monthly rebalancing of the portfolio. We utilize this one-sided turnover rate in section “Turnover rate and acceptable transaction costs estimation” to calculate round-trip costs.
Similar to the computation of individual signals, we combine our available set of anomalies into a linear baseline factor assessing it on the same criteria. For the linear combination, we build an arithmetic average of our 240 percent-ranked anomalies for each stock-month observation by each country. We include only stock-month observations with at least 100 distinct signals to ensure the diverse foundation of our baseline factor. This baseline factor serves as a benchmark for our machine-learning models in section "Portfolio construction with machine learning algorithms in a static window".
Sample split and cross-validation of machine-learning models
As a typical prerequisite for any supervised machine-learning model, we divide our data sample into a training sample comprising the signal data from July 1980 to June 2003 and a test sample in the following periods. To increase the robustness of our training sample, we implement a threefold cross-validation.Footnote 3 After training and testing our machine-learning models, we determine model performance with a long-short portfolio-sort strategy. In general, we monitor our machine-learning models to predict the next month’s returns of stocks based on the described training sample. We then use these predictions as a decision factor for our classification in long-short portfolios. The following subsections briefly summarize the machine-learning algorithms and the applied training, validation, and test mechanisms.
Machine-learning algorithms
In recent years, there has been a growing interest in finance-related machine-learning issues. Various machine-learning models have been tested with the result that tree-based models and neural networks seem to be among the most promising algorithms in finance (Gu et al. 2020). Following recent literature, we, therefore, investigate the performance of the two tree-based models GBM and DRF and compare them to a regression-based GLM. For this purpose, we use the widely spread open-source library for machine learning H2O.ai (2020). In addition to these three models, we include two FNN with different architectures and one RNN as further models in our analysis. To deploy these three neural networks, we apply the Tensorflow (2020) framework from Google DeepMind. In the following, we briefly specify the applied algorithms. We refer to the original documentation and source code for a more comprehensive description of all six machine-learning algorithms.
Nelder and Wedderburn (1972) were among the first to establish GLM as a flexible generalization of multiple regression types, including linear regression, logistic regression, and Poisson regression. GLM can be modified with different distributions and link functions. For our GLM, we apply the default identity link combined with a normal distribution for both percent-ranked and raw-returns target values. In contrast to GLM, GBM and DRF are tree-based machine-learning techniques (Hastie et al. 2009). Based on the algorithm developed by Breiman (2001), the bootstrap aggregation, called bagging (Breiman 1996), is used for the DRF. It involves randomly selecting data points for multiple decision trees and combining them by averaging all decision trees to enhance the robustness and accuracy of the machine-learning model. The GBM algorithm is based on other weak prediction models called learners, such as a decision tree. Based on these weak learners, the GBM algorithm builds multiple decision trees, weighting the predictive power of individual learners according to their performance and reducing the amount of misclassified data by using the multiple learner approach (Zhou 2012). Our GBM follows the implementation of Hastie et al. (2009) and the H2O.ai (2020) library documentation.
In addition to the three standard machine-learning models described, we also investigate the performance of neural networks. It is important to note that neural networks differ distinctly from tree-based or regression-based models. In contrast, these neural networks are constructed from a series of neuron layers that aim to simulate the mechanism of the human brain. Among various neural network algorithms developed since the 1950s, we concentrate on three distinct neural network models. Two models are based on the classical architecture of a FNN. The two models differ in the width of the neuron architecture. The smaller structure consists of five hidden layers with a decreasing number of neurons while graphically resembling a tunnel. The broader structure has three hidden layers and a more significant number of neurons per layer. The third assessed neural network model is the RNN. Previous work has shown that the RNN is particularly suitable for analyzing data along a time period, as these models build up a type of short-term memory to increase performance. This approach might be particularly advantageous for predicting future stock returns.
Performance evaluation of individual anomalies and the baseline factor
Performance evaluation of individual anomalies
By analyzing equally-weighted long-short portfolios based on 240 individual anomalies in our international out-of-sample data, we find an average return of 0.35% per month with a t-statistic of 3.10. At the minimum t-statistic hurdle rate of 1.96, 167 signals show significant returns accounting for 70% of total available anomalies. With an increased minimum absolute t-statistic of 3.00, we still list 132 significant signals throughout our international sample, representing 55% of all assessed signals.
Not surprisingly, the number of significant anomalies decreases for value-weighted portfolios because stocks with a larger market capitalization have a greater performance influence in this case. In exchange, the considerable influence of micro-cap stocks is reduced. Our analysis shows an average monthly return of 0.25% with a mean t-statistic of 1.47. 41% (20%) of all signals, namely 98 (49) signals, surpass the minimum t-statistic hurdle of 1.96 (3.00). Table A.2 in the Internet appendix presents the value-weighted returns for each anomaly.
Baseline factor as linear multi-anomaly combination benchmark
Relying on these 240 individual anomalies, we calculate the baseline factor based on percent-ranked values of all single anomalies at a stock level for each month. Previous studies find that by combining anomalies, additional profit opportunities might arise, or hidden structures might be discovered (e.g., Stambaugh et al. 2015; Green et al. 2017). Moreover, with this procedure, we alleviate the data dredging concerns associated with individual anomalies and, thus, strengthen the robustness of our anomaly research.
For our main analysis, we use a more restrictive and reliable setup with mid-2003 as a breaking point for our baseline factor analysis. In previous meta-studies, for instance, in Green et al. (2017) and Jacobs and Müller (2018), the year 2003 stands for an essential breaking point in the performance of signals. In 2003, the auditing and reporting quality in the USA significantly increased due to the ratification of the Sarbanes-Oxley Act and the new SEC filing changed (Green et al. 2017). Additionally, following the strategy of increased global standardization of reporting, the European Union accepted in 2002 the International Financial Reporting Standards as the new mandatory reporting standards for listed EU companies starting in 2005. Due to these meaningful adaptations of reporting standards, the stock data quality has arguably increased. In addition, the number of newly published anomalies has substantially risen since 2003. As McLean and Pontiff (2016) first reported, the performance of signals in terms of return becomes significantly lower after the publication of the hidden patterns. Our out-of-sample data mostly consist of anomalies found in the 2000s, largely comparable to the data sample in Azevedo and Hoegner (2023), in which 2003 marks the mean publication year of 299 individual assessed anomalies. Therefore, we initially take July 2003 as a breaking point for our baseline factor analysis and the creation of our training and testing set required by our machine-learning models in section "Portfolio construction with machine learning algorithms in a static window".
Comparing the full sample period from August 1980 to June 2019 and the period starting in August 2003 of an equally-weighted baseline factor shows similar average monthly returns and mean t-statistics. As can be seen in Table 2, the mean long-short return of the baseline factor increases from 2.01 to 2.20% with a stock data sample starting in August 2003, while the t-statistic decreases from 13.25 to 12.79. In contrast to the mean of the 240 single anomalies, the minimum t-statistic hurdle rate of 3.0 is surpassed by far for both time frames.
In contrast to the equally-weighted returns, we do not find an increase in average monthly returns with stock data from 2003 onwards in the case of a value-weighted baseline factor (1.36% vs. 1.02%). Focusing on the significance level of our value-weighted baseline factor, we also see a clear surpass of the minimum hurdle rate for new factors. Additionally, we report a comparable decline of the mean t-statistics between the two-time frames [7.48 vs. 4.93] in line with McLean and Pontiff (2016) and Azevedo and Hoegner (2023).
We observe a higher (two-sided) turnover rate for the baseline factor than for the average of our individual signals. Since the baseline factor composes the entire set of 240 anomalies, it is affected by several monthly stock ranking changes, resulting in more volatile long-short portfolios associated with higher turnover rates. We review these findings and quantify the impact on the performance of our models in section "Comparison and robustness tests of machine learning models", as higher turnover rates likely lead to higher transaction costs, which reduce the profitability for practitioners implementing our potential investment strategies.
To summarize our performance analysis, we report significant returns for our baseline factor, outperforming most of the individual signals in both equally-weighted and value-weighted portfolios. For our nonlinear machine-learning models in the subsequent chapters, we thus use the value-weighted baseline factor with a post-July 2003 sample as a linear benchmark. This benchmark generates a mean monthly return of 1.02% [t-statistic of 4.93], restricting ourselves to a more conservative approach.
Portfolio construction with machine-learning algorithms in a static window
Machine-learning algorithms in a static window and the cross section of stock returns
After creating a linear benchmark with a significant outperforming return of the baseline factor, we explore nonlinear relationships among signals in the following chapter. We train regression-based models, tree-based approaches, and neural networks to detect hidden structures in our anomaly sample and try to exploit them profitably.
For the design of our regression and tree-based machine-learning models, given that performance-based optimization of parameters (called hyperparameter tuning) is more likely exposed to the risks of data dredging, we focus conservatively on the default H2O parameters. For our tree-based models DRF and GBM, apart from the choice of parameters, the depth definition of the tree structure influences the model performance. As recommended by Probst and Boulesteix (2017), we set up our models with 100 trees per model to achieve high performance while compensating for generalization requirements and computational limitations. For more details on these algorithms, we refer to section "Machine learning algorithms" and the H2O.ai (2020) documentation.
Besides regression and tree-based machine-learning models, artificial neural networks have become the most popular algorithms in many areas in recent years. We, therefore, expand our set of machine-learning models with three neural networks. Our first two approaches are FNN with different configurations. In general, any FNN consists of a variable number of hidden layers and neurons which are individually and directly linked. Our smaller FNN is constructed with 99,021 parameters distributed among five hidden layers with a decreasing number of neurons per layer (200, 150, 100, 50, and 10 neurons per layer). The larger FNN has a structure with 251,759 parameters distributed among three hidden layers with a constant number of 299 neurons. Inspired by previous successful meta-studies on time series, we finally enlarge our research with a RNN. As explained by Abiodun et al. (2018), RNN can enhance performance by a type of short-term memory. To implement this short-term memory, we include in each model prediction twelve so-called time steps consisting of last year’s observations of all 240 anomalies.
Moreover, to hold potentially common RNN backpropagated errors constantly, we upgrade our memory to a long short-term memory (LSTM) by building a long-term memory cell (Hochreiter and Schmidhuber 1997). In total, 240,449 parameters form the architecture of our RNN.
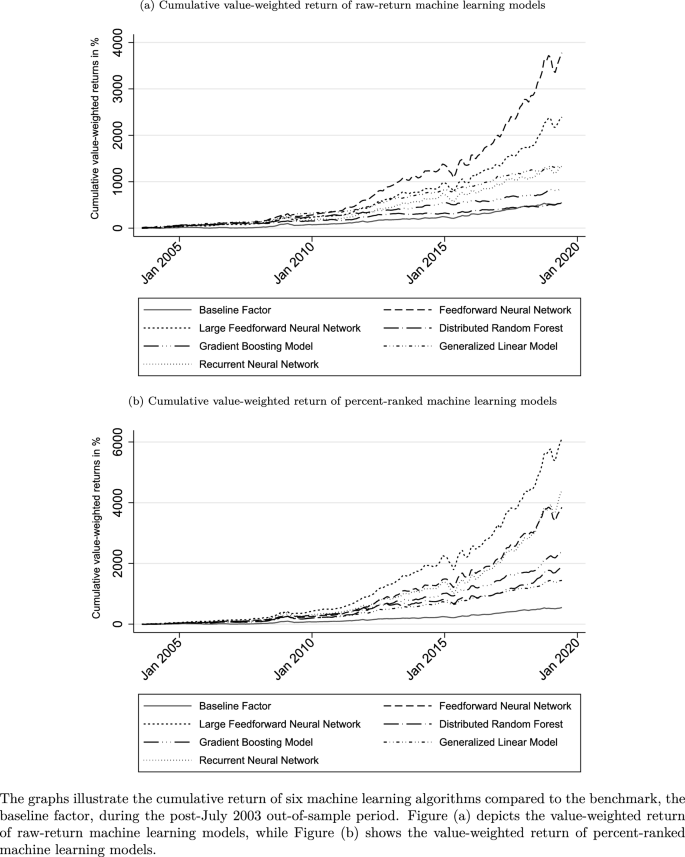
Cumulative returns of six machine-learning algorithms and the baseline factor
We use two variants of target values (dependent variables) to train the models. First, we train our models based on the raw next-month stock returns (\(r_{t+1, i}\)) (i.e., \(f(anomalies_{t, i}) \rightarrow r_{t+1, i}\)). The second analysis variant is based on a training method with percent-ranked next-month stock returns (\(rp_{t+1, i}\)) (i.e., \({f(anomalies_{t, i}) \rightarrow rp_{t+1, i}}\)). This percent-ranking is conducted separately for every country-month. It places the returns in a data range from 0 to 1 with the advantage of having the same scaled pattern of target values as the signal values. This practice allows us to predict only the relative stock performance and distribution instead of the actual return of each stock with our portfolio-sort strategy. We expect both variants with different target values to generate a similar outcome regarding portfolio returns. Nevertheless, percent-rank returns might increase the accuracy of our predictions by being less prone to outliers.
Figure 1a shows that except for the DRF model, all other models trained with raw returns as a target clearly outperform the linear baseline factor in terms of the cumulative value-weighted return. Specifically, we find that all three neural networks exceed the performance of the regression and tree-based machine-learning models in the value-weighted setting. The best-performing model is the small FNN with a highly significant average monthly return of 1.99% for the post-July 2003 period, followed by the large FNN (1.75% average monthly return) and RNN (1.47%). Comparing the Sharpe ratios of our models in Panel A of Table 3, we detect the highest Sharpe ratio of 2.18 with our small FNN benchmarked against the baseline factor with a Sharpe ratio of 1.25. In the case of the regression and tree-based machine-learning models, the GLM performs best with an average monthly return of 1.43% (post-July 2003 period).Footnote 4
Compared to the raw-return variant, we see similar observations for the percent-ranked return specification. As illustrated in Fig. 1b, the three neural networks are among the three best-performing machine-learning models in terms of cumulative value-weighted return. More specifically, the large FNN returns a higher cumulative value in the post-July 2003 period than the RNN and the smaller FNN, with 2.24%, 2.10%, and 2.00% of average monthly returns, respectively. As we can see in Panel B of Table 3, the largest Sharpe ratio is 2.48 for the large FNN. Focusing on the regression and tree-based machine-learning models, we find that the GLM, with a less complex model architecture, marks the weakest machine model performance in the specification with percent-rank returns. With 1.49% of average monthly returns, it still surpasses the linear benchmark with a 1.02% monthly return on average. The best non-neural-network model is the GBM showing 1.75% of average monthly returns in the post-July 2003 period and a Sharpe ratio of 1.81. The minimum significance hurdle rate of new factors is surpassed by all models, with t-statistics between 5.63 and 8.99.
To sum up, different nonlinear machine-learning models beat the linear baseline factor benchmark. Neural networks outperform other regression and tree-based machine-learning models. Furthermore, the minimum t-statistic hurdle rate of 3.00, recommended by Harvey et al. (2016), is easily surpassed by all machine-learning models.
Interpretation of the machine-learning models through relative feature importance
As the previous section described, nonlinear machine-learning models show significant performance. Related work investigates mostly the performance of single anomalies, and linear relationships among these signals. In contrast, our nonlinear machine-learning models have a larger complexity in size and the ability to observe hidden nonlinear relationships. As an illustration, we can consider the number of parameters of our small FNN, which already includes 99,021 parameters. With this larger complexity comes increased difficulty in interpreting the model results. In the literature, this issue is described as the black-box problem of Artificial Intelligence (AI) (Zednik 2021).
In order to address the black-box problem of machine learning, various approaches have been put forward. One possibility is the interpretation of the relative importance of features. As explained in the H2O.ai library documentation, the relative importance of tree-based models, like GBM, is defined as the improvement of the squared error due to the selection of this variable in the tree-building process. Likewise, the relative importance of regression-based models, such as GLM, is determined by the coefficient magnitudes. For our neural networks, we apply the permutation approach described by Breiman (2001) to compare the distribution of relative variable importance by our three reference models (raw-return GLM, percent-ranked GBM, and large percent-ranked FNN). However, it is important to note that feature importance is computed differently for each model and, therefore, the comparability between the relative importance across our models is limited. Nonetheless, it provides an informative indication of the importance of our individual signals.
First, we analyze the variables with the highest feature importance. The highest emphasis within the GBM is placed on the trendfactor with a relative importance of 10.5%. This signal can be found among the five best-performing signals in relative importance for all three reference models. The same finding of the trendfactor as a meaningful predictor is made by Jacobs and Müller (2018) for an international sample and by Gu et al. (2019) for the US market. In the case of the GLM and FNN, the most important anomaly is the trading volume over market value by Haugen and Baker (1996). Remarkably, for this signal, the relative importance in the case of FNN is 26.7%, which is more than twice as high as the second most important signal (trendfactor with 10.5%), which presumably makes this model less robust. In general, we see three (two) similarities between the most important signals for the FNN compared to the GLM (GBM). As an important common signal between the GLM and GBM, we only observe the trendfactor anomaly. An overview of the five most important signals for each reference model is shown in Fig. 2.

Top five feature importance for machine-learning models
In order to further understand the importance of the anomalies in the machine-learning models, we take a holistic view of the weighting of categorized anomalies within the reference models shown in Fig. A.2 in the Internet appendix. We find that the category with the highest weight across all three machine-learning models is market-based anomalies. However, for our reference baseline factor, fundamental-based signals have the highest weight. This finding is consistent with Jacobs and Müller (2020), showing that accounting signals are less profitable in the global market. Hence, the larger emphasis on market-based signals instead of fundamental-based anomalies might at least partly explain the outperformance of our reference models over our baseline factor as a linear multi-signal combination.
Overall, when analyzing the relative importance methods, we can identify different anomaly weights of our three reference models and, thus, better explain and interpret our models. Here, we investigate significant differences in the weighting and the degree of the weighting of individual signals. Nevertheless, the black-box problem of machine-learning models remains a challenge not only for our models. Current research is increasingly focusing on this topic to strengthen the dissemination and acceptance of machine learning in all application areas (Rudin 2019). For the following analysis, we examine typical preprocessing and training approaches to enhance performance and increase research robustness.
Comparison and robustness tests of machine-learning models
Variations of machine-learning models
Extending machine-learning models with dynamic and rolling training methodologies
In our analysis presented in section "Portfolio construction with machine learning algorithms in a static window", the machine-learning models are based on a static window from July 1980 to June 2003. New information from later stock data is not incorporated into the machine-learning models. This approach has the advantage of being less susceptible to false-positive observations, as the number of trained models is kept low. Furthermore, this approach corresponds to a conservative approach that concentrates on stationary patterns within our data sample.
However, more recent stock data can improve the performance of our models if the predictive power of signals varies over time. For this purpose, we retrain our models on a rolling basis, including new observations over time in our training sample while preventing any forward-looking bias. In particular, we apply three separate rolling window mechanisms: a 5-year rolling window, a 10-year rolling window, and an extending rolling window that always includes all stock data from 1980 onwards. Due to limitations in computational power, the machine-learning models are trained yearly, although the dataset could generally also be updated monthly.
Employment of unsupervised learning and feature reduction techniques to preprocess the high-dimensional factor zoo
There are several preprocessing steps for machine-learning models, such as feature reduction methods, to cope with the high-dimensionality of given datasets (Ye et al. 2006). We address this preprocessing to reduce noise using two feature reduction methods and two scientific-motivated selection approaches based on the significance level.
Among the most commonly used feature reduction techniques are regularization or shrinkage methodologies. These preprocessing methods are based on regressions where additional constraints are added to the model to prevent the model from overfitting and to achieve a better generalization. One regularization form is the lasso regression, which penalizes weak features to get zero coefficients within a loss function and eliminates no-value-adding signals. In contrast, ridge regression applies a different penalty expression where correlated features tend to get similar coefficients compared to other features, which are spread more equally. A combination of both approaches is the elastic net selection. It simultaneously reduces features by forcing some coefficients to be zero and eliminating correlated features with a similar coefficient. This results in a model that can handle correlated features and select important variables. In our paper, we utilize the elastic net and lasso selection.
Using the elastic net and lasso for feature selection can have some advantages. For example, our study applies a large number of stock return predictor variables, and many of these variables may be redundant or add some noise to the models. By using these feature-reduction techniques, we can reduce the noise of the models and prevent overfitting (i.e., when a model is too complex and fits the training data too closely, leading to poor out-of-sample performance). In addition to these two approaches, we downsize our signal sample to only anomalies with t-statistics above 1.96 and 3.00 (Harvey et al. 2016) targeting only significant signals without any noise of less important anomalies.
Analysis of 40 machine-learning models
Following Azevedo and Hoegner (2023), we estimate the returns for 40 relevant models with variations on the machine-learning algorithms applied, the target values, the training window, and feature reduction methods. Table 4 compares the performance of these methods. We find that the highest monthly return on average of 2.71% (t-statistic of 9.48) is reported by the percent-ranked small FNN with an extending window and a full feature base. Furthermore, we consistently see high t-statistic values and comparable performance across models with different feature reduction methods and rolling windows, which indicate a lower risk of false-positive observations.
Overall, 39 out of 40 implemented machine-learning models report a higher mean monthly value-weighted return for the post-July 2003 period than our baseline factor as a linear benchmark (1.02%). Moreover, for 30 models, the return difference to the baseline factor is positive and statistically significant at the 0.05 level. Here, the small FNN as the best-performing model indicates a performance difference of 1.68% compared to the baseline factor (t-static of 6.87).
Combinations of machine-learning models
To avoid data-dredging concerns, where the models are selected ex-post, we combine these 40 models according to their target values to get an aggregated predictor. Analyzed by Timmermann (2006) and Rasekhschaffe and Jones (2019), forecast combinations might enhance the information level while reducing noise, particularly in the case of relatively uncorrelated forecast biases and various tested model methodologies.
Our set of tested machine-learning models incorporates six algorithms based on two target values, optimized by six distinct feature selection methods, and trained on three rolling windows approaches. Therefore, our set of models has a high degree of diversity, which can be advantageous to achieve greater accuracy and robustness.
To create our machine-learning combinations, we treat our 40 machine-learning models separately based on their target values. In general, there are multiple combinations approaches available derived from the literature, including methodologies based on statistics (such as the Bates and Granger combination method (e.g., Bates and Granger 1969), regressions (e.g., Granger and Ramanathan 1984), eigenvectors (e.g., Hsiao and Wan 2014), as well as more enhanced approaches considering volatility, mean-variance, or idiosyncratic-return adjustments (e.g., Hanauer and Windmüller 2020). While an in-depth application of each mentioned combination methodology would be out of the scope of our paper, we focus on one specific Statistic-based equal-weighted machine-learning combination (STATEW). First, we average all machine-learning models with the same weight for each month. Afterwards, we apply the same portfolio-sort strategy we have already used throughout the paper. As mentioned above, this intuitive combination can be used as a benchmark for more complex combinations for future research.
Inspired by our results in section "Portfolio construction with machine learning algorithms in a static window", we extend our two combination models based on all machine-learning models with the best-performing feature reduction methodologies elastic net selection and lasso regression. With these feature selections, we can make intelligent model choices that might improve our performance.
As shown in Table 5, our six equal-weighted combinations demonstrate promising results, including a significant improvement compared to our linear baseline factor benchmark. On average, the combinations based on percent-ranked target values achieve higher performance with a monthly average return of 2.53% than the combinations based on our raw-return machine-learning models with only 1.93%. In both variants, the feature selection methods improve the performance compared to the full feature case. For the percent-ranked combinations, the lasso selection of 12 out of 27 models slightly outperforms the elastic net selection of 15 models (2.60% compared to 2.53% average monthly return). Here, both selection techniques mainly focus on selecting models based on neural networks with a share between 67% and 75%. In contrast, for the raw-return combinations, the elastic net selection and lasso regression choose the same six features out of the set of 13 raw-return machine-learning models, namely the static GBM, the static large FNN, the static small FNN, the static RNN, and the static and rolling 10-year GLM (all six models are based on a full feature base). Therefore, both machine-learning combinations have a monthly return of 1.97% on average.
In summary, we combine a set of tested machine-learning models separated by raw-return and percent-ranked models into composite predictors. These machine-learning combinations can be classified as diverse predictors based on a relatively uncorrelated input. Our 40 models cover a broad range of used target values, algorithms, feature reduction methods, and training techniques. These characteristics increase the stability and robustness of our models through a higher level of included information and a reduction of noise. We use the elastic net and lasso feature selections to improve the promising performance already shown to achieve additional gains.
Comparison among all machine-learning models
Next, we identify the characteristics and specifications that make machine-learning models successful at predicting stock returns. We assess the effect of changing machine-learning algorithms, window training, target prices, and feature reduction method. We perform regressions of monthly returns on time fixed-effects and dummies for each parameter (e.g., the machine-learning approach, window, forecast variable, and feature reduction). The results are shown in Table 6.
In specification 1, we first analyze the impact of changing the machine-learning algorithm. The intercept (baseline) of 1.40% (t-statistic of 7.53) refers to the performance of the GLM model. When comparing the machine-learning approaches, the FNN model reports a monthly return of 87 basis points higher than the GLM model with a t-stat of 3.30. In comparison, the combination model is around 83 basis points higher with a t-stat of 3.48. These results indicate that nonlinear models and combinations seem to outperform a linear model, such as the GLM model.
In specification 2, we analyze the impact of using a 5-year and 10-year rolling window and extending the window compared to a static window (intercept). While using a 5-year rolling window is not statistically different from a static window, we find that extending and 10-year rolling windows are the best-performing training windows. For instance, extending windows leads to almost 35 basis points higher monthly returns than the static window, which is evidence that using more recent data rather than a static window can improve the predictability power of the models. However, a 5-year rolling window seems to be too short to deal with the high complexity of stock returns.
Concerning the target return, we find in specification 3 that using percent-ranked returns leads to monthly returns around 58 basis points (t-stat of 3.22) higher than raw returns (intercept). These results indicate that using raw returns in the objective function is too noisy, and percent-ranked returns might be an effective alternative to deal with noisy returns. This is a very important finding given that most of the literature on machine learning uses raw returns as a target (e.g., Gu et al. 2020).
In specification 4, we test feature reduction methods. When analyzing the baseline, which is a model with the full feature set (i.e., including all predictors), we find an average monthly return of 1.883%. However, when we use elastic net (lasso), we see a return increase of approximately 0.25% (0.20%) with a t-statistic of 4.16 (3.76) compared to the baseline. These results indicate that these two feature reduction methods are important preprocessing tools to deal with the high dimensionality of global equity markets. In particular, these feature selection methods seem to do a good job at reducing the noise of the models and eliminating redundant predictors. In other words, these results indicate that not all predictors used in our study necessarily add predictability power to our machine-learning models.
Finally, in specification 5, we include all different parameters in the same regression. Overall, the inferences are mostly unchanged, but the magnitudes of the differences are slightly smaller. Furthermore, among the machine-learning approaches, after controlling for all parameters, the combination reports the highest return, with 60 basis points higher return compared to the baseline model with a GLM approach, static window, raw returns, and using the full feature set.
Overall, these results indicate that the right choice of specifications can play a major role in the predictability of the machine-learning model. Compared to the baseline (GLM, static, raw returns, and full feature set), the regression in specification 5 indicates that it is possible to have an increase of up to 156 basis points by applying a combination of machine learning with extending rolling-window, using percent-ranked returns as a target and elastic net as a feature reduction.
Turnover rate and acceptable transaction costs estimation
Thus far, our machine-learning models have been trained to predict the next month’s return for each stock to optimize the return of the portfolio-sort strategy by maximizing the spread of the long-short positions. This strategy does not consider the monthly relative rebalancing amount of shares entered or removed from the portfolio. As each rebalancing execution of a single stock is associated with transaction costs, our current approach does not illustrate the real profitability of possible trading strategies. The real profitability is rather significantly influenced by the relative rebalancing amount, also framed as the one-sided turnover rate. To address this issue, we integrate a measure for potential transaction costs into our assessment in the following.
While single anomaly strategies greatly vary in turnover rates, the relative rebalancing amount by machine-learning models is relatively high, around 50% to 75%. These findings highlight the potential relevance of transaction costs, especially as the machine-learning models with high turnover rates might display a substantially lower return after costs.
Nevertheless, these analyzed turnover rates do not directly reflect the associated transaction costs for a real trading strategy implementation. Therefore, we calculate the round-trip costs to estimate the upper limit of acceptable transaction costs (Grundy and Martin 2001; Barroso and Santa-Clara 2015; Hanauer and Windmüller 2020). Current literature assumes 50 basis points as transaction cost parameter (Lassance and Vrins 2021). This measure enables us to analyze whether enhanced model returns can offset increased transaction costs associated with larger turnover rates. The latter applies a significance level of 5% for a Z-score and is calculated as follows (Hanauer and Windmüller 2020):
where S = Portfolio strategy S, TS= t-statistic of strategy S, μS = Average monthly return of strategy S, TOS = One-sided turnover rate of strategy S.
As shown in Table 7, the set of our top-30 performing machine-learning models compensates with their increased performance for the higher turnover rate. The round-trip costs for all tested machine-learning models range between 1.74 and 3.28%, implying a realistic upper limit for acceptable transaction costs to sustain a profitable trading strategy for our models. Compared to the baseline factor model, the machine-learning models seem to beat the linear benchmark performance in monthly returns and acceptable transaction costs. Simultaneously, we find that long-short strategies based on our six composite predictors remain significant at the 0.05 level with round-trip costs between 284 and 327 basis points, which collectively proves that the outperformance of the models is not explained by transaction costs. From practitioners’ perspective, these results underline the profitability for a real implementation of the training strategies based on the analysis of nonlinear relationships across the factor zoo with our machine-learning models.
Classification of machine-learning returns as a mispricing or risk components of established factor models
In this section, we test the return of our models against classical factor models using linear regressions to determine whether the returns are due to common (risk) components. Throughout the asset pricing theory, there are multiple established factor models. To this end, we regress the long-short portfolio returns resulting from selected machine-learning models against eight distinct factor models: the Carhart (1997) four-factor model, the Capital Asset Pricing Model (CAPM), the behavioral factor model of Daniel et al. (2020) (DHS), the three- and five-factor models of Fama and French (1992) (FF-3 and FF-5), both the Q-factor model and the augmented Q-factor, and the mispricing factor model of Stambaugh and Yuan (2017).
Our factor regression tests comprise the following models: a GLM with raw returns and a static window, a large FNN with a percent-ranked target and a static window, a GBM model with a percent-ranked target and a static window, and two combinations of models (STATEW). Furthermore, we add a GBM model with a percent-ranked target and rolling window, including only anomalies post-publication. An insignificant alpha value would suggest that machine-learning model returns could be (fully) explained by factor models.
The results in Table 8 show that the three reference models enjoy significant alpha values ranging between 0.87 and 2.43%, with t-statistics firmly above the critical value of 3.0. The post-publication GBM has lower but still statistically significant alphas between 0.60 and 1.95%. More precisely, for the two Q-Factor models and the DHS model, t-statistics of 2.68, 2.85, and 2.38 are reported for the post-publication case as the only three values slightly below three across all tested models. Noteworthy, our STATEW models embody significant alphas ranging between 1.10 and 2.69%. Moreover, we find that models including neural network approaches show more prominent alphas (i.e., the FNN or the STATEWs).
In summary, we highlight significant alphas across the entire range of different tested machine-learning models. Consequently, the returns of our models are not satisfactorily explainable by common asset pricing models. In addition to our analysis in the previous sections, we underline the improbable cause of data dredging for the discovered outperformance of our models. Therefore, these findings challenge the EMH in the global stock universe. In the past, comparable findings defined as arbitrage possibilities were usually exploited fast after publication by investors seeking profitable trading strategies. In contrast, exploiting the returns of our machine-learning models might be more challenging due to the increased complexity and limited interpretation of these algorithms. This circumstance possibly explains our findings for a static frame with a training set consisting of pre-July 2003 stock information. As the interpretability of machine-learning models increases, the exploitation of these profitable nonlinear relationships might become more achievable by practitioners.
Practical implications and considerations
Our analyses suggest that machine-learning models would have outperformed passive buy-and-hold strategies as well as a linear combination of individual anomalies by a substantial margin during our sample period. Since our calculations are based on value-weighted portfolios, and the long-short outperformance remains intact even after accounting for significant transaction costs, our findings should be of interest to portfolio managers and other investment professionals.
Nevertheless, when implementing such models, we urge practitioners to follow a structured approach, which takes into account the challenges and limitations of these techniques. In our experience, careful data preprocessing, which includes proper handling of outliers and missing values, is extremely important, particularly when working with international data. For example, we propose a percent-ranking of input variables as an effective and simple solution to deal with outliers and data errors. For feature selection, practitioners should take advantage of the fact that there is a large number of academic studies providing a rich ground for identifying potentially relevant predictors. The reliance on other work, which is published and typically also peer-reviewed, to select input variables may also mitigate the risk of overfitting, which is a common problem in machine learning. We have taken additional steps such as cross-validation and forecast combinations to reduce overfitting and data mining risk further, and we encourage practitioners to use similar techniques.
In light of the evolving nature of financial markets, it seems also likely that the relevance of individual stock predictors changes over time. This can be accounted for by regularly updating the list of features and using techniques such as rolling- or extending-window estimation, which work well in our study. Finally, portfolio managers may seek a cost-efficient implementation of machine-learning approaches by limiting portfolio turnover or focusing on stocks with high liquidity.
In addition to these practical considerations essential for the effective deployment of machine-learning models, investment professionals should also examine potential ethical and regulatory concerns associated with using these models. For example, from a regulatory and compliance perspective, the complexity and opacity of machine learning may make it difficult to properly monitor and assess the risks in larger asset portfolios. Feature importance analysis is one solution to address this black box problem of machine learning as shown in section "Interpretation of the machine learning models through relative feature importance". In addition, one may reduce the opacity of the models by continuously monitoring (risk) factor and industry exposures.
Market stability and efficiency can also be impacted if machine learning models are used at a larger scale in the asset management industry. For example, if multiple institutions relied on similar models, they could be exposed to correlated risks, which may lead to market instability during periods of financial stress, similar to the “quant meltdown” experience of hedge funds in August 2007 (Khandani and Lo 2011).
A related concern is that the performance of machine-learning models could be more sensitive to sudden changes in market conditions, potentially leading to elevated crash risk as has been observed for individual anomalies like stock price momentum (Daniel and Moskowitz 2016). However, in our study, we do not find evidence that the performance of the long-short portfolios is dependent on market conditions. In unreported results, we test whether the return of long-short portfolios of machine-learning models are different in periods with above average investor sentiment and CBOE Volatility Index (VIX), or during NBER-dated recessions in the U.S.Footnote 5 In our analysis, none of the variables had a statistically significant impact on portfolio performance.
Conclusion
Our study analyzes the performance of machine-learning models in a global stock universe to predict stock returns. Our tested machine learning models enjoy a significant monthly average value-weighted return of up to 2.71%, illustrating the superiority over the baseline factor. It is worth focusing on our composite machine learning predictors to avoid any forward-looking bias in selecting the best-performing model. These composite predictors demonstrate promising returns of up to 2.60% and underline the impact of nonlinear effects on asset pricing.
Additionally, our study extends the existing anomaly research about machine learning with an international view and strengthens measures against p-hacking, leading to greater study robustness. Furthermore, with different types of algorithms, training approaches, and feature selections, we enlarge the set of tested machine-learning models as the basis of the creation of several composite predictors. Due to these conducted measures, our findings cannot be merely traced back to data dredging. The outperformance of our models is not explained by common factor models, and likely suggests market inefficiencies and mispricing.
Consequently, researchers might focus more closely on nonlinear relationships across anomalies within the factor zoo and investigate individual anomalies and linear connections. Thereby, nonlinear hidden patterns identified by complex machine-learning algorithms might provide further insights into international asset pricing. To enhance robustness, more complex composite predictors of multiple machine-learning models, as well as reinforcement learning algorithms, might be applied by subsequent scholars. Finally, for practitioners, our findings might offer new possibilities for profitable trading strategies supplementary to the mostly exhausted patterns of individual anomalies.
Our study emphasizes the importance of nonlinear relationships within the factor zoo and their impact on international asset pricing. With continued progress in research, enhanced interpretation measures, and greater computational power, smart machine-learning algorithms have the capabilities to broaden our knowledge of asset pricing. In the future, models based on these smart algorithms may announce a new development of improved asset pricing models incorporating nonlinear effects. In the meantime, these hidden patterns might yield arbitrage opportunities for practitioners who can navigate these complexities.
Notes
We refer to anomalies as variables which explain the cross section of stock returns as identified in previous studies. Examples include the traditional (six-months) momentum effect (Jegadeesh and Titman 1993) or market value of equity (Banz 1981). The terms anomalies, predictors, signals, characteristics, and factors are used interchangeably in this paper.
We posted our first draft on April, 23, 2022 at SSRN, while the study of Cakici et al. (2022) was posted about 2 months later on June, 28, 2022 at SSRN.
A threefold cross-validation involves training the model in rotation with two-thirds of the in-sample data (until June 2003). The remaining one-third of the in-sample data is used for validation while performing hyperparameter optimization.
Surprisingly, with an equally-weighted setting, this GLM beats all other models, including the neural networks, with a 5.56% average monthly return. However, we continue to focus on the value-weighted portfolios for the already-mentioned reasons.
The data for investor sentiment was taken from Jeffrey Wurgler’s data library, while the data from VIX was taken from Michael W. McCracken’s data library of macroeconomic variables.
References
Abiodun, O.I., A. Jantan, A.E. Omolara, K.V. Dada, N.A. Mohamed, and H. Arshad. 2018. State-of-the-art in artificial neural network applications: A survey. Heliyon 4 (11): 1–41.
Anand, V., R. Brunner, K. Ikegwu, T. Sougiannis, 2019. Predicting profitability using machine learning. SSRN Electronic Journal, pp. 1–63.
Andrew Karolyi, G. 2016. Home bias, an academic puzzle. Review of Finance 20 (6): 2049–2078.
Azevedo, V., and C. Hoegner. 2023. Enhancing anomalies with machine learning. Review of Quantitative Finance and Accounting 60 (1): 195–230.
Banz, R.W. 1981. The relationship between return and market value of common stocks. Journal of Financial Economics 9 (1): 3–18.
Barroso, P., and P. Santa-Clara. 2015. Momentum has its moments. Journal of Financial Economics 116 (1): 111–120.
Bates, J., C. W. J. Granger, 1969. The combination of forecasts. operations research Quaterly, v. 20. Operations Research Quarterly, 20(4):451–468.
Breiman, L. 1996. Bagging predictors. Machine Learning 24 (2): 123–140.
Breiman, L. 2001. Random forests. Machine Learning 45 (1): 5–32.
Breitung, C. 2023. Automated stock picking using random forests. Journal of Empirical Finance, Forthcoming, pp. 1–51.
Cakici, N., C. Fieberg, D. Metko, A. Zaremba, 2022. Machine learning goes global: Cross-sectional return predictability in international stock markets. SSRN Electronic Journal, pp. 1–59.
Carhart, M.M. 1997. On persistence in mutual fund performance. The Journal of Finance 52 (1): 57–82.
Chen, A. Y., T. Zimmermann, 2022. Open source cross-sectional asset pricing. Critical Finance Review, 11 (2): 207–264.
Chen, L., M. Pelger, J. Zhu, 2023. Deep learning in asset pricing. Management Science, Forthcoming.
Clemen, R.T. 1989. Combining forecasts: A review and annotated bibliography. International Journal of Forecasting 5 (4): 559–583.
Cochrane, J.H. 2011. Presidential address: Discount rates. The Journal of finance 66 (4): 1047–1108.
Daniel, K., D. Hirshleifer, and L. Sun. 2020. Short-and long-horizon behavioral factors. The Review of Financial Studies 33 (4): 1673–1736.
Daniel, K., and T.J. Moskowitz. 2016. Momentum crashes. Journal of Financial Economics 122 (2): 221–247.
Drobetz, W., T. Otto, 2021. Empirical asset pricing via machine learning: Evidence from the European stock market. SSRN Electronic Journal, pp. 1–60.
Fama, E.F. 1998. Market efficiency, long-term returns, and behavioral finance. Chicago: University of Chicago Press.
Fama, E.F., and K.R. French. 1992. The cross-section of expected stock returns. The Journal of Finance 47 (2): 427–465.
Fama, E.F., and K.R. French. 1993. Common risk factors in the returns on stocks and bonds. Journal of Financial Economics 33 (1): 3–56.
Fama, E.F., and K.R. French. 2015. A five-factor asset pricing model. Journal of Financial Economics 116 (1): 1–22.
Fieberg, C., D. Metko, T. Poddig, T. Loy, 2023. Machine learning techniques for cross-sectional equity returns’ prediction. OR Spectrum, pp. 289–323.
Fong, K.Y.L., C.W. Holden, and C.A. Trzcinka. 2017. What are the best liquidity proxies for global research? Review of Finance 21 (4): 1355–1401.
Granger, C.W., and R. Ramanathan. 1984. Improved methods of combining forecasts. Journal of Forecasting 3 (2): 197–204.
Green, J., J.R. Hand, and X.F. Zhang. 2017. The characteristics that provide independent information about average US monthly stock returns. The Review of Financial Studies 30 (12): 4389–4436.
Grundy, B.D., and J.S.M. Martin. 2001. Understanding the nature of the risks and the source of the rewards to momentum investing. The Review of Financial Studies 14 (1): 29–78.
Gu, S., B. Kelly, and D. Xiu. 2020. Empirical asset pricing via machine learning. The Review of Financial Studies 33 (5): 2223–2273.
Gu, S., B.T. Kelly, and D. Xiu. 2019. Autoencoder asset pricing models. Journal of Econometrics 222 (429–450): 19–24.
H2O.ai. 2020. H2O.Ai programming library. https://www.h2o.ai.
Hanauer, M.X., T. Kalsbach. 2022. Machine learning and the cross-section of emerging market stock returns. SSRN Electronic Journal, pp. 1–89.
Hanauer, M.X., S. Windmüller, 2020. Enhanced momentum strategies. SSRN Electronic Journal, pp. 1–65.
Harvey, C.R. 2017. Presidential address: The scientific outlook in financial economics. The Journal of Finance 72 (4): 1399–1440.
Harvey, C.R., and Y. Liu. 2014. Evaluating trading strategies. The Journal of Portfolio Management 40 (5): 108–118.
Harvey, C. R., Y. Liu, 2019. A census of the factor zoo. SSRN Electronic Journal, pp. 1–7.
Harvey, C. R., Y. Liu, and H. Zhu. 2016. ...and the cross-section of expected returns. The Review of Financial Studies, 29(1):5–68.
Hastie, T., R. Tibshirani, and J. Friedman. 2009. Boosting and additive trees. In The Elements of Statistical Learning, pp. 337–387. Springer.
Haugen, R.A., and N.L. Baker. 1996. Commonality in the determinants of expected stock returns. Journal of Financial Economics 41 (3): 401–439.
Hochreiter, S., and J. Schmidhuber. 1997. Long short-term memory. Neural Computation 9 (8): 1735–1780.
Hou, K., C. Xue, and L. Zhang. 2015. Digesting anomalies: An investment approach. Review of Financial Studies, pp. 650–705.
Hsiao, C., and S.K. Wan. 2014. Is there an optimal forecast combination? Journal of Econometrics 178: 294–309.
Ince, O.S., and R.B. Porter. 2006. Individual equity return data from Thomson Datastream: Handle with care! Journal of Financial Research 29 (4): 463–479.
Jacobs, H. 2016. Market maturity and mispricing. Journal of Financial Economics 122 (2): 270–287.
Jacobs, H., and S. Müller. 2018. ... And nothing else matters? On the dimensionality and predictability of International Stock Returns. SSRN Electronic Journal, pp. 1–44.
Jacobs, H., and S. Müller. 2020. Anomalies across the globe: Once public, no longer existent? Journal of Financial Economics 135 (1): 213–230.
Jegadeesh, N., and S. Titman. 1993. Returns to buying winners and selling losers: Implications for stock market efficiency. The Journal of Finance 48 (1): 65–91.
Khandani, A.E., and A.W. Lo. 2011. What happened to the quants in August 2007? Evidence from factors and transactions data. Journal of Financial Markets 14 (1): 1–46.
Lassance, N., and F. Vrins. 2021. Portfolio selection with parsimonious higher comoments estimation. Journal of Banking & Finance 126: 106–115.
Leippold, M., Q. Wang, and W. Zhou. 2022. Machine learning in the Chinese stock market. Journal of Financial Economics, 145(2, Part A):64–82.
Makridakis, S., and M. Hibon. 2000. The M3-competition: Results, conclusions and implications. International Journal of Forecasting 16 (4): 451–476.
McLean, R.D., and J. Pontiff. 2016. Does academic research destroy stock return predictability? The Journal of Finance 71 (1): 5–32.
Nelder, J.A., and R.W. Wedderburn. 1972. Generalized linear models. Journal of the Royal Statistical Society: Series A (General) 135 (3): 370–384.
Probst, P., and A.-L. Boulesteix. 2017. To tune or not to tune the number of trees in random forest. J. Mach. Learn. Res. 18 (1): 6673–6690.
Rasekhschaffe, K.C., and R.C. Jones. 2019. Machine learning for stock selection. Financial Analysts Journal 75 (3): 70–88.
Rudin, C. 2019. Stop explaining black box machine learning models for high stakes decisions and use interpretable models instead. Nature Machine Intelligence 1 (5): 206–215.
Schmidt, P.S., U. von Arx, A. Schrimpf, A.F. Wagner, and A. Ziegler. 2019. Common risk factors in international stock markets. Financial Markets and Portfolio Management 33: 213–241.
Stambaugh, R.F., J. Yu, and Y. Yuan. 2015. Arbitrage asymmetry and the idiosyncratic volatility puzzle. The Journal of Finance 70 (5): 1903–1948.
Stambaugh, R.F., and Y. Yuan. 2017. Mispricing factors. The Review of Financial Studies 30 (4): 1270–1315.
Tensorflow. 2020. TensorFlow. https://www.tensorflow.org/?hl=de.
Timmermann, A. 2006. Forecast combinations. Handbook of Economic Forecasting 1: 135–196.
Tobek, O. and M. Hronec. 2020. Does it pay to follow anomalies research? Machine learning approach with international evidence. Journal of Financial Markets, pp. 1–63.
Ye, J., R. Janardan, Q. Li, and H. Park. 2006. Feature reduction via generalized uncorrelated linear discriminant analysis. IEEE Transactions on Knowledge and Data Engineering 18 (10): 1312–1322.
Zednik, C. 2021. Solving the black box problem: A normative framework for explainable artificial intelligence. Philosophy & Technology 34 (2): 265–288.
Zhou, Z.-H. 2012. Ensemble Methods: Foundations and Algorithms. Chapman and Hall/CRC.
Acknowledgments
We thank Lucas Hahn, Christopher Hoegner, Christoph Riedersberger, and Heiko Jacobs for insightful discussions and helpful comments. None of the authors has conflicts of interest to disclose.
Funding
Open Access funding enabled and organized by Projekt DEAL.
Author information
Authors and Affiliations
Corresponding author
Additional information
Publisher's Note
Springer Nature remains neutral with regard to jurisdictional claims in published maps and institutional affiliations.
Supplementary Information
Below is the link to the electronic supplementary material.
Rights and permissions
Open Access This article is licensed under a Creative Commons Attribution 4.0 International License, which permits use, sharing, adaptation, distribution and reproduction in any medium or format, as long as you give appropriate credit to the original author(s) and the source, provide a link to the Creative Commons licence, and indicate if changes were made. The images or other third party material in this article are included in the article's Creative Commons licence, unless indicated otherwise in a credit line to the material. If material is not included in the article's Creative Commons licence and your intended use is not permitted by statutory regulation or exceeds the permitted use, you will need to obtain permission directly from the copyright holder. To view a copy of this licence, visit http://creativecommons.org/licenses/by/4.0/.
About this article

Cite this article
Azevedo, V., Kaiser, G.S. & Mueller, S. Stock market anomalies and machine learning across the globe. J Asset Manag 24, 419–441 (2023). https://doi.org/10.1057/s41260-023-00318-z
Revised:
Accepted:
Published:
Issue Date:
DOI: https://doi.org/10.1057/s41260-023-00318-z