
Abstract
Available empirical evidence suggests that skewness preference plays an important role in understanding asset pricing and gambling. This paper establishes a skewness-comparability condition on probability distributions that is necessary and sufficient for any decision-maker's preferences over the distributions to depend on their means, variances, and third moments only. Under the condition, an Expected Utility maximizer's preferences for a larger mean, a smaller variance, and a larger third moment are shown to parallel, respectively, his preferences for a first-degree stochastic dominant improvement, a mean-preserving contraction, and a downside risk decrease and are characterized in terms of the von Neumann-Morgenstern utility function in exactly the same way. By showing that all Bernoulli distributions are mutually skewness comparable, we further show that in the wide range of economic models where these distributions are used individuals’ decisions under risk can be understood as trade-offs between mean, variance, and skewness. Our results on skewness-inducing transformations of random variables can also be applied to analyze the effects of progressive tax reforms on the incentive to make risky investments.
Introduction
Do individual decision-makers, other things being equal, prefer a more positively skewed distribution? There is a substantial and growing body of empirical evidence suggesting that they do. Building on the earlier seminal contributions of Arditti (1967) and Kraus and Litzenberger (1976), Harvey and Siddique (2000),Footnote 1 for example, show in an asset pricing model that systematic skewness is economically important and commands a substantial premium. Studying the data from horse race betting and from state lotteries (in the U.S.), respectively, Golec and Tamarkin (1998) and Garrett and Sobel (1999) find evidence supporting the contention that gamblers are not necessarily risk lovers but skewness lovers.
So far, however, skewness preference has no firm choice theoretic foundation. Skewness has been treated as synonymous with the (unstandardized) third central moment but it is well-known that preference for a larger third moment is in general not consistent with Expected Utility (EU) maximisation unless the utility function is cubic. As a result, in studies of skewness preference to date, either a cubic utility function is assumedFootnote 2 or a cubic Taylor approximation of the EU is taken (i.e., the utility function is approximated by a Taylor series truncated to three terms before taking expectations). The limitations of these approaches are obvious. A truncated Taylor series, for instance, can be a reasonable approximation only for small risks.Footnote 3 Menezes et al. (1980) come closest to establish a formal linkage between skewness preference and EU maximisation by showing that a distribution having more “downside risk” implies, but is not implied by, its (unstandardized) third moment being smaller, and that downside risk aversion is characterized by a von Neumann-Morgenstern (VNM) utility function with a positive third derivative.
In the statistics literature, Van Zwet (1964) defines a distribution F to be more positively skewed than G if R(x)≡F−1(G(x)) is convex and it has become widely accepted that a good skewness measure should preserve the skewness ordering so defined (see, for example, Oja (1981) and Arnold and Groeneveld (1995)). Oja (1981) proposes a condition in terms of the number of crossings of two standardized distribution functions that relaxes Van Zwet's (1964) skewness-comparability condition. The preferences of EU maximizing decision-makers over skewness-comparable distributions as defined by these authors, on the other hand, have not been explored and characterized.
This paper establishes a skewness-comparability condition on probability distributions that is necessary and sufficient for any decision-maker's preferences over the distributions to depend on their means, variances, and third moments only. Under the condition, a EU maximizer's preferences for a larger mean, smaller variance, and a larger third moment are shown to parallel, respectively, his preferences for a first-degree stochastic dominant (FSD) improvement, a mean-preserving contraction (MPC), and a downside risk decrease and are characterized in terms of the VNM utility function in exactly the same way. The condition generalizes not just the skewness-comparability conditions proposed by Van Zwet (1964) and Oja (1981) but also the condition for two distributions to be comparable in terms of downside risk defined by Menezes et al. (1980). Furthermore, distributions satisfying the “location-scale” or “linear class” condition of Meyer (1987) and Sinn (1983), which they show to be sufficient for the consistency between the mean-variance analysis and EU maximisation, are shown to be skewness-comparable distributions with identical standardized third moments. By showing that all Bernoulli distributions are mutually skewness comparable, we further show that in the wide range of economic models where these distributions are used individuals’ decisions under risk can be understood as trade-offs between mean, variance, and skewness. Our basic characterizations also immediately imply that a concave transformation of a random variable reduces the skewness of the distribution and hence, other things being equal, the attractiveness of the distribution to a skewness-preferring decision-maker. An application of this general regularity addresses the issue of whether a progressive tax reform reduces the incentive to take risks.
The rest of the paper is organized as follows. Skewness comparability and expected utility maximisation section sets out the basic definitions and main results on skewness comparability. Skewness of the Bernoulli distributions section establishes the skewness comparability of the widely used Bernoulli distributions and examines its implications. Comparison with the existing approach and implications for gambling and tax reforms section concludes with discussions on the comparison with the existing approach to modelling skewness preference, the implications for the decision to gamble, and the effects of progressive tax reforms on risk taking.
Skewness comparability and EU maximisation
Preliminaries and stochastic dominance
Throughout the paper, (cumulative) distribution functions, denoted by F(x),G(x), etc., have the supports of their densities contained in [a, b]. We denote the mean, the variance, and the standardized and the unstandardized third central moments of a distribution F(x) by μ F , σ F 2, m F 3, and m̂ F 3, respectively. That is,

For reasons that will become clear, when the abbreviated term “the third moment” is used in what follows, it refers exclusively to the standardized third central moment, never the unstandardized one. VNM utility functions are denoted by u,v, etc.
For a distribution function F(x), define F(1)(x)=F(x) and

The standard notion of nth-degree stochastic dominance is defined as follows:
Definition 1
-
The change from F(x) to G(x) is an nth-degree stochastic dominant improvement (deterioration) if [G(n)(x)−F(n)(x)]⩽(⩾)0 for all x∈[a, b], where the inequality is strict for some subinterval (s), and [G(k)(b)−F(k)(b)]⩽(⩾)0 for k=2, … n−1.
We will henceforth use [F(x) → G(x)] as a shorthand for the change of distributions from F(x) to G(x). It is well-known that ∫ a bu(y)d[G(y)−F(y)]>0 for all u(x) such that u′(x)>0 for all x if and only if [F(x) → G(x)] is a FSD improvement. The related notions of a mean-preserving spread (contraction) and a downside risk increase (decrease) can be defined as special cases of stochastic dominant deterioration (improvement).
Definition 2
-
(i) A second-degree stochastic dominant deterioration (improvement) is a mean-preserving spread (contraction) [MPS (MPC)] if [G(2)(b)−F(2)(b)]=0.
(ii) A third-degree stochastic dominant deterioration (improvement) is a downside risk increase (decrease) if [G(2)(b)−F(2)(b)]=0 and [G(3)(b)−F(3)(b)]=0.
The definitions of an MPS and a downside risk increase here are, of course, equivalent to those in Rothschild and Stiglitz (1970) and Menezes et al. (1980), respectively. Menezes et al. (1980) show that ∫ a bu(y)d[G(y)−F(y)]<0 for all u(x) such that u′′′(x)>0 for all x if and only if [F(x) → G(x)] is a downside risk increase. They further show the following:
Lemma 1
-
(Menezes et al.) [G(x) → F(x)] being a downside risk increase implies, but is not implied by, m F 3<m G 3.
The better known result of Rothschild and Stiglitz (1970) on the other hand establishes that ∫ a bu(y)d[G(y)−F(y)]<0 for all u(x) such that u′′(x)<0 for all x if and only if [F(x) → G(x)] is an MPS.
Skewness comparability
Van Zwet (1964, p. 9) argues that since intuitively “convex transformation of a random variable effects a contraction of the lower part of the scale of measurement and an extension of the upper part”, a distribution F can be defined to be more skewed to the right than G if R(x)≡F−1(G(x)) is convex.Footnote 4 It has since become widely accepted that a good skewness measure should preserve the skewness ordering so defined (see, for example, Oja (1981) and Arnold and Groeneveld (1995)). Following Oja (1981), we define strong skewness comparability as follows:
Definition 3
-
(i) Distributions F and G are strongly skewness comparable if F−1(G(x)) is convex or concave.
(ii) F is more skewed to the right than G in the sense of Van Zwet if F−1(G(x)) is convex.
The condition for skewness comparability is however too strong and may not be strictly satisfied in many typical cases where one distribution is considered more skewed than another such as distributions F and G and their respective density functions f and g illustrated in Figures 1 and 2. We observe in Figures 1 and 2 that if two distributions have the same mean and, loosely speaking, the same “spread” as depicted, then one distribution being more skewed to the right typically implies the two distribution functions cross twice. However, in cases such as depicted, F−1 may or may not be an exact convex transformation of G−1 as is required by Van Zwet's definition. Noting that if F(x) is the distribution function for a random variable x̃, then F(σ F x+μ F ) is the distribution for the standardized random variable (x̃−μ F )/σ F , we state Oja's (1981) weaker comparability condition as follows:
Definition 4
-
(i) Distribution s F and G are skewness comparable in the sense of Oja if G(σ G x+μ G ) crosses F(σ F x+μ F ) exactly twice or F(σ F x+μ F )=G(σ G x+μ G ).
(ii) F is more skewed to the right than G in the sense of Oja if G(σ G x+μG) crosses F(σ F x+μ F ) exactly twice first from above.

The density functions f and g.

F(x) and G(x).
The following lemma confirms that this is a weaker notion of skewness comparability and relates it to the concept of increasing downside risk of Menezes et al. (1980).Footnote 5
Lemma 2
-
(i) If F and G are strongly skewness comparable, then they are skewness comparable in the sense of Oja.
(ii) If F is more skewed to the right than G in the sense of Oja, then [F(σ F x+μ F ) → G(σ G x+μ G )] is a downside risk increase.
In view of Lemma 2, we define our notion of “generalized skewness comparability” based on the notion of a downside risk increase and show that this is a necessary and sufficient condition for preferences over two distributions to be determined by their means, variances, and third moments alone. For expositional ease, we henceforth simply use “skewness comparability” to mean “generalized skewness comparability”.
Definition 5
-
(i) Distributions F and G are (generalized) skewness comparable if [F(σ F x+μ F ) → G(σ G x+μ G )] is a downside risk increase or a downside risk decrease or F(σ F x+μ F )=G(σ G x+μ G ).
(ii) F is more skewed to the right than G if [F(σ F x+μ F ) → G(σ G x+μ G )] is a downside risk increase.Footnote 6
Theorem 1
-
μ F =μ G , σ F 2=σ G 2, and m F 3=m G 3 imply F(x)=G(x) if and only if F and G are skewness comparable.
The result clearly shows that any decision-maker's preferences over skewness-comparable distributions are determined by the first three moments of the distributions. We, however, restrict our attention to EU theory because it remains the only widely used decision model known to be consistent with downside risk aversion.Footnote 7 The result implies, in particular, that for skewness-comparable changes in a distribution F, U(μ F ,σ F 2,m F 3)≡∫ a bu(x)dF(x) is a well-defined function from R × R+ × R to R. We next show that for skewness-comparable distributions, an EU maximizer's preferences for a larger mean, a smaller variance, and a larger third moment parallel, respectively, his preferences for a FSD improvement, an MPC, and a downside risk decrease and are characterized in terms of the VNM utility function in exactly the same way.
Theorem 2
-
(i) Supposing μ F =μ G and σ F 2=σ G 2, then m F 3>m G 3 implies ∫ a bu(x)dF(x)>∫ a bu(x)dG(x) for any two skewness-comparable distributions F and G if and only if u′′′(x)>0 for all x.
(ii) Supposing μ F =μ G and m F 3=m G 3, then σ F 2>σ G 2 implies ∫ a bu(x)dF(x)<∫ a bu(x)dG(x) for any two skewness-comparable distributions F and G if and only if u′′(x)<0 for all x.
(iii) Supposing σ F 2=σ G 2 and m F 3=m G 3, then μ F >μ G implies ∫ a bu(x)dF(x)>∫ a bu(x)dG(x) for any two skewness-comparable distributions F and G if and only if u′(x)>0 for all x.
Or equivalently,
Theorem 2a
-
U(μ F ,σ F 2,m F 3)=∫ a bu(x)dF(x) is increasing in μ F and m F 3 and decreasing in σ F 2 for skewness-comparable changes in any distribution F if and only if u′(x)>0, u′′(x)<0, and u′′′(x)>0 for all x.
With standard results in Rothschild and Stiglitz (1970) and Menezes et al. (1980), the result is implied by the following lemma, which may be of independent interest.
Lemma 3
-
Suppose F and G are (generalized) skewness comparable. Then
(i) m F 3>m G 3 if and only if F is more skewed to the right than G.
(ii) Assuming μ F =μ G and m F 3=m G 3, σ F 2>σ G 2 if and only if [G(x) → F(x)] is an MPS.
(iii) Assuming σ F 2=σ G 2 and m F 3=m G 3, μ F >μ G if and only if [G(x) → F(x)] is an FSD improvement.
For any two skewness-comparable distributions F and G, we can thus have a simple and useful decomposition of the difference in EU as follows.
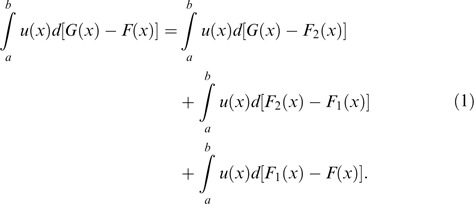
where F1(x)≡F(x+μ
F
−μ
G
) and  . Hence F1 and F differ only by their means, F2 and F1 have the same mean and
  , and [F2(x) → G(x)] is a downside risk increase or decrease or G(x)=F2(x). As will be shown, such a simple decomposition, which depicts trade-offs between mean, variance (or risk), and skewness, is useful in understanding individuals’ choice among skewness-comparable distributions.
Sinn (1983) and Meyer (1987) define that two distributions F and G are in the “linear class” or the “location-scale” model if F(x)=G(βx+α) with β>0 and show that EU maximizers’ preferences over distributions in this model are determined by the means and variances of the distributions only, that is, mean-variance decision models are consistent with EU maximisation. Meyer (1987) further shows that in many important economic models, including Sandmo's (1971) model of competitive firms facing random output price and Tobin's (1958) theory of liquidity preference with a single risky and riskless asset, comparative statics analysis can be reformulated as choice among distributions in this class. Clearly, if F and G are in the “location-scale” model, F(σ F x+μ F )=G(σ G x+μ G ). That is, distributions in the “location-scale” model are skewness comparable ones with identical third moments.
Skewness of the Bernoulli distributions
Skewness comparability of the Bernoulli distributions
Their simple parametric structure notwithstanding, the Bernoulli distributions are applicable to a wide range of economic problems and are used in a wide range of economic models. We show that the answer to the question of skewness comparability for this simple but important family of distributions is very clear-cut. Let [(y, p)(z, 1−p)] denote a Bernoulli distribution that gives y with probability p and z with probability (1−p).
Proposition 1
-
For i=1, 2, let F i (x), μ i and σ i be the cumulative distribution function, the mean and the standard deviation of [(y i , p i )(z i ,1−p i )], respectively, and y i <z i . Then
(i) p1<p2 if and only if F2(x) is more skewed to the right than F1(x).
(ii) p1=p2 if and only if F1(σ1x+μ1)=F2(σ2x+μ2).
The result clearly shows that not only are all Bernoulli distributions skewness comparable but also their degrees of skewness are determined by the parameter p alone.Footnote 8 This gives a novel perspective on individuals’ decisions in the wide range of economic models where the choices available are assumed to be Bernoulli distributions: These decisions can be understood as trade-offs between mean, variance, and skewness. We will illustrate in what follows the usefulness of this perspective in understanding individuals’ betting behaviour and self-protection decisions. The same approach can potentially yield interesting insights in such important models as those of auctions, tournaments, among others. Moreover, the result also shows that if two Bernoulli distributions share the same value for the parameter p, they are not just skewness comparable but also in the “location-scale model” or “linear class” and hence are consistent with mean-variance preferences.
Empirical evidence for Gamblers’ skewness preference
The result that any pair of Bernoulli distributions are skewness comparable indicates that the empirical findings of Golec and Tamarkin (1998) and Garrett and Sobel (1999) do represent evidence for gamblers’ skewness preference as is defined and characterized in this paper. Specifically, a bet on horse h considered by Golec and Tamarkin (1998) (and Ali (1977)) takes the form [(0, 1−p h )(X h ,p h )], where X h denotes the return of a winning bet on horse h and a losing bet returns zero to the bettor, and assuming bettors have identical utility function u( ), their EU betting on horse h is

Assuming that u(0)=0 and u(X H )=1, where H represents the highest-odds horse, and that the amount bet on each horse is such that bettors are indifferent between bets on any horse h, for any h, we have

which gives p H /p h =u(X h ). Racetrack data are then used to estimate the utility function assumed to take the cubic form u(X h )=a+b1X h +b2X h 2+b3X h 3. The estimated coefficients b1 and b3 are positive and b2 negative, all of which are highly significant. The estimated utility function is thus concave for low values of X h and convex for high values. Bettors are therefore not globally risk loving as suggested by earlier studies such as Ali (1977). More importantly, a utility function with u′′′( )>0 estimated using a data set of skewness-comparable distributions with different degrees of skewness does indicate (global) skewness preference as defined in this paper.Footnote 9 Using data from U.S. state lotteries, Garrett and Sobel (1999) follow the exact same methodology by assuming that lottery players completely disregard the prizes of a lottery other than the top prize (i.e., winning anything other than the top prize of a lottery gives zero utility) and hence a choice among state lotteries is effectively a choice among Bernoulli distributions. They obtain identical results in terms of the characteristics of the utility function. That is, to the extent that lottery players do play only to win the top prize, the state lottery data also support global skewness preference.
Self-protection
Ehrlich and Becker (1972) define self-protection to be the expenditure on reducing the probability of suffering a loss and highlight its conceptual distinction from self-insurance, which is the expenditure on reducing the severity of loss.Footnote 10 Denoting the initial wealth by w and the probability of suffering a loss l by p, self-protection is the expenditure on reducing the probability p of the Bernoulli distribution [(w−l, p)(w, 1−p)]. Proposition 1 shows that a reduction in p implies a reduction in (positive) skewness and an EU maximizer's preferences regarding self-protection are completely determined by its effects on the mean, variance, and third moment. Let F and G denote, respectively, the distributions before and after a reduction in p by ɛ, we can explicitly decompose the effect of self-protection as in (1):

where F1(x)≡F(x+μ
F
−μ
G
) and  . This gives a novel and definitive characterization of all the relevant factors determining the choice of self-protection and brings together, and offers straightforward interpretations to, results from recent attempts to relate self-protection to skewness preference (i.e., the third derivative of a VNM utility function).Footnote 11 For example, if the individual pays the fair price ɛl for the reduction in p, then clearly ∫
a
bu(x)d[F1(x)−F(x)]=0. It follows that he is willing to pay more than the fair price for the reduction in loss probability if ∫
a
bu(x)d[G(x)−F2(x)]+∫
a
bu(x)d[F2(x)−F1(x)]>0. More specifically, the change in variance caused by a reduction in p by ɛ is
. This gives a novel and definitive characterization of all the relevant factors determining the choice of self-protection and brings together, and offers straightforward interpretations to, results from recent attempts to relate self-protection to skewness preference (i.e., the third derivative of a VNM utility function).Footnote 11 For example, if the individual pays the fair price ɛl for the reduction in p, then clearly ∫
a
bu(x)d[F1(x)−F(x)]=0. It follows that he is willing to pay more than the fair price for the reduction in loss probability if ∫
a
bu(x)d[G(x)−F2(x)]+∫
a
bu(x)d[F2(x)−F1(x)]>0. More specifically, the change in variance caused by a reduction in p by ɛ is

If p>1/2, a risk-averse skewness-preferring individual will not be willing to pay the fair price for a small reduction in p, that is, for ɛ⩽(2p−1). On the other hand, if p⩽1/2, self-protection reduces both the skewness and variance and consequently ∫ a bu(x)d[G(x)−F2(x)]<0 and ∫ a bu(x)d[F2(x)−F1(x)]>0. Whether a risk-averse skewness-preferring individual is willing to pay more than the fair price for self-protection depends on the strength of his skewness preference relative to his risk aversion, which, as is shown in Chiu (2005a), the prudence measure, −u′′′(x)/u′′(x), can be interpreted as measuring.Footnote 12 The simple decomposition in (1) thus not only offers much more straightforward interpretations for the results in Chiu (2000, 2005b) and Eeckhoudt and Gollier (2005), but also suggests that the problem of self-protection can be analyzed without using the first-order approach, which entails assuming the second-order condition and its implied restrictions on the relationship between the self-protection expenditure and the reduction in the loss probability.Footnote 13
Comparison with the existing approach and implications for gambling and tax reforms
The existing approach to skewness preference
The theoretical justification for considering skewness preference has so far been a Taylor series approximation of the EU. Specifically, letting F be the distribution function for random variable x̃,

Clearly if we have a cubic utility function u(x)=c0+c1x+c2x2+c3x3, the cubic expansion will be precise and the EU given F can be explicitly calculated as

That is, if either the Taylor series represents a good approximation or the utility is cubic, u′′′(x)>0 appears to imply a preference for the unstandardized third central moment m̂ F 3.Footnote 14 On the one hand, our results in the previous section can be seen as confirming that the EU given a distribution can be written as a function of its mean, variance, and unstandardized third moment for mutually skewness-comparable distributions: since we have shown that a function U(μ F ,σ F 2,m F 3)=∫ a bu(x)dF(x) is well defined for skewness-comparable changes in F, for such changes we can define

On the other hand, what (3), (4), and (5) all say is that, assuming u′′′(x)>0, a larger m̂ F 3 implies a larger Eu(x̃) if μ F and σ F 2 are held constant. For two distributions F and G with σ F 2>σ G 2, in particular, m̂ F 3>m̂ G 3 does not imply either that F is more skewed than G or that skewness plays any role in determining their comparative desirability to an individual. This seems to be an insight well-hidden in using the traditional approach, as is exemplified by Tsiang's (1972, p. 363) attempt to explain the Borch (1969) paradox by invoking skewness preference.Footnote 15 Other pitfalls in using the traditional approach can also be seen in Markowitz's (1952a) conjecture on skewness preference and the decision to gamble discussed in what follows.
Skewness preference and the decision to gamble
Skewness preference has been associated with gambling since long before the work of Golec and Tamarkin (1998) and Garrett and Sobel (1999). Markowitz (1952a) suggests that “the third moment of the probability distribution of returns from the portfolio may be connected with a propensity to gamble” and that if individuals’ utility of a probability distribution is a function of the third moment as well as the mean and variance of the distribution, then some fair bets would be accepted.Footnote 16 So is it possible for an individual with a third-moment utility function who is averse to larger variances, as is usually assumed in the context of mean-variance analysis, to accept an independent fair gamble given a sufficiently strong skewness preference? The Taylor approximation in (3) gives the impression that this is possible. To examine the possibility, suppose an individual with initial wealth distribution F is contemplating taking fair gambles that increase the skewness of F in the sense defined in this paper and are independent of F. Then

is well defined. Consider first the case where U(μ F ,σ F 2,m F 3) is decreasing in σ F 2 and increasing in m F 3 for all distribution F. Theorem 2a clearly indicates that U(μ F ,σ F 2,m F 3) being decreasing in σ F 2 for all distribution F is equivalent to risk aversion (i.e., u′′(x)<0 for all x) and since accepting a fair gamble independent of his initial wealth induces a MPS, by the classic result of Rothschild and Stiglitz (1970), it always reduces his EU given his risk aversion whatever the strength of his skewness preference. Alternatively, assume that for all distribution F, Û(μ F ,σ F 2,m̂ F 3) is decreasing in σ F 2 and increasing in m F 3, that is, (assuming differentiability) Û2(μ F ,σ F 2,m̂ F 3)<0 and Û3(μ F ,σ F 2,m̂ F 3)>0. Then since U(μ F ,σ F 2,m F 3)=Û(μ F ,σ F 2,σ F 3m F 3), simple differentiation shows that

Clearly, Û2(μ F ,σ F 2,m F 3)<0 for all distribution F implies U2(μ F ,σ F 2,m F 3)<0 for all distribution F because if U2(μ F ,σ F 2,m F 3)⩾0 for a negatively skewed or symmetrical distribution F, that is, m F 3⩽0, then (given 3(μ F ,σ F 2,m̂ F 3)>0) Û2(μ F ,σ F 2,m F 3)⩾0. In other words, with a third-moment utility function, whether the utility is defined on the standardized or unstandardized third moment, aversion to larger variances implies risk aversion and precludes taking fair gambles whatever the strength of the skewness preference.
The incentive effects of tax reforms
In considering the implications of his pioneering analysis of skewness preference, Tsiang (1972, p. 370) suggests that
the effect of income tax on risk-taking should be examined not only with respect to its impacts on the mean and variance of investment returns after tax, but also with respect to its impacts on the skewness of net returns. A progressive income tax ... could certainly have a greater adverse effect on the willingness to take risk than a proportional tax with perfect loss offset that leave the mean and variance after tax at the same levels.
Does a progressive tax necessarily reduce the skewness of the net returns of a risky investment and hence have a greater adverse effect on the willingness to take risk than a proportional income tax? More generally, since the 1980s, there has been a broad international trend towards the flattening of personal income tax structures. Does such a reform increase the skewness of the after-tax income distribution and as a result, other things being equal, enhance the incentive to make risky investments? Our basic results on skewness preference can be applied to give definitive answers to these questions, under a particular definition of a “more progressive tax” as follows.Footnote 17
Definition 6
-
A tax schedule t1(x) is more residual-concave than another t2(x) if r1(r2−1(τ)) is concave where for i=1, 2, r i (x)≡x−t i (x) is the residual income function under tax schedule t i (x).
That is, a tax schedule t1(x) is more progressive than another t2(x) in the sense of residual concavity if the residual income function [x−t1(x)] is a concave transformation of [x−t2(x)]. Under this definition, any graduated-rate tax is more residual-concave than any proportional tax and a tax schedule becoming less residual-concave more generally defines a particular kind of flattening of the tax schedule. For example, flattening a graduated-rate tax by reducing the top marginal tax rate or by abolishing the income band where the highest marginal tax rate applies leads to a less residual concave tax schedule.Footnote 18 We next show that in most relevant cases in practice, a more residual-concave tax schedule is a more progressive one as is usually defined in the literature on income inequality measurement (see, e.g., Lambert (2001)).
Proposition 2
-
Suppose r1(r2−1(0))⩾0. Then a tax schedule t1(x) has more residual progression than t2(x), that is, [x−t1(x)]/[x−t2(x)] is non-increasing for all x, if t1(x) is more residual-concave than t2(x).
The condition r1(r2−1(0))⩾0, which is equivalent to [x−t2(x)]=0 implying [x−t1(x)]⩾0, is clearly satisfied if we only consider tax schedules involving no lump-sum elements, that is, t i (0)=0, in which case r1(r2−1(0))=0. Typical real-world tax schedules with a personal allowance, that is, an amount subtracted from pre-tax income in arriving at taxable income, are clearly in this category.
Given Definition 6, Lemmas 2 and 3 immediately imply the following.
Proposition 3
-
For a given pre-tax income distribution, let F and G denote the after-tax income distributions under tax schedules t1(x) and t2(x), respectively. If t1(x) is more residual-concave than t2(x), then G is more skewed to the right than F and m G >m F .
For an interpretation of the result, suppose an investor's initial income is non-random and F and G represent the after-tax prospective income distributions given a risky investment under tax schedules t1(x) and t2(x), respectively. The result implies that if t1(x) is more residual-concave than t2(x), we can decompose the effect on the EU of the change of tax schedules from t1 to t2 as in (1)

where F1(x)≡F(x+μ
F
−μ
G
) and  . That is, not only does a tax flattening in the form of the change from t1 to t2 unequivocablly increase the skewness of the prospective income distribution but how it affects the attractiveness of the investment is completely determined by its effect on the mean, variance, and third moment of the after-tax distribution. Furthermore, assuming skewness preference, such a tax reform increases the attractiveness of the investment compared with a “skewness-neutral” tax reform that achieves the same effects on the mean and the variance of the after-tax income distribution. More specifically, noting the relationship between F2(x) and F(x), if a tax schedule t3(x) is such that
  , then t3(x) clearly induces an after-tax income distribution equal to F2(x) (which has the same mean and variance as G(x)) and a tax reform from t1(x) to t2(x) clearly makes the investment more attractive compared with the reform from t1(x) to t3(x). Since any graduated-rate (i.e., convex) tax schedule is more residual-concave than a proportional tax as remarked earlier, a corollary of this is a formal validation of Tsiang's conjecture if a progressive tax is understood to be a graduated-rate tax: Any graduated-rate tax has a greater adverse effect on the attractiveness of a risky investment than a proportional tax with perfect loss offset that leaves the mean and variance after tax at the same levels.Footnote 19
Notes
1 See also the references therein for a sample of other related empirical work.
2 Hanoch and Levy (1970) is an early example of using the cubic utility function in portfolio choice theory.
3 Other pitfalls of these approaches are discussed in the text.
4 Letting F and G be the distribution functions for random variables x̃ and ỹ, respectively, F−1(G(x)) being convex is equivalent to x̃ (or F−1( )) being a convex transformation of ỹ (or G−1( )).
Proofs of all formal results not immediate from existing results are given in the Appendix.
Generalized skewness comparability is more general than Oja's skewness comparability not only in the sense that the former is implied by but does not imply the latter but also that the relation of “more generalized skewed” is transitive while that of “more skewed in the sense of Oja” is not. I am grateful to a referee for pointing this out. It should also be noted that the concept of skewness comparability is distinct from that of third-degree stochastic dominance. Simple examples can be constructed to show that two distributions being skewness comparable neither implies nor is implied by one of the distributions third-degree stochastically dominating the other. This is reinforced by the observation that many of the useful properties of skewness comparability discussed in the sequel are not shared by third-degree stochastic dominance.
Chateauneuf et al. (2002) show that in the widely used Rank-Dependent Expected theory, which generalizes EU theory, downside risk aversion implies EU maximisation.
This immediately shows that Tsiang's (1972) well-cited attempt to explain the Borch (1969) paradox is misguided. More detailed discussion on this is given in the next section.
That is, since individuals’ preferences over these distributions are determined by their means, variances, and degrees of skewness alone, if individuals were averse or indifferent to skewness, the estimates of b3 should have been negative or close to zero.Cain and David (2004) point out that for the class of Bernoulli distributions of the form [(0,1−p h )(X h , p h )] (with one of the possible outcomes fixed at 0), the mean and the variance of a distribution determine its unstandardized and standardized third moments. It is therefore not sensible to claim, as did Golec and Tamarkin (1998), that bettors “trade off negative expected return and variance for positive skewness”. Nevertheless Proposition 1 implies that Bernoulli distributions of this form do have different degrees of skewness as determined by the value of ph. That is, the data sets used in these empirical studies consist of distributions with different means, variances, and degrees of skewness only that there is an implicit restriction on their relationship that leaves only 2 degrees of freedom. A utility function with u′′′( )>0 estimated using such data sets still does represent evidence for skewness preference as defined in this paper.
In particular, unlike self-insurance, self-protection may be attractive to both risk averters and risk lovers, and market insurance and self-protection can be complements. Examples of self-protection includes crime prevention measures such as the purchase of burglary alarms, paying a higher price for a safer car or healthier food or a house in a less crime-prone area, the purchase of fire prevention equipments such as smoke detectors, etc. The problem of self-protection is also embedded in the usual moral hazard models and in models of enviromental protection.
Until recently, the literature on self-protection focuses primarily on the effect of risk aversion. Briys and Schlesinger (1990) first suggest a link between self-protection and downside risk aversion. Chiu (2000) shows that a risk-averse individual is willing to pay more than the fair price for self-protection if the initial loss probability p is below a threshold, which is less than 1/2 if and only if u′′′>0 and is lower if −u′′′/u′′ is larger. Eeckhoudt and Gollier (2005) obtain results suggesting that the spending on self-protection is less if u′′′>0 than if u′′′<0. Chiu (2005b) shows that if marginal changes in self-protection expenditure are mean preserving, a larger −u′′′/u′′ implies a lower spending on self-protection. The precise role played by the change in variance in self-protection decisions has never been recognized.
Chiu (2005a) shows that the prudence measure can be interpreted as measuring the strength of an individual's downside risk aversion relative to his own risk aversion. Since under our definition of skewness comparability, a downside risk increase is a “pure” decrease in skewness where the two distributions have the same mean and variance, the prudence measure can equivalently be said to measure the strength of skewness preference relative to risk aversion.
For example, it may be the case that the initial p is larger than 1/2 and the cost of reducing it by a small amount ɛ is larger than ɛl, and yet for a larger reduction in p (through the purchase of more expensive devices), that is, for ɛ large, the total cost is less than ɛl. Then the decomposition in (1) clearly indicates that it is not optimal to choose a small reduction in p but it may be optimal to choose a large reduction. Such possibilities are ruled out in using the first-order approach which requires that the cost of self-protection is a continuous and differentiable function of the reduction in loss probability and such a function is usually further assumed to be convex to guarantee the second-order condition.
This perhaps explains why the unstandardized third moment has been treated synonymously with skewness in the economics and finance literature though as is pointed out in Arditti's (1967, p. 20) pioneering analysis of skewness preference, the term skewness is usually saved for the standardized third moment in the statistics literature.
Numerous authors have published comments on Tsiang's (1972) paper but none seemed aware of this particular flaw in his argument. See the June 1974 issue of the American Economic Review. Since the two Bernoulli distributions constructed in Borch's (1969) celebrated example share a common probability parameter value, Proposition 1 in the last section indicates that they are consistent with mean-variance preferences. Any attempt to explain the Borch paradox by invoking skewness preference is thus clearly misguided.
In addition, Markowitz (1952b) points out that an individual with the utility function Friedman and Savage (1948) use to explain simultaneous gambling and insurance tends to prefer positively skewed distributions and cites as evidence of positive skewness preference the experimental regularity uncovered by Mosteller and Nogee (1951) that gamblers play more conservatively when losing and more liberally when winning.
I received valuable advice from Peter Lambert on the presentation of concepts and results related to tax progression.
This can be best illustrated considering a tax schedule t2(x), its residual income function and a concave function T(τ) as follows:

Let a tax schedule t1(x) be such that x−t1(x)=T(x−t2(x)). Then the change from t1(x) to t2(x) is equivalent to reducing the top marginal tax rate if r̂x̄ and to abolishing the top rate income band if r̂>x̄. In the United Kingdom, for example, the top marginal tax rate was cut in 1979 and the top rate income band was abolished in 1988.
A completely analogous interpretation can be developed in terms of the impacts of tax reforms on income inequality and on a Social Welfare function or an inequality index, which exhibits “downside inequality aversion” or “transfer sensitivity”. A useful and novel role of the third moment in the analysis of income inequality is also implied. The details are however left to readers well versed in the related literature.

References
Ali, M.M. (1977) ‘Probability and utility estimates for racetrack bettors’, Journal of Political Economy 85 (August): 807–815.
Arditti, F.D. (1967) ‘Risk and the required return on equity’, Journal of Finance 22 (1): 19–36.
Arnold, B.C. and Groeneveld, R.A. (1995) ‘Measuring skewness with respect to the mode’, American Statistician 49 (1): 34–38.
Borch, K. (1969) ‘A note on uncertainty and indifference curves’, Review of Economic Studies 36: 1–4.
Briys, E. and Schlesinger, H. (1990) ‘Risk aversion and the propensities for self-insurance and self-protection’, Southern Economic Journal 57: 458–467.
Cain, M. and David, P. (2004) ‘Utility and the skewness of return in gambling’, Geneva Papers on Risk and Insurance Theory 29: 145–163.
Chateauneuf, A., Gajdos, T. and Wilthien, P.-H. (2002) ‘The principle of strong diminishing transfer’, Journal of Economic Theory 103: 311–332.
Chiu, W.H. (2000) ‘On the propensity to self-protect’, Journal of Risk and Insurance 67: 555–578.
Chiu, W.H. (2005a) ‘Skewness preference, risk aversion, and the precedence relations on stochastic changes’, Management Science 51 (12): 1816–1828.
Chiu, W.H. (2005b) ‘Degree of downside risk aversion and self-protection’, Insurance: Mathematics and Economics 36 (1): 93–101.
Eeckhoudt, L. and Gollier, C. (2005) ‘The impact of prudence on optimal prevention’, Economic Theory 26: 989–994.
Ehrlich, I. and Becker, G. (1972) ‘Market insurance, self-insurance and self-insurance’, Journal of Political Economy 80: 623–648.
Friedman, M. and Savage, L.J. (1948) ‘The utility analysis of choices involving risk’, Journal of Political Economy 56: 279–304.
Garrett, T.A. and Sobel, R.S. (1999) ‘Gamblers favor skewness, not risk: Further evidence from United States’ lottery games’, Economic Letters 63: 85–90.
Golec, J. and Tamarkin, M. (1998) ‘Bettors love skewness, not risk, at the horse track’, Journal of Political Economy 106: 205–225.
Hanoch, G. and Levy, H. (1970 ‘Efficient portfolio selection with quadratic and cubic utility’, Journal of Business 43 (2): 181–189.
Harvey, C.R. and Siddique, A. (2000) ‘Conditional skewness in asset pricing tests’, Journal of Finance 55 (3): 1263–1295.
Kraus, A. and Litzenberger, R. (1976) ‘Skewness preference and the valuation of risk assets’, Journal of Finance 31 (4): 1085–1100.
Lambert, P.J. (2001) The Distribution and Redistribution of Income, Manchester: Manchester University Press.
Markowitz, H. (1952a) ‘Portfolio selection’, Journal of Finance 7: 77–91.
Markowitz, H. (1952b) ‘The utility of wealth’, Journal of Political Economy 60: 151–158.
Menezes, C. and Wang, X.H. (2005) ‘Increasing outer risk’, Journal of Mathematical Economics 41 (7): 875–886.
Menezes, C., Geiss, C. and Tressler, J. (1980) ‘Increasing downside risk’, American Economic Review, 921–932.
Meyer, J. (1987) ‘Two-moment decision models and expected utility maximisation’, American Economic Review 77 (3): 421–430.
Mosteller, F. and Nogee, P. (1951) ‘An experimental measurement of utility’, Journal of Political Economy 59: 371–404.
Oja, H. (1981) ‘On location, scale, skewness and kurtosis of univariate distributions’, Scandinavian Journal of Statistics 8: 154–168.
Rothschild, M. and Stiglitz, J. (1970) ‘Increasing risk I: A definition’, Journal of Economic Theory 2: 225–243.
Sandmo, A. (1971) ‘On the Theory of the competitive firm under price uncertainty’, American Economic Review 61: 65–73.
Sinn, H.-W. (1983) Economic Decisions under Uncertainty, Amsterdam: North-Holland Publishing Company.
Tobin, J. (1958) ‘Liquidity preference as behaviour towards risk’, Review of Economic Studies 25: 65–86.
Tsiang, S.C. (1972) ‘Rationale for mean-standard deviation analysis, skewness preference, and demand for money’, American Economic Review 62 (3): 354–371.
Van Zwet, W.R. (1964) Convex Transformations of Random Variables, Amsterdam: Mathematical Centre Tracts 7, Mathematisch Centrum.
Acknowledgements
I received valuable comments on earlier drafts of this paper from Carmen Menezes, Peter Lambert, and Roger Hartley and from seminar participants at the University of Manchester and the World Risk and Insurance Economics Congress in Salt Lake City. I alone am responsible for all remaining errors and weaknesses.
Author information
Authors and Affiliations
Appendix
Appendix
Proof of Lemma 2
-
(i) Let F̂(x)=F(σ F x+μ F ) and Ĝ(x)=G(σ G x+μ G ). Then F−1(G(x)) is convex if and only if F̂−1(Ĝ(x)) is convex, which in turn implies and is implied by [F̂−1(Ĝ(x))−x] being convex. F̂ can thus cross Ĝ at most twice. But μ F̂ =μ Ĝ and σ F̂ =σ Ĝ imply that F̂ cannot cross Ĝ less than twice.
(ii) Let F̂(x)=F(σ F x+μ F ) and Ĝ(x)=G(σ G x+μ G ). μ F̂ =μ Ĝ and σ F̂ =σ Ĝ are equivalent to ∫ a b[Ĝ(y)−F̂(y)]dy=0 and ∫ a b∫0y[Ĝ(s)−F̂(s)]dsdy=0 (see Menezes et al. (1980) for a proof). Ĝ crossing F̂ twice first from above implies that ∫ a xĜ(y)dy can cross ∫ a xF̂(y)dy at most once from above, which, together with ∫ a b∫0y[Ĝ(s)−F̂(s)]dsdy=0, implies that ∫ a xF̂(y)dy crosses ∫ a xĜ(y)dy once from above and ∫ a x∫0y[Ĝ(s)−F̂(s)]dsdy⩾0 for all x. □
Proof of Theorem 1
-
If F and G are skewness comparable, then, by Lemma 1, μ F =μ G , σ F 2=σ G 2, and m F 3=m G 3 clearly imply F(x)=G(x). (If μ F =μ G , σ F 2=σ G 2, and F(x)≠G(x), then m F 3≠m G 3.)
For the converse, we are to show that if F and G are not skewness comparable, then it is possible that (μ F ,σ F 2,m F 3)=(μ G ,σ G 2,m G 3) and F(x)≠G(x). Let F and G be such that μ F =μ G =μ, σ F 2=σ G 2=σ2, and ∫ a x∫ a y[G(z)−F(z)]dzdy>0 for x◯ and
 .
20
Since μ
F
=μ
G
implies ∫
a
b[G(y)−F(y)]dy=0 and σ
F
2=σ
G
2 together with μ
F
=μ
G
implies ∫
a
b∫
a
y[G(s)−F(s)]dsdy=0, repeated integration by parts gives
.
20
Since μ
F
=μ
G
implies ∫
a
b[G(y)−F(y)]dy=0 and σ
F
2=σ
G
2 together with μ
F
=μ
G
implies ∫
a
b∫
a
y[G(s)−F(s)]dsdy=0, repeated integration by parts gives 
That is, (μ F ,σ F 2,m F 3)=(μ G ,σ G 2,m G 3) does not imply F=G if F and G are not skewness comparable.□
 .
.
Proof of Lemma 3
-
(i) By Lemma 1, F being more skewed to the right than G implies m F >m G . Conversely, if F is not more skewed to the right than G, by skewness comparability, either [F(σ F x+μ F )−G(σ G x+μ G )] is a downside risk increase or F(σ F x+μ F )=G(σ G x+μ G ), which implies m F 3⩽m G 3.
(ii) μ F =μ G ≡μ, m F 3=m G 3, and skewness comparability imply that F(σ F x+μ)=G(σ G x+μ) or equivalently
 . Furthermore, since
, σ F >σ G implies that, for x<μ,
 and hence F(x)=G(σ
G
/σ
F
(x−μ)+μ)⩾G(x). and similarly, for x>μ, F(x)⩽G(x). That is, [G(x) → F(x)] is a simple MPS. Conversely if σ
F
⩽σ
G
, then by analogous reasoning [G(x) → F(x)] is an MPC or F(x)=G(x) and hence not an MPS.
and hence F(x)=G(σ
G
/σ
F
(x−μ)+μ)⩾G(x). and similarly, for x>μ, F(x)⩽G(x). That is, [G(x) → F(x)] is a simple MPS. Conversely if σ
F
⩽σ
G
, then by analogous reasoning [G(x) → F(x)] is an MPC or F(x)=G(x) and hence not an MPS.(iii) σ F =σ G , m F 3=m G 3 and skewness comparability imply that F(x)≡G(x+μ G −μ F ). μ F >μ G clearly then implies that [G(x) → F(x)] is an FSD improvement. Conversely, if μ F ⩽μ G , either [G(x) → F(x)] is an FSD deterioration or F(x)=G(x) and hence [G(x) → F(x)] is not an FSD improvement.□
 . Furthermore, since
 and hence F(x)=G(σ
G
/σ
F
(x−μ)+μ)⩾G(x). and similarly, for x>μ, F(x)⩽G(x). That is, [G(x) → F(x)] is a simple MPS. Conversely if σ
F
⩽σ
G
, then by analogous reasoning [G(x) → F(x)] is an MPC or F(x)=G(x) and hence not an MPS.
and hence F(x)=G(σ
G
/σ
F
(x−μ)+μ)⩾G(x). and similarly, for x>μ, F(x)⩽G(x). That is, [G(x) → F(x)] is a simple MPS. Conversely if σ
F
⩽σ
G
, then by analogous reasoning [G(x) → F(x)] is an MPC or F(x)=G(x) and hence not an MPS.Proof of Proposition 1
-
First we know


Second, being Bernoulli distributions, F1(σ1x+μ1) and F2(σ2x+μ2) can cross at most twice, but (7) precludes the case where they cross once because if two distributions with the same mean cross once, then one is an MPS from the other and has a larger variance. That is, to show p1<p2 implies that F2(x) is more skewed to the right than F1(x), we only need to show p1<p2 implies that F1(σ1x+μ1) crosses F2(σ2x+μ2) first from above, that is, (y1−μ1)/σ1<(y2−μ2)/σ2. To see that, suppose p1<p2. Then since (6) is equivalent to

if (y1−μ1)/σ1⩾(y2−μ2)/σ2, then

which implies that F1(σ1x+μ1) single-crosses F2(σ2x+μ2) and contradicts (7). Hence, p1<p2 implies that (y1−μ1)/σ1<(y2−μ2)/σ2 and F1(σ1x+μ1) crosses F2(σ2x+μ2) exactly twice first from above.
If p1=p2, then by (6)

which gives

and thus contradicts (7). That is, p1=p2 implies (y1−μ1)/σ1=(y2−μ2)/σ2, which by (6) implies (z1−μ1)/σ1=(z2−μ2)/σ2 and hence F1(σ1x+μ1)=F2(σ2x+μ2).
This completes the proof of both (i) and (ii) because what is shown also implies that if p1≮p2, then F2(x) is not more skewed to the right than F1(x), and that if p1≠p2, then F1(σ1x+μ1)≠F2(σ2x+μ2).
Proof of Proposition 2 Let T(τ)≡r1(r2−1(τ)). Then t1(x) having more residual progression than t2(x) is equivalent to T(τ)/τ being non-increasing and t1(x) being more residual-concave than t2(x) is equivalent to T being concave. T(τ)/τ is non-increasing in τ if

But by the Mean-Value Theorem, for any τ>0, there exists  such that

The concavity of T and T(0)⩾0 thus implies

That is, T(τ)/τ is non-increasing in τ. □
Rights and permissions
About this article
Cite this article
Chiu, W. Skewness Preference, Risk Taking and Expected Utility Maximisation. Geneva Risk Insur Rev 35, 108–129 (2010). https://doi.org/10.1057/grir.2009.9
Published:
Issue Date:
DOI: https://doi.org/10.1057/grir.2009.9