

Abstract
Gene expression and regulation with or without alternative splicing are crucial for tissues and cells to function correctly. They have been studied from three almost independent perspectives at the genome level: 1- Recognition of splicing quantitative trait loci (sQTLs), 2- Expression quantitative trait loci (eQTLs) recognition, and 3- Recognition of longer-range physical chromatin interactions between genome segments which model 3D dynamics of cells and tissues. Even though the associations between eQTLs and longer-range chromatin interactions have been previously studied, a similar relationship between sQTLs and chromatin interactions has yet to be analyzed. In this case, examining whether sQTLs control the alternative splicing of their target genes’ mRNA via physically interacting genome segments is crucial. We have jointly analyzed high-throughput chromatin conformation capture (Hi-C) and sQTL datasets over eight human cancer tissues. We have discovered a positive association between the number of genes having sQTLs and chromatin interaction frequency. Such a positive association still exists when we also control for eQTLs. Additionally, sQTLs and their target genes generally exist inside identical topologically associating domains (TADs). These findings are observed over the whole set of analyzed cancer types and functional subsets of the sQTL dataset, such as survival-related sQTLs. Furthermore, tissue-specific sQTLs are statistically enriched in tissue-specific frequently interacting regions (FIREs) in 6 out of 8 human cancer tissues (Chronic Myeloid Leukemia, Colon Adenocarcinoma, Acute Myeloid Leukemia, Lung Adenocarcinoma, Prostate Cancer, Sarcoma). Our sQTL and Hi-C datasets have shown the existence of closer spatial distance between sQTLs and their target genes with possible alternative splicing across several different cancer types in humans. Such a closer spatial distance also exists, independent of whether we integrate eQTLs into the analysis. We found that sQTLs regulate alternative splicing through chromatin interactions. Source code of the analysis in this research is available on https://github.com/seferlab/sqtlhic .
Introduction
Gene expression, gene regulation, and alternative splicing (AS) of mRNA for protein synthesis are crucial for adequately functioning tissues and cells. Gene regulation as well as gene expression differ between multiple tissues within a given species, which are mainly accountable for morphological and cellular differences. In this case, alternative splicing is responsible for gene expression differences and, consequently, for many cellular differences. Alternative Splicing is the alternative mRNA splicing throughout gene expression by which each gene can encode different proteins1. Alternative splicing, as a molecular process, results in several different transcript isoforms from a unique gene, which, as a result, increases the diversity of the proteome and the diversity of transcripts in terms of structure. The transcript frequency over the human transcriptome greatly surpasses the frequency of genes that encode proteins2. On average, every gene encodes for 7 transcript variants3. In humans, alternative splicing occurs in greater than \(90\%\) of the overall mRNAs transcribed from genes in a species-, condition-, or cell type-specific fashion. Such splicing significantly expands the possible protein count over the available set of genes throughout the genome4.
As the accumulating evidence shows, alternative splicing events can be modulated by sequence variants throughout the genome. In this case, splicing quantitative trait loci (sQTLs), which are genetic variants affecting the possible alternative splicing events, are crucial towards complete comprehension of gene expression and regulation and, as a result, have an impact on response to drugs and susceptibility to diseases5. SQTLs basically encompass QTLs for isoform ratios6, and sQTLs can be caused by single-nucleotide polymorphisms (SNPs), which change alternative splicing patterns by modifying the splicing factor’s binding affinity to pre-mRNA, which is specific to the splicing factor sequence. Previous studies have found that no less than \(20\%\) of disease-originating SNPs impact splicing7. Depending on where sQTLs are located within the gene, they may have a different impact on the splicing machinery. In terms of lessening the abundance of functional mRNAs, sQTLs can cause alternative splicing events that lead to exon skipping, intron retention, or the use of alternative splice sites8,9. This can generate non-functional or less efficient mRNA transcripts, resulting in decreased functional mRNA abundance10. In terms of increasing the abundance of functional mRNAs, Certain sQTLs may promote alternative splicing forms that are more stable or efficient, leading to an increase in the production of functional mRNAs. For example, promoting the inclusion of critical exons can enhance protein function11. In another scenario, some sQTLs may induce splicing variations without affecting the function or stability of the resultant mRNAs, keeping the abundance of functional mRNAs unchanged12. sQTLs are crucial to understanding genetic variants complete impact on disease progression. For instance, alternative splicing is frequently modified across cancer tissues to generate functional and non-functional abnormal proteins, affecting cancer development. We often observe abnormal splicing motifs in cancer initiation, progression, and prognosis, and these aberrant motifs have a significant impact on metastasis, dedifferentiation, and carcinogenesis13. In particular, the gene that encodes spleen tyrosine kinase protein has a different alternatively spliced transcript isoform in breast cancer tissues, which is not expressed in normal cells14. In this case, a detailed comprehension of Alternative Splicing misregulation will be essential in developing specific gene targets to intervene in cancer progression pharmacologically.
The recent development of high-throughput sequencing techniques enables us to analyze gene expression, gene regulation, and alternative splicing at the genome level across various standpoints. Some examples of these high-throughput techniques are SNP chips, which are DNA microarrays testing genetic variation around more than 100,000 specific locations simultaneously throughout the genome, DNA sequencing, and RNA sequencing techniques1,15,16,17,18. Capturing expression quantitative trait loci (eQTLs) has been investigated by many studies19,20, where eQTLs represent variants in the genome that are related to gene expression levels among individuals according to robust statistics. Similarly, as defined previously, splicing quantitative trait loci (sQTLs) are genome loci that control pre-mRNA alternative splicing that might be identified over RNA-seq datasets1,15,21,22. Several computational approaches have been introduced to extract sQTLs from RNA-seq data23,24,25. As a result, the inference of sQTLs, particularly over cancer cells, may be a crucial step in comprehending the impact of genetic variants on cancer progression and tumorigenesis.
The significance of the identified genomic variants across gene regulation and functioning motivates many of the sQTL studies. Cis-regulatory modules (CRMs) are non-coding DNA regions regulating the transcription of the next-door genes. By modifying cis-regulatory modules (CRMs) across the genome, these sQTLs modulate their target genes’ expression. There are several examples of cis-regulatory elements, some of which are mediators, insulators, promoters, and enhancers26,27. Meanwhile, the studies on three-dimensional spatial chromatin shape have shown the significance of interactions between different chromatin segments for the regulation of genes28,29. For instance, cis-regulatory elements could regulate the expression of genes that are further away from the regulatory element via making up longer-range interactions between corresponding chromatin segments30,31. Widely adopted high-throughput chromatin conformation capture techniques such as High-throughput Chromosome Conformation Capture (Hi-C) provide interactions between chromatin segments at a genome-wide scale32,33,34,35. Such a Hi-C interaction dataset is generally composed of interaction frequencies between different chromatin segments, and it is, in general, represented as a contact matrix where the genome is partitioned into equal-sized bins. Each matrix entry shows chromatin interaction frequency (CIF), which is the read pair count aligned to a given bin pair.
Further analysis of Hi-C experiments has revealed A and B compartments, which correspond to the partition of the spatial genome into open and closed chromatin, respectively33. Among these compartments, the A compartment is related to easily accessible, transcriptionally active euchromatin. Similarly, the B compartment is related to condensed, transcriptionally inactive heterochromatin. A compartments are characterized by elevated GC content, are enriched with histone modifications associated with active transcription, often form self-interacting chromatin domains, and tend to coincide with early replication origins. In contrast, B compartments typically have lower GC content, are marked by histone modifications linked to gene repression, and are generally found near the nuclear periphery32,36. The resulting analysis of the Hi-C interaction matrix at a higher resolution has discovered topologically associating domains (TADs), which are frequently interacting, sequentially closely located interaction matrix areas37,38,39,40,41. TADs are pervasive genome organization units that are stable attributes of Hi-C matrices. TADs correspond greatly with cellular differentiation and long-range transcriptional control42,43.
sQTL and Hi-C studies are complementary methods focusing on non-identical gene expression and regulation characteristics. sQTL studies require a linked single-nucleotide polymorphism (SNP), which is the variation at one position in a DNA sequence among individuals. As a result, sQTL results are statistically defined among individuals. On the other hand, chromatin interactions are physical interactions for a given sample, and polymorphism does not need to exist in the dataset. Integrating the outcomes of sQTL and Hi-C methods will be helpful in adequately understanding the connection between them. In this case, one open question will be how important the chromatin interactions become while sQTLs regulate target genes. To the best of our knowledge, this question still needs to be answered, but similar questions on the relationship between chromatin interactions and eQTLs instead of sQTLs have been answered. For example, Duggal et al44. found that eQTLs are statistically close to their target genes in 3D over human IMR90 fibroblasts and ESCs Hi-C datasets. Such statistical closeness is more critical for eQTLs detected overlapping with CRMs and eQTLs detected inside the same topologically associating domain (TAD). According to their study, genomic segments with eQTLs generally have a greater chromatin interaction frequency (CIF). Similar to the findings by Duggal et al., another research19found that CRM-enriched eQTLs are spatially close to target gene promoters over Hi-C datasets. Hi-C datasets in both research are solely for cell lines, whereas eQTL conclusions were derived over both cell line and tissue datasets. Lastly45, has analyzed the proximity between Hi-C and eQTL datasets, and their results have shown the spatial closeness between eQTLs and their corresponding genes among multiple human primary tissues as well as enrichment of the two within the same TAD and compartment domains. The remaining studies accepted the association between eQTL and Hi-C data results a priori. For instance, some of these studies focus on detecting regulatory SNPs46, while others focus on predicting enhancer-promoter interactions47,48.
Even though interactions between chromatin segments are considered one of the fundamental processes defining eQTLs and sQTLs, no direct proof of such a relationship for sQTLs exists for tissues. sQTLs are tissue-specific24,49. Furthermore50, has extracted frequently interacting special regions called Frequently Interacting Regions (FIREs) that are also hotspots of local interactions between chromatin segments over the Hi-C dataset. The existence and distribution of those FIREs are strongly tissue-specific, and they are defined as bins that often interact with nearby segments that are less than 200 kb apart. In this case, the degree of overlap between tissue-specific sQTLs and FIREs has yet to be discovered.
sQTL and Hi-C datasets have recently and systematically become available for several human cell lines and primary tissues, especially cancer tissues. For instance49, has developed a CancerSplicingQTL database, which includes sQTL datasets for 33 cancer types. Various experiments have also generated Hi-C interaction datasets for many cancer tissues32,51,52,53,54,55,56. Similarly57, has systematically mapped eQTLs at a genome-wide scale across 33 cancer tissues. Among these cancer resources, eight cancer tissues overlap, as seen in Table 6, which facilitates a robust assessment of the connection between sQTLs and chromatin interactions across several cancer tissues while also controlling for eQTLs. Table 6 in the Results section summarizes these datasets.
In this paper, we have jointly analyzed the relationship between sQTLs and Hi-C datasets across eight cancer tissues while considering eQTLs. We have identified a positive association between the frequency of sGenes and CIF, where sGene is a gene whose expression is significantly related to an sQTL. Such positive association still exists when we also control for eGenes, which represent genes whose expression is significantly associated with an eQTL instead of an sQTL. Additionally, sQTLs colocalize with their target genes more frequently inside the same TAD than a randomly created control dataset. This colocalization result is also valid when we consider subsets of sQTLs, such as GWAS sQTLs49, which overlap with identified GWAS (Genome-wide association study) regions associated with linkage disequilibrium regions and survival sQTLs49, which impact patient survival time for a given cancer. All our results are compatible across all the evaluated cancer types and tissues. Due to the tissue specificity of both FIREs and sQTLs50, we have analyzed the degree of association between tissue-specific FIREs and tissue-specific sQTLs and identified a positive relationship between them across most of the cancer tissues.
To our knowledge, this is the first study to analyze the relation between sQTLs and chromatin interactions across a number of human cancer types and to analyze the association between tissue-specific FIREs and tissue-specific sQTLs. Our results are important to enhance our comprehension of the roles of sQTLs and chromatin interactions on gene expression and regulation through alternative splicing. Overall, our tested hypotheses can be summarized as follows:
-
Hypothesis 1: Are the number of chromosome-wide chromatin interactions significantly related with the number of splicing-related genes (sGenes)?
-
Hypothesis 2: Are TADs and compartment domains enriched in terms of sQTL-gene associations?
-
Hypothesis 3: Are TADs and compartment domains enriched in terms of GWAS and cancer survival sQTL-gene associations?
-
Hypothesis 4: Are cancer tissue-specific sQTLs enriched in cancer tissue-specific FIREs?
Results
Hypothesis 1: the number of chromosome-wide chromatin interactions is significantly positively related with the number of sGenes
As a hypothesis, we can expect a pair of loci located as an sQTL-gene association to interact more frequently, granted that 3D chromatin organization impacts the sQTLs regulation of their target genes. We test this hypothesis by fitting negative binomial and linear regressions and evaluating the association between CIF and the number of sGenes associations between two loci over an interaction dataset with 10 kb resolution by using these regression models. As discussed in the Methods section, we have ignored the interactions within the same bins and only used sQTL-gene pairs that are located in different bins. Once we have controlled for the genomic distance between any loci pair, the relationship between a number of sGenes and CIF becomes significantly positive (p-value \(<0.001\)) overall human cancer tissues as seen in Fig. 1a. For instance, in LAML cancer tissue, according to negative binomial regression, the relationship between the number of sGenes and CIF is 0.21 (p-value \(<0.001\)). According to this effect, CIF would have been \(1.23 = e^{0.21}\) times greater for each additional scene in a single pair of bins. This effect coefficient changes across different cancer tissues, taking values between 0.05 and 0.21. Across these experiments, effect sizes are similar to each other for relatively more similar tissues such as CML (Chronic Myeloid Leukemia) and LAML (Acute Myeloid Leukemia). Furthermore, in the same regression models, the coefficient between CIF and genomic distance is significantly negative across all cancer tissues. Such a negative coefficient is expected since interaction frequency between two loci in general decreases as the distance between these loci increases33. Once we change the resolution of binning for both interaction and sQTL datasets, we still observe similar significance results as seen in Fig. 1b for both 5 kb, 10 kb, and 40 kb resolutions, where we only plot the coefficients of sGenes. Similar to the 10 kb resolution results above, across different resolutions, effect sizes are pretty identical to each other for relatively more similar tissues such as CML and LAML. We also observe identical statistical significance results when we run linear regression instead of negative binomial regression, as shown in the Supplementary Materials.

The relationship between sGenes quantity and chromatin interaction frequency, estimated by fitting negative binomial regression. While estimating the relationship between sGenes and chromatin interaction frequency, we also control for genomic distance. ± standard errors are represented by the error bars. (***) stands for \(p < 0.001\), whereas (**) stands for \(p < 0.01\) significance. (a) The effect of sGenes over multiple cancer tissues. (b) The effect of sGenes across different resolutions.
To check robustness of these results, we have also analyzed the relationship between significant Hi-C peaks and sQTL-gene associations. We utilized Fit-Hi-C58 to infer significant set of interactions. Similar to Fig. 1a, once we have controlled for the genomic distance between any loci pair, the relationship between a number of sGenes and CIF becomes significantly positive (p-value \(<0.001\)) overall human cancer tissues as seen in Fig. 2a. Once we change the resolution of binning for both interaction and sQTL datasets; we still observe similar significance results as seen in Fig. 2b for both 5 kb, 10 kb, and 40 kb resolutions, where we only plot the coefficients of sGenes. Similar to the 10 kb resolution results above, across different resolutions, effect sizes are pretty identical to each other for relatively more similar tissues such as CML and LAML.

The relationship between sGenes quantity and chromatin interaction frequency after finding significant interactions peaks via Fit-HiC, estimated by fitting negative binomial regression. While estimating the relationship between sGenes and chromatin interaction frequency, we also control for genomic distance. ± standard errors are represented by the error bars. (***) stands for \(p < 0.001\), whereas (**) stands for \(p < 0.01\) significance. (a) The effect of sGenes over multiple cancer tissues. (b) The effect of sGenes across different resolutions.
33 has proposed the partition of the genome into A and B compartments. These compartments have been associated with higher gene density and lower gene density regions, respectively. They have also discovered that a pair of genome regions with different compartment types has a lower interaction frequency than regions inside the same compartment types. According to this result, gene density might play a critical role in chromatin interactions. To control for the essential role of gene density in our analysis, as seen in Fig. 3a, we have integrated the absolute difference in tested gene counts among the pair of bins as an extra attribute into the regression framework. We have discovered that the relationship between the difference in gene density between pairs of bins and CIF is significantly negative in all cancer tissues. The correlation between the number of sGenes and gene density difference is also small, with a Pearson correlation \(\le 0.05\) in all cancer tissues. Furthermore, the correlation between the number of sGenes and CIF remains significantly positive, where the estimated effects are higher than the previous model, which does not take into account the gene density difference. Moreover, we have conducted a stratification analysis by stratifying the data based on the gene density difference. Stratification divides the population into subsets (called strata), within each of which an independent sample is selected. In this analysis, the gene count difference ranges between 0 and 8, and sample sizes are relatively small for the strata with differences greater than 5. The results were similar to those in Figs 1a-3a for many of the analyzed strata. In a few strata, the estimated coefficients for sGene count were negative but without statistical significance.
We have also analyzed the datasets by incorporating the number of genes without an associated sQTL into the regression model instead of the number of sGenes. According to Fig. 3b, the coefficients are mostly negative across all cancer tissues. For LAML tissue, the relationship between the number of genes without an associated sQTL and CIF is positive. However, this positive coefficient is remarkably smaller than the coefficients for the number of sGenes. As a result, CIF is related to the number of sGenes, not to the total gene count. We also observe similar statistical significance results when we run linear regression instead of negative binomial regression, as shown in the Supplementary Material. The relationship between sQTL counts vs genomic distance, as well as eQTL counts vs genomic distance, is also shown in the Supplementary Material.

(a) The relationship between sGenes frequency and chromatin interaction frequency is estimated by fitting negative binomial regression, where we also adjust for gene density difference and genomic distance covariates. (b) Estimated coefficients while regressing CIF against the number of genes without sQTLs and controlling for gene density difference and genomic distance. ± standard errors are represented by the error bars. (***) stands for \(p < 0.001\), whereas (**) stands for \(p < 0.01\) significance. (a) The effect of sGenes over multiple cancer tissues. (b) CIF is related to the number of sGenes, not to the total gene count.
Previous research45 has found that the number of eGenes (eQTL-gene associations) is also positively associated with chromatin interaction frequency for a number of human tissues. We test the robustness of our sQTL results by applying similar regressions while controlling for eGenes as well. Specifically, we test our sQTL hypothesis by fitting negative binomial and linear regressions and evaluating the association between CIF and the number of sGenes associations between two loci over an interaction dataset with 10 kb resolution while controlling for eGenes and genomic distance. In this case, the relationship between the number of sGenes and CIF is also significantly positive (p-value \(<0.0001\)) across all human cancer tissues, as seen in Fig. 4a. For instance, in CML cancer tissue, according to negative binomial regression, the relationship between the number of sGenes and CIF is 0.32 (p-value \(<0.0001\)). According to this effect, CIF would have been \(1.38 = e^{0.32}\) times greater for each additional sGene in a single pair of bins. This effect coefficient varies across different cancer tissues, ranging between 0.24 and 0.32. Across these experiments, similar to the case without eGenes, effect sizes are pretty similar for relatively more similar tissues such as CML (Chronic Myeloid Leukemia) and LAML (Acute Myeloid Leukemia). Similar to the case without eGenes above, the coefficient between CIF and genomic distance is significantly negative across all cancer tissues. In order to analyze the impact of the resolution, once we change the resolution of binning for both interaction and sQTL datasets, we still observe similar significance results as seen in Fig. 4b for both 5 kb, 10 kb, and 40 kb resolutions, where we only plot the coefficients of sGenes. Similar to the 10 kb resolution results above, across different resolutions, effect sizes are pretty similar for relatively more similar tissues such as CML and LAML. We also observe similar statistical significance results when we run linear regression instead of negative binomial regression, as shown in the Supplementary Material.

The relationship between sGenes quantity and chromatin interaction frequency, estimated by fitting negative binomial regression. While estimating the relationship between sGenes and chromatin interaction frequency, we also control for eGenes and genomic distance. ± standard errors are represented by the error bars. (***) stands for \(p < 0.001\), whereas (**) stands for \(p < 0.01\) significance. (a) The effect of sGenes over multiple cancer tissues. (b) The effect of sGenes across different resolutions.
We have also analyzed the significance of the positive association between chromatin interaction frequency (CIF) and sGenes across individual autosomal chromosomes for lung and prostate cancer types via negative binomial regression over the interaction dataset with 10 kb resolution, as seen in Fig. 5a-b respectively. In terms of lung cancer, the positive association between CIF and sGenes is statistically significant for all autosomal chromosomes except 17, 21, and 22 (p-value \(<0.001\)), as shown in Fig. 5a. Similarly, such positive associations are statistically significant for all prostate cancer chromosomes except 9 and 19 (p-value \(<0.001\)), as shown in Fig. 5b. Detailed chromosomal results for the remaining cancer types can be found in the Supplementary Material.

The relationship between sGenes quantity and chromatin interaction frequency per chromosome, estimated by fitting negative binomial regression while controlling for eGenes and genomic distance as well. Results are in (a) LUAD and (b) PRAD cancer tissues. ± standard errors are represented by the error bars. (***) stands for \(p < 0.001\), whereas (**) stands for \(p < 0.01\) significance.
We also report the adjusted \(R^2\) values for negative binomial regressions seen in Figs. 1a, 3a, and 4a, respectively, as seen in Table 1. In general, adding the covariates to model nonuniformity in the gene distributions between the bins (\(G_{\text {Diff}}\)) and the frequency of eQTL-gene associations with transcription start sites (TSS) located in bin \(i\) or bin \(j\) (\(G_{\text {eGene}}\)) to the negative binomial regression leads to better prediction results.
We have also tested whether taking the confounding effects into account between covariates improves the performance as seen in Table 2. Here, we have extended the negative binomial regression equation 3 by taking into account the pairwise interaction and confounding effects between the covariates as in Eq. 4. In terms of adjusted \(R^2\) values, the scores frequently stay the same or decrease as a result of extending the equation. Therefore, we mainly report the results without considering the covariate interactions.
We have also ensured that our conclusions so far are not impacted by the model choices by performing similar analyses using linear regression models and log-transformation models, where we log-transform the independent variables. In all cases, we have identified a significant positive relationship between CIF and the number of sGenes.
Hypothesis 2: TADs and compartment domains are enriched in terms of sQTL-gene associations
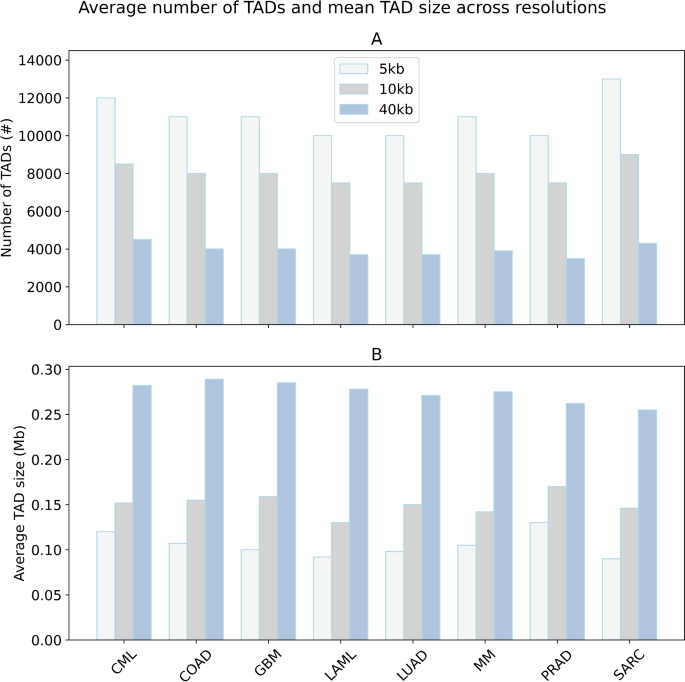
Average number of TADs and the mean TAD size in Mb inferred by Armatus for different cancer types across 5 kb, 10 kb and 40 kb resolutions.
Genomic regions within the same TAD tend to interact more frequently than those in different TADs37,59. Taking this into account, we analyzed whether TADs are enriched for sQTL-gene associations. Firstly, Fig. 6 shows the average number of TADs and the mean TAD size in Mb inferred by Armatus for different cancer types at various resolutions. As detailed in the Methods section, we generated pseudo-SNP-gene pairs by matching each sQTL-gene pair in the dataset without altering the position of the gene’s TSS but instead placing the SNP on the opposite side of the TSS for all tissues. While a higher proportion of sQTL-gene pairs remained within the same TAD after placing the SNP on the opposite side, a significant number of sQTL-gene pairs started to span across different TADs, ranging from 10% to 15% across all tissues. However, none of the sQTL-gene pairs that were located in different TADs reverted to being in the same TAD, as determined by McNemar’s test with a p-value of \(< 1 \times 10^{-16}\) for all cancer tissues. Additionally, the number of sQTL-gene pairs located within the same TAD in the real dataset is statistically significantly higher than in the simulated dataset, according to Fisher’s exact test with a p-value of \(< 1 \times 10^{-16}\) for all cancer types, as shown in Fig. 7a. For example, in CML tissue, \(58.23\%\) of pseudo sQTL-gene pairs were inside TADs, whereas it was \(68.45\%\) for sQTL-gene pairs in the real dataset.
We further analyzed the ratio of SNP-gene pairs inside topologically associating domains (TADs) per chromosome for both pseudo and real LUAD cancer datasets, as depicted in Fig. 7b. Similarly, we observed that the number of sQTL-gene pairs located within the same TAD in the real LUAD dataset was statistically significantly higher than in the simulated dataset, confirmed by Fisher’s exact test for all chromosomes. We observed similar statistically significant enrichment profiles across different chromosomes for other cancer types as well.

Enrichment of sQTL-gene associations in topologically associating domains. The ratio of SNP-gene pairs inside topologically associating domains for pseudo and real data, (***) \(p < 0.001\) for Fisher’s exact test, (**) \(p < 0.01\) for Fisher’s exact test. (a) Over all cancer types, (b) Over all chromosomes of LUAD cancer type.
These associations remain valid even when taking genomic distances into account. As outlined in the Methods section, we conducted a joint analysis with distance as an independent variable and performed stratified analyses where distance served as the stratifying factor. In logistic regression analysis, the odds ratio for a SNP-gene pair being located within the same topologically associating domain (TAD) was statistically significantly higher for real datasets compared to simulated datasets across all cancer tissues, as shown in Table 3. The results of stratified analyses for lung (LUAD) and prostate (PRAD) cancer tissues are illustrated in Fig. 8a and b, where we stratified by the distance between sQTL and gene splicing positions. These TAD enrichment findings are robust across different TAD callers.

Enrichment of sQTL-gene associations in topologically associating domains. Examples from LUAD and PRAD show detailed results after stratification by the distance between QTL and gene splicing positions (x-axis, in 10 Kb). All comparisons are significant with \(p < 0.001\). (a) LUAD (b) PRAD
Similar to TAD enrichment analysis, we have also analyzed whether compartment domains33 are enriched for sQTL-gene associations as seen in Fig. 9a-b. As discussed in Methods in detail, we generated a pseudo-SNP-gene pair matching every sQTL-gene pair in the dataset, following a similar process as for TADs. We found that the number of sQTL-gene pairs located within the same compartment domain in the real dataset is statistically significantly higher than in the simulated dataset (Fisher’s exact test, \(p < 1 \times 10^{-5}\) for all cancer types). For instance, \(56.98\%\) of pseudo-sQTL-gene pairs in CML tissue were inside compartment domains, whereas it was \(71.01\%\) for sQTL-gene pairs in the real dataset.

Enrichment of sQTL-gene associations in compartment domains. The ratio of SNP-gene pairs inside compartment domains for pseudo and real data, (***) \(p < 0.001\) for Fisher’s exact test, (**) \(p < 0.01\) for Fisher’s exact test. (a) Over all cancer types, (b) Over all chromosomes of LUAD cancer type.
The degree of association between tissue-specific chromatin interactions and tissue-specific sQTLs is useful for identifying genes regulated by sQTLs via chromatin interactions in the analyzed cancer tissue. For instance, we analyzed 3961 tissue-specific FIREs and 11005 tissue-specific sQTLs in lung cancer tissue. Considering both factors, we identified 534 lung adenocarcinoma-specific sQTLs within these lung adenocarcinoma-specific FIREs. Among these sQTLs, we found statistically significant associations with six genes: XPA (DNA Damage Recognition And Repair Factor), EGFR (Epidermal growth factor receptor), KRAS (Kirsten rat sarcoma virus), DDR2 (Discoidin domain-containing receptor 2), ALK (Anaplastic lymphoma kinase), and ADGRB2 (Adhesion G protein-coupled receptor B2). EGFR is a transmembrane protein and an epidermal growth factor receptor that regulates cellular pathways involved in cellular proliferation. It is expressed in more than 50% of lung adenocarcinomas and is a critical focus in therapeutic strategies for these tumors60,61. KRAS proteins transmit growth or differentiation signals from the cell exterior to the nucleus, and mutations leading to increased KRAS expression are well-studied events in lung adenocarcinoma and other epithelial cancers62. DDR2 mutations are also implicated in adenocarcinoma development and are targeted in lung cancer therapy63. ALK plays a role in gut development during embryonic development, but is also involved in lung cancer64,65,66. ADGRB2 exhibits tissue-specific expression patterns during development as a signaling receptor37, and its expression levels increase during lung development67. The transcription start site of ADGRB2 is located at position 32,192,718 on chromosome 1, approximately 47 kb away from the tissue-specific FIRE located between positions 32,240,000 and 32,320,000 on chromosome 1.
Hypothesis 3: TADs and compartment domains are enriched in terms of GWAS and cancer survival sQTL-gene associations
Similar to the analysis in the previous section, we investigated whether topologically associating domains (TADs) are enriched for GWAS and cancer survival sQTL-gene associations49. GWAS sQTLs overlap with genomic regions identified by GWAS as being associated with linkage disequilibrium regions, providing insights into the functional interpretation of genetic variants. Survival sQTLs, on the other hand, are associated with patient survival time in cancer, making them crucial for prioritizing sQTLs that might influence cancer prognosis. According to Table 4, both GWAS sQTLs and cancer survival sQTLs show statistically significant enrichment for sQTL-gene pairs located within the same TAD compared to simulated datasets across nearly all cancer types, as determined by Fisher’s exact test. This indicates that the physical proximity within TADs may play a role in the regulatory mechanisms mediated by these sQTLs. Furthermore, when logistic regression is applied while considering genomic distances as an independent variable, the odds ratio for an SNP-gene pair being located within the same TAD remains significantly greater in real datasets compared to simulated datasets across all cancer tissues, confirming the robustness of these associations.
The degree of association between tissue-specific chromatin interactions and tissue-specific sQTLs is crucial for identifying genes regulated by sQTLs via chromatin interactions in the analyzed cancer tissue. We found both survival-sQTLs and GWAS-sQTLs to be significantly associated with four genes specific to lung adenocarcinoma development: EGFR, KRAS, DDR2, and ALK. Additionally, survival-sQTLs are associated with APC, CASP8, and TP53 genes. APC and CASP8 are implicated in the metastasis of lung cancer68. APC, a tumor suppressor gene involved in cell adhesion, exhibits mutations in lung adenocarcinoma69. CASP8 polymorphisms influence prognosis in advanced lung cancer even post-therapy70. TP53 mutations are well-known markers across various human cancer types, including lung cancer.
Hypothesis 4: Cancer tissue-specific sQTLs are enriched in cancer tissue-specific FIREs
sQTLs exhibit significant tissue-specificity49. Building upon this finding, we investigated whether tissue-specific sQTLs are enriched within tissue-specific FIREs. Across the 8 cancer tissues analyzed, we identified a total of 443,567 tissue-specific sQTLs. Calculated odds ratios indicate that tissue-specific sQTLs are enriched in 7 out of 8 tissues, with values exceeding 1, suggesting an enrichment within tissue-specific FIREs. Specifically, 6 of these tissues (CML, COAD, LAML, LUAD, PRAD, SARC) exhibit statistically significant odds ratios greater than one after Bonferroni correction, as detailed in Table 5; GBM nearly meets this criterion. This statistically significant enrichment suggests that tissue-specific sQTLs may exert their regulatory effects through tissue-specific chromatin interactions, which is particularly evident in at least seven cancer tissues. However, we observed a negative association in Multiple myeloma (MM) cancer tissue. Potential reasons for this negative association include 1) Variations in the cancer samples used to construct the interaction and eQTL datasets, possibly collected from different individuals or different locations within the lung cancer tissue; 2) Complex associations between chromatin organization and sQTLs specific to lung cancer tissue compared to other tissues; 3) Heterogeneity in the samples, reflecting diverse cell type compositions. Further experimental datasets are necessary to assess the impact of these factors comprehensively. Despite the lack of consistent directional results across all cancer tissues, many may exhibit a positive association between tissue-specific sQTLs and tissue-specific FIREs rather than a negative one.
Discussion
Gene regulation is understood to be affected by sQTLs and the spatial organization of chromatin. In this research, we have focused on identifying the association between spatial chromatin interactions and sQTL-gene associations across 8 human cancer tissues in a systematic way. We have identified CIF to have a positive association with eGenes count. Also, TADs are enriched for sQTL-gene associations. We observed these results in all 8 assessed human cancer tissues. To the best of our knowledge, this is the first study to come up with well-grounded statistical support for these results across multiple cancer tissues. Furthermore, the added perspective of TADs is crucial for our understanding of alternative splicing. Establishing sQTLs and their target genes tend to reside within the same TAD is a significant aspect of our research; though expected, this correlation provides concrete statistical evidence that sQTLs regulate their target genes through chromatin interactions. The correlation between regulation manner and residence within a TAD is suggested by45, and our results are statistically solidified with a similar approach.
Tissue-specific sQTLs are statistically significantly enriched in tissue-specific FIREs in 6 out of 8 human cancer tissues. According to this result, tissue-specific sQTLs could operate via tissue-specific chromatin interactions in these six tissues. However, the association between tissue-specific sQTLs and chromatin interactions is significantly negative in lung adenocarcinoma tissue. Several factors can explain these results. The more complex functioning of lung cancer tissue may be the principal underlying mechanism. Another factor could be heterogeneous tissue cell types or sample sources. Noise may have introduced possible heterogeneity into our analysis, and we might have obtained more robust results if we had analyzed more homogeneous datasets.
One of our main observations is the correlation between TADs and sQTL locations. This may support a current hypothesis: Disruption of the established TAD structure near an sQTL could lead to significant differences in the alternative splicing pattern of its associated gene. For instance, if an sQTL associated with a splicing gene is located inside a TAD and is also linked to an enhancer (such as one from the collection of inside-TAD sQTLs associated with functional regulatory elements examined earlier), this hypothesis could be experimentally tested by physically separating the relevant parts of the sQTL so that the splicing gene and mutation are not in close proximity in 3D space. The experimental method described in71 allows for testing such hypotheses by manipulating and merging TADs.
The association between chromatin interaction frequencies and sQTLs (splicing Quantitative Trait Loci) can indicate complex, sometimes unexpected, regulatory effects, where sQTLs influence gene expression through chromatin conformation and interactions. In some cases, an association of greater chromatin interaction frequencies with sQTLs might provide evidence in favour of surprising unilateral effects caused by such sQTLs, which have been observed regardless of functional consequences for these genomic entities. This surprising unilateral specificity has been discussed in72, where they discuss long-range chromatin interactions and their potential link to gene regulation through promoters and enhancers, relevant to sQTLs’ regulatory mechanisms. Another study by73 provides insight into how chromatin accessibility, influenced by genetic variants like sQTLs, can be linked to altered chromatin interactions and gene expression patterns.
We have conducted our analyses using Hi-C datasets with a 10 kb resolution, significantly higher than that used in similar joint eQTL and Hi-C analyses45. The strength of sQTL analysis is mainly influenced by sample size. Due to the sample size in our datasets, we may have overlooked some SNP-gene splicing associations in this study. Additionally, the analysis of enrichment in topologically associating domains did not consider linkage disequilibrium (LD) among sQTLs. If there are any effects of LD, they are likely to have balanced out between simulated and real datasets with a high probability.
Our study may have several areas for improvement. For instance, our approach could be further refined to control for additional confounding factors. Additionally, our datasets may have inherent limitations. For example, eQTL and sQTL studies are valuable for understanding the genetic regulation of gene expression. However, like any scientific research, eQTL and sQTL studies have their weaknesses and limitations. Common weaknesses associated with these studies include population bias, sample size, and issues of causality74. Similarly, Hi-C datasets are collected from an ensemble of cell populations, where individual cell data may vary slightly. Moreover, although we independently matched Hi-C datasets with the remaining sQTL and eQTL datasets for each cancer tissue, the combined Hi-C, sQTL, and eQTL datasets were obtained from different sources, potentially introducing heterogeneity that may not have been eliminated in our analysis.
Conclusions
As a summary, we have discovered that sQTLs are spatially located near their target genes, potentially influencing alternative splicing across multiple human cancer tissues. This proximity exists regardless of whether we integrate eQTLs into the analysis. Our findings indicate that sQTLs regulate alternative splicing through chromatin interactions, which are robust across different Hi-C binning resolutions. These results contribute to understanding how sQTLs and chromatin interactions complement each other in regulating gene expression through alternative splicing mechanisms. In the future, our methods could be applied to other genomic datasets involving pairwise interactions, such as promoter-enhancer pairs. Furthermore, our approach can be adapted to control for additional confounding factors effectively. As more high-resolution interaction datasets specific to tissues become available, our proposed approach could provide deeper insights into how chromatin structure influences association pairs across various cell types.
Methods
Data description
We utilized sQTL, eQTL, and Hi-C datasets across eight human cancer tissues: Chronic Myeloid Leukemia (CML), Colon Adenocarcinoma (COAD), Glioblastoma (GBM), Acute Myeloid Leukemia (LAML), Lung Adenocarcinoma (LUAD), Multiple Myeloma (MM), Prostate Cancer (PRAD), and Sarcoma (SARC)32,49,51,52,53,54,55,56,57,75. Further details about these datasets can be found in Tables 6, 7. In our study, we analyzed only autosomal chromosomes with hg19 as the reference genome. Additionally, Fig. 10 shows the log-transformed Hi-C interaction matrix at 10 Kb resolution for chromosome 20 in GBM. At a high level, our analysis can be summarized as in Fig. 11. The number of raw intra-chromosomal unique read pairs across eight human cancer tissues exceeds 3 billion, with over 800 million pairs having a distance greater than 15 kb between their endpoints. We analyzed Hi-C datasets with a binning resolution of 10 kb. TAD boundaries were inferred using Armatus76 with \(g=0.5\). Additionally, TADs were identified using Arrowhead32 with default parameters and MrTADFinder77 with \(res = 1.5\) to ensure the robustness of results. FIREs were inferred using FIREcaller78 across the cancer tissues, yielding an average of 2070 TADs and 3682 FIREs per tissue sample.

Log-transformed Hi-C interaction matrix of GBM at 10 kb resolution, for chromosome 20.

Our analysis pipeline at a high level.
Regression analysis of the association between interaction frequencies and sQTLs
Firstly, regression methods were employed to analyze the association between sQTL counts and chromatin interaction frequency (CIF), similar to the previous eQTL analysis45. Each SNP-splicing gene pair in the CancerSplicingQTL database49 was mapped to a single bin pair. SNP-gene pairs mapped to the same interaction matrix bin were excluded from the analysis. For every bin pair (i, j) where \(i < j\), the following attributes were considered:
-
1.
\(F_{\text {Hi-C}}\): Chromatin interaction frequency (CIF) between bins i and j,
-
2.
\(G_{\text {sGene}}\): Frequency of sGenes (splicing genes) with transcription start site (TSS) located in bin i or bin j,
-
3.
\(G^{s}_{i}\): Count of tested genes over the sQTL dataset where the transcription start site is located in bin i,
-
4.
\(G^{s}_{j}\): Count of tested genes over the sQTL dataset where the transcription start site is located in bin j,
-
5.
\(G_{\text {eGene}}\): Frequency of eGenes (eQTL-gene associations) with transcription start site (TSS) located in bin i or bin j,
-
6.
\(D = |i - j|\): Genomic distance between bins i and j.
In our analysis, we impose the constraint \(G^{s}_i + G^{s}_j> 0\), which focuses on bin pairs containing at least one tested gene. To better understand the relationship between sQTL results and CIF, we applied linear and negative binomial regression models where CIF is regressed against the sGenes count in each human cancer tissue. Given that the genomic distance between two loci affects the CIF between them33, we incorporated distance D as an additional covariate in the following regression models:
where Equations 1 and 2 define the negative binomial and linear regressions of CIF against sGenes count, respectively, and \(\ln\) represents the corresponding log transformation in negative binomial regression. Moreover, chromatin interactions are observed more frequently inside the same compartment than between gene-poor and gene-dense compartments33. Although compartments are observed at a multi-megabase scale, gene density might play a critical role in chromatin interactions, according to this observation. Therefore, we further controlled for nonuniformity in gene distributions between bins i and j by adding the gene difference \(G_{\text {Diff}} = |G^{s}_i - G^{s}_j|\) to our regression models as another feature. Higher \(G_{\text {Diff}}\) values indicate a less uniform distribution of genes between bin pairs i and j. Below, we define the regression equation specifically for the negative binomial regression, but the linear regression follows a similar form without the logarithm.
We have extended the negative binomial regression equation above by taking into account the pairwise interaction and confounding effects between the covariates as seen below in Equation 4. The motivation for modeling the impact of interactions is mainly to capture non-additive effects. Biologically, for instance, by modeling the interaction between \(G_{\text {sGene}}\) and \(G_{\text {Diff}}\), if sGenes are mostly located in gene-rich bins, the regulatory potential via chromatin interactions may differ depending on whether they are paired with gene-poor or gene-rich bins. Chromatin interactions are influenced by compartmentalization; gene-rich regions tend to be in A compartments and interact with other gene-rich loci. The effect of sGenes on CIF might be dampened if they are in a bin with high gene density and paired with a bin with very low density (due to compartment incompatibility or chromatin compaction differences). However, in these scenarios, we did not find the confounding effects between covariates to be statistically significant. Therefore, we primarily report the results without considering the covariate interactions:
In the results section, we present the estimated coefficients obtained by fitting these equations with bar plots, where “Effect on chromatin interaction frequency” represents the estimated coefficient on the y-axis. We have also applied stratified analysis to subsets stratified by the distance between sQTL and the splicing position of the genes, where stratification partitions the whole population into subsets known as strata. Then, an independent sample is chosen within each stratum. As discussed in the Results section, even after stratification, we found a significant positive relationship between the number of sGenes and CIF.
We also conducted a similar regression analysis for the number of non-sGenes, defined as tested genes without any sQTLs. We compared its coefficient in the regression with that of sGenes. Let \(G_{\text {non-sGene}}\) denote the number of non-sGenes, and the regression on non-sGenes is as follows:
Lastly, we performed a sensitivity analysis by running other regression models where input variables (independent variables) are either treated as categorical variables or defined on a logarithmic scale in a linear regression. This sensitivity analysis ensures that the choice of model does not primarily influence our conclusions. Even with such categorization and logarithmic transformation, we still identified a significant positive relationship between CIF and the number of sGenes, as discussed in the Results section.
Enrichment study of sQTL-gene relationships in topologically associating and compartment domains
To assess whether splicing quantitative trait loci (sQTLs) are spatially closer to certain genes (such as EGFR or DDR2) than expected by chance, we performed a permutation-based significance test using Hi-C chromatin interaction data. For each target gene, we first computed the observed mean 3D chromatin distance between the gene’s genomic bin and all specific sQTL-containing bins. This observed mean distance served as the test statistic and reflects the average physical proximity between the sQTLs and the gene in the three-dimensional chromatin structure. To evaluate whether this observed proximity was statistically significant, we generated a null distribution by randomly reassigning the genomic locations of the specific sQTLs 1000 times while preserving their count. For each permutation, we recalculated the mean Hi-C distance to the gene of interest. An empirical p-value was then derived by computing the proportion of permutations in which the randomized mean distance was less than or equal to the observed distance.
We also assessed whether TADs are enriched for sQTL-gene associations across all human cancer tissues. The enrichment analysis proceeded as follows: For each tested SNP-gene pair, we generated a matched pseudo-pair as a control. This pseudo-pair was created by flipping the SNP’s direction while keeping the gene’s transcription start site (TSS) position unchanged, ensuring the SNP remained at the same distance but on the opposite side of the TSS. For example, if the actual SNP were located 90 kb upstream of the TSS, its flipped position in the control dataset would be 90 kb downstream of the TSS. This procedure maintained the distributions of SNP-TSS distances and gene locations identical between the pseudo pairs and actual SNP-gene pairs. If the flipped location extended beyond the chromosome boundary, both the exact pair and its matched pseudo-pair were excluded from further analysis.
We analyzed SNP-gene pairs using two attributes: (1) whether the transcription start site (TSS) of a gene and SNP belong to the same TAD, and (2) whether the SNP-gene pair is an actual pair or a pseudo pair. This resulted in a 2x2 matrix where we observed if the probability of SNP-gene pairs switching from being within the same TAD to different TADs is significantly greater. To test this hypothesis, we applied McNemar’s test. Additionally, we evaluated the relationship between these two attributes using Fisher’s exact test.
Additionally, we incorporated distance into the analysis using logistic regression, where \(Y \approx X + D\). Here, \(D\) represents the distance between the gene’s transcription start site (TSS) and SNP, \(X\) indicates whether the SNP-gene pair is actual, and \(Y\) indicates whether the pair is located within the same TAD. Furthermore, we stratified the dataset by genomic distance, ranging from 10 Kb to 250 Kb, and conducted stratified analyses to examine the relationship between these variables.
We applied a similar procedure to compartment domains while analyzing survival-sQTLs and GWAS-sQTLs.
Analysis of cancer tissue-specific FIREs and cancer tissue-specific sQTLs
Lastly, we analyzed whether the Hi-C dataset is tissue-specific. We characterized tissue-specific FIREs as those detected exclusively in specific cancer tissues but not in others. Subsequently, we assessed whether tissue-specific FIREs are enriched near genes and examined their association with tissue-specific sQTLs defined similarly by the CancerSplicingQTL database.
We analyzed whether tissue-specific sQTLs are enriched in tissue-specific FIREs for each cancer tissue. In this enrichment analysis, we partitioned all sQTLs based on whether they overlap with tissue-specific FIREs and whether the sQTL itself is tissue-specific. We calculated the odds ratio, where the numerator is the proportion of tissue-specific sQTLs mapped to tissue-specific FIREs, and the denominator is the proportion of tissue-specific sQTLs mapped to remaining FIREs within the same tissue. Bonferroni-corrected p-values and confidence intervals were calculated at the 95% confidence level (i.e., \(99.375\%\) nominal level, where \(0.99375 = 1 - 0.05/8\)).
Data availability
The Hi-C datasets analyzed during the current study are available in the GSE63525, GSE133928, GSE121601, GSE63525, GSE92819, GSE87585, GSE118629 and GSE117582 repositories. sQTL datasets analyzed during the current study are available in the CancerSplicingQTL database, http://www.cancersplicingqtl-hust.com/. eQTL datasets analyzed during the current study are available in the PancanQTL database, http://bioinfo.life.hust.edu.cn/PancanQTL/. Processed datasets and source code of the analysis in this research are available on https://github.com/seferlab/sqtlhic.
Abbreviations
- 3D:
-
Three Dimensional
- ADGRB2:
-
Adhesion G protein-coupled receptor B2
- ALK:
-
Anaplastic lymphoma kinase
- APC:
-
Adenomatous polyposis coli
- AS:
-
Alternative splicing
- CASP8:
-
Cysteine-aspartic acid protease 8
- CIF:
-
Chromatin interaction frequency
- CML:
-
Chronic Myeloid Leukemia
- COAD:
-
Colon Adenocarcinoma
- CRM:
-
Cis-regulatory modules
- DDR2:
-
Discoidin domain-containing receptor 2
- DNA:
-
Deoxyribonucleic acid
- FPKM:
-
Fragments Per Kilobase of transcript per Million
- eGene:
-
Expression genes
- EGFR:
-
Epidermal growth factor receptor
- ESC:
-
Embryonic stem cell
- eQTL:
-
Expression quantitative trait loci
- FIRE:
-
Frequently Interacting Regions
- GBM:
-
Glioblastoma
- GWAS:
-
Genome-wide association study
- Hi-C:
-
High-throughput chromatin conformation capture
- KRAS:
-
Kirsten rat sarcoma virus
- LAML:
-
Acute Myeloid Leukemia
- LD:
-
Linkage Disequilibrium
- LUAD:
-
Lung Adenocarcinoma
- MM:
-
Multiple Myeloma
- mRNA:
-
Messenger Ribonucleic acid
- PRAD:
-
Prostate Cancer
- p-value:
-
Probability value
- RNA:
-
Ribonucleic acid
- RNA-seq:
-
Ribonucleic acid sequencing
- SARC:
-
Sarcoma
- sGenes:
-
Splicing genes
- SNP:
-
Single nucleotide polymorphisms
- sQTL:
-
Splicing quantitative trait loci
- TAD:
-
Topologically associating domains
- TP53:
-
Tumor Protein 53 Gene
- TSS:
-
Transcription start sites
- XPA:
-
Deoxyribonucleic Acid Damage Recognition And Repair Factor
References
Takata, A., Matsumoto, N. & Kato, T. Genome-wide identification of splicing qtls in the human brain and their enrichment among schizophrenia-associated loci. Nat. Commun. 8, 14519 (2017).
Djebali, S. et al. Landscape of transcription in human cells. Nature 489, 101–8 (2012).
Harrow, J. et al. Gencode: The reference human genome annotation for the encode project. Genome Res. 22, 1760–1774 (2012).
Wang, E. et al. Alternative isoform regulation in human tissue transcriptomes. Nature 456, 470–6 (2008).
Lalonde, E. et al. Rna sequencing reveals the role of splicing polymorphisms in regulating human gene expression. Genome Res. 21, 545–554 (2011).
Yamaguchi, K. et al. Splicing qtl analysis focusing on coding sequences reveals mechanisms for disease susceptibility loci. Nat. Commun. 13, 4659. https://doi.org/10.1038/s41467-022-32358-1 (2022).
Faustino, N. A. & Cooper, T. A. Pre-mrna splicing and human disease. Genes & Dev. 17, 419–437 (2003).
Ge, Y. & Porse, B. T. The functional consequences of intron retention: alternative splicing coupled to nmd as a regulator of gene expression. Bioessays 36, 236–243 (2014).
Florea, L., Song, L. & Salzberg, S. L. Thousands of exon skipping events differentiate among splicing patterns in sixteen human tissues. F1000Research 2, 188 (2013).
Scotti, M. M. & Swanson, M. S. Rna mis-splicing in disease. Nat. Rev. Genet. 17, 19–32 (2016).
Singh, R. K. & Cooper, T. A. Pre-mrna splicing in disease and therapeutics. Trends in molecular medicine 18, 472–482 (2012).
Baralle, D. & Baralle, M. Splicing in action: assessing disease causing sequence changes. J. medical genetics 42, 737–748 (2005).
Sveen, A., Kilpinen, S., Ruusulehto, A., Lothe, R. & Skotheim, R. Aberrant rna splicing in cancer; expression changes and driver mutations of splicing factor genes. Oncogene 35 (2015).
Wang, L. et al. Alternative splicing disrupts a nuclear localization signal in spleen tyrosine kinase that is required for invasion suppression in breast cancer. Cancer Res. 63, 4724–4730 (2003).
Wu, E., Nance, T. & Montgomery, S. B. SplicePlot: a utility for visualizing splicing quantitative trait loci. Bioinformatics 30, 1025–1026 (2013).
Lowe, R., Shirley, N., Bleackley, M., Dolan, S. & Shafee, T. Transcriptomics technologies.. PLOS Comput. Biol. 13, 1–23 (2017).
Patro, R. et al. Parsimonious reconstruction of network evolution. In Algorithms in Bioinformatics, 237–249 (Springer (eds Przytycka, T. M. & Sagot, M.-F.) (Berlin Heidelberg, 2011).
Patro, R. et al. The missing models: a data-driven approach for learning how networks grow. In Proceedings of the 18th ACM SIGKDD International Conference on Knowledge Discovery and Data Mining, KDD ’12, 42–50, https://doi.org/10.1145/2339530.2339541 (Association for Computing Machinery, New York, NY, USA, 2012).
Aguet, F. et al. Genetic effects on gene expression across human tissues. Nature 550, 204–213 (2017).
Gilad, Y., Rifkin, S. A. & Pritchard, J. K. Revealing the architecture of gene regulation: the promise of eqtl studies. Trends Genet. 24, 408–415 (2008).
Sefer, E. & Kingsford, C. Metric labeling and semi-metric embedding for protein annotation prediction. In Research in Computational Molecular Biology, 392–407 (Springer (eds Bafna, V. & Sahinalp, S. C.) (Berlin Heidelberg, 2011).
Patro, R. et al. Parsimonious reconstruction of network evolution. Algorithms for Mol. Biol. 7, 25 (2012).
Trapnell, C. et al. Transcript assembly and quantification by rna-seq reveals unannotated transcripts and isoform switching during cell differentiation. Nat. Biotechnol. 28, 511–515 (2010).
Garrido-Martín, D., Borsari, B., Calvo, M., Reverter, F. & Guigó, R. Identification and analysis of splicing quantitative trait loci across multiple tissues in the human genome. Nat. Commun. 12, 727 (2021).
Sefer, E. Drgat: Predicting drug responses via diffusion-based graph attention network. J. Comput. Biol. 32, 330–350 (2025).
Albert, F. W. & Kruglyak, L. The role of regulatory variation in complex traits and disease. Nat. Rev. Genet. 16, 197–212 (2015).
Brown, C. D., Mangravite, L. M. & Engelhardt, B. E. Integrative modeling of eqtls and cis-regulatory elements suggests mechanisms underlying cell type specificity of eqtls. PLOS Genet. 9, 1–19 (2013).
Heidari, N. et al. Genome-wide map of regulatory interactions in the human genome. Genome Res. 24, 1905–1917 (2014).
Dean, A. In the loop: long range chromatin interactions and gene regulation. Briefings Funct. Genomics 10, 3–10 (2011).
Li, G. et al. Extensive promoter-centered chromatin interactions provide a topological basis for transcription regulation. Cell 148, 84–98 (2012).
Hwang, Y.-C., Zheng, Q., Gregory, B. D. & Wang, L.-S. High-throughput identification of long-range regulatory elements and their target promoters in the human genome. Nucleic Acids Res. 41, 4835–4846 (2013).
Rao, S. S. P. et al. A 3d map of the human genome at kilobase resolution reveals principles of chromatin looping. Cell 159, 1665–1680 (2014).
Lieberman-Aiden, E. et al. Comprehensive mapping of long-range interactions reveals folding principles of the human genome. Science 326, 289–293 (2009).
Jin, F. et al. A high-resolution map of the three-dimensional chromatin interactome in human cells. Nature 503, 290–294 (2013).
Cetin, S. & Sefer, E. A graphlet-based explanation generator for graph neural networks over biological datasets. CURRENT BIOINFORMATICS (2025).
Xiong, K. & Ma, J. Revealing hi-c subcompartments by imputing inter-chromosomal chromatin interactions. Nat. Commun. 10, 5069 (2019).
Dixon, J. R. et al. Topological domains in mammalian genomes identified by analysis of chromatin interactions. Nature 485, 376–380 (2012).
Sefer, E., Duggal, G. & Kingsford, C. Deconvolution of ensemble chromatin interaction data reveals the latent mixing structures in cell subpopulations. J. Comput. Biol. 23, 425–438 (2016) (PMID: 27267775).
Cetin, S. & Sefer, E. The significance of chromosome conformation capture in 3d genome architecture comprehension. Comput. Biol. Chem. 108534 (2025).
Sefer, E. & Kingsford, C. Semi-nonparametric modeling of topological domain formation from epigenetic data. Algorithms for Mol. Biol. 14, 4 (2019).
Duggal, G. et al. Resolving spatial inconsistencies in chromosome conformation measurements. Algorithms for Mol. Biol. 8, 8 (2013).
Sefer, E. Hi-c interaction graph analysis reveals the impact of histone modifications in chromatin shape. Appl. Netw. Sci. 6, 54 (2021).
Sefer, E. Probc: joint modeling of epigenome and transcriptome effects in 3d genome. BMC Genomics 23, 287 (2022).
Duggal, G., Wang, H. & Kingsford, C. Higher-order chromatin domains link eQTLs with the expression of far-away genes. Nucleic Acids Res. 42, 87–96 (2013).
Yu, J., Hu, M. & Li, C. Joint analyses of multi-tissue hi-c and eqtl data demonstrate close spatial proximity between eqtls and their target genes. BMC Genet. 20, 43 (2019).
Das, A. et al. Bayesian integration of genetics and epigenetics detects causal regulatory snps underlying expression variability. Nat. Commun. 6, 8555 (2015).
He, B., Chen, C., Teng, L. & Tan, K. Global view of enhancer-promoter interactome in human cells. Proc. Natl. Acad. Sci. United States Am. 111 (2014).
Ron, G., Globerson, Y., Moran, D. & Kaplan, T. Promoter-enhancer interactions identified from hi-c data using probabilistic models and hierarchical topological domains. Nat. Commun. 8, 2237 (2017).
Tian, J. et al. CancerSplicingQTL: a database for genome-wide identification of splicing QTLs in human cancer. Nucleic Acids Res. 47, D909–D916 (2018).
Schmitt, A. et al. A compendium of chromatin contact maps reveals spatially active regions in the human genome. Cell Reports 17, 2042–2059 (2016).
Johnstone, S. E. et al. Large-scale topological changes restrain malignant progression in colorectal cancer. Cell 182, 1474-1489.e23 (2020).
Johnston, M. J. et al. High-resolution structural genomics reveals new therapeutic vulnerabilities in glioblastoma. Genome Res. 29, 1211–1222 (2019).
Dunham, I. et al. The encode project consortium: An integrated encyclopedia of dna elements in the human genome. 2012. nature 489: 57–74. Nature 489, 57–74 (2012).
Wu, P. et al. 3d genome of multiple myeloma reveals spatial genome disorganization associated with copy number variations. Nat. Commun. 8 (2017).
Rhie, S. K. et al. A high-resolution 3d epigenomic map reveals insights into the creation of the prostate cancer transcriptome. Nat. Commun. 10, 4154 (2019).
Kantidze, O. et al. The anti-cancer drugs curaxins target spatial genome organization. Nat. Commun. 10, 1441 (2019).
Gong, J. et al. PancanQTL: systematic identification of cis-eQTLs and trans-eQTLs in 33 cancer types. Nucleic Acids Res. 46, D971–D976 (2017).
Ay, F., Bailey, T. L. & Noble, W. S. Statistical confidence estimation for hi-c data reveals regulatory chromatin contacts. Genome Res. 24, 999–1011 (2014).
Dixon, J., Gorkin, D. & Ren, B. Chromatin domains: The unit of chromosome organization. Mol. Cell 62, 668–680 (2016).
da Cunha Santos, G., Shepherd, F. A. & Tsao, M. S. Egfr mutations and lung cancer. Annu. Rev. Pathol. Mech. Dis. 6, 49–69 (2011). PMID: 20887192.
Soylu, N. N. & Sefer, E. Deepptm: protein post-translational modification prediction from protein sequences by combining deep protein language model with vision transformers. Curr. Bioinforma. 19, 810–824 (2024).
Westcott, P. M. K. & To, M. D. The genetics and biology of kras in lung cancer. Chin. journal cancer 32, 63–70 (2013).
Terai, H. et al. Characterization of ddr2 inhibitors for the treatment of ddr2 mutated nonsmall cell lung cancer. ACS Chem. Biol. 10, 2687–2696 (2015).
Le, T. & Gerber, D. E. Alk alterations and inhibition in lung cancer. Semin. cancer biology 42, 81–88 (2017).
Sefer, E. Biocode: A data-driven procedure to learn the growth of biological networks. IEEE/ACM Transactions on Comput. Biol. Bioinforma. 19, 3103–3113 (2022).
Eralp, B. & Sefer, E. Reference-free inferring of transcriptomic events in cancer cells on single-cell data. BMC cancer 24, 607 (2024).
Gad, A. A. & Balenga, N. The emerging role of adhesion gpcrs in cancer. ACS pharmacology & translational science 3, 29–42 (2020).
Lu, Y. et al. A gene expression signature predicts survival of patients with stage i non-small cell lung cancer. PLoS medicine 3, e467–e467 (2006).
Ohgaki, H. et al. Apc mutations are infrequent but present in human lung cancer. Cancer Lett. 207, 197–203 (2004).
Liu, D. et al. Caspase 8 polymorphisms contribute to the prognosis of advanced lung adenocarcinoma patients after platinum-based chemotherapy. Cancer biology & therapy 18, 948–957 (2017).
Nora, E. P., Dekker, J. & Heard, E. Segmental folding of chromosomes: A basis for structural and regulatory chromosomal neighborhoods?. BioEssays 35, 818–828 (2013).
Jung, I. et al. A compendium of promoter-centered long-range chromatin interactions in the human genome. Nat. genetics 51, 1442–1449 (2019).
Bryois, J. et al. Evaluation of chromatin accessibility in prefrontal cortex of individuals with schizophrenia. Nat. communications 9, 3121 (2018).
Wainberg, M. et al. Opportunities and challenges for transcriptome-wide association studies. Nat. Genet. 51, 592–599 (2019).
Macauda, A. et al. Expression quantitative trait loci of genes predicting outcome are associated with survival of multiple myeloma patients. Int. J. Cancer 149, 327–336 (2021).
Filippova, D., Patro, R., Duggal, G. & Kingsford, C. Identification of alternative topological domains in chromatin. Algorithms for Mol. Biol. 9, 14 (2014).
Yan, K.-K., Lou, S. & Gerstein, M. Mrtadfinder: A network modularity based approach to identify topologically associating domains in multiple resolutions. PLOS Comput. Biol. 13, 1–22 (2017).
Crowley, C. et al. Firecaller: Detecting frequently interacting regions from hi-c data. Comput. Struct. Biotechnol. J. 19, 355–362 (2021).
Acknowledgements
The author is grateful for the anonymous reviewers’ valuable comments and suggestions.
Funding
This research was funded by TUBITAK (Scientific and Technological Research Council of Turkey) 3501 Project with grant number 122E706.
Author information
Authors and Affiliations
Contributions
B.E. has contributed to the study design, analyzed the data, interpreted the results, prepared the figures, and drafted the manuscript. E.S. has contributed to the study design, interpreted the results, and finalized the manuscript. All authors reviewed the manuscript.
Corresponding author
Ethics declarations
Competing interests
The authors declare no competing interests.
Additional information
Publisher’s note
Springer Nature remains neutral with regard to jurisdictional claims in published maps and institutional affiliations.
Supplementary Information
Rights and permissions
Open Access This article is licensed under a Creative Commons Attribution-NonCommercial-NoDerivatives 4.0 International License, which permits any non-commercial use, sharing, distribution and reproduction in any medium or format, as long as you give appropriate credit to the original author(s) and the source, provide a link to the Creative Commons licence, and indicate if you modified the licensed material. You do not have permission under this licence to share adapted material derived from this article or parts of it. The images or other third party material in this article are included in the article’s Creative Commons licence, unless indicated otherwise in a credit line to the material. If material is not included in the article’s Creative Commons licence and your intended use is not permitted by statutory regulation or exceeds the permitted use, you will need to obtain permission directly from the copyright holder. To view a copy of this licence, visit http://creativecommons.org/licenses/by-nc-nd/4.0/.
About this article

Cite this article
Eralp, B., Sefer, E. Joint analysis of sQTL and Hi-C reveals spatial proximity between sQTLs and target genes in cancer tissues. Sci Rep 15, 37562 (2025). https://doi.org/10.1038/s41598-025-21746-4
Received:
Accepted:
Published:
Version of record:
DOI: https://doi.org/10.1038/s41598-025-21746-4
- Springer Nature Limited