
Abstract
To examine whether hypermetabolism could predict the prognosis of early amyotrophic lateral sclerosis (ALS) patients with differing nutritional profiles. This single-center, retrospective study examined the prognosis of ALS patients with hypermetabolism in relation to their nutritional status at hospitalization. The metabolic state was estimated by the ratio of measured resting energy expenditure (mREE) to lean soft tissue mass (LSTM) (mREE/LSTM), wherein patients with ratios ≥ 38 were defined as hypermetabolic. Malnutrition was defined as %ideal body weight < 0.9. Forty-eight patients were enrolled in this study. The hypermetabolic group had shorter survival in the normal-weight group but more prolonged survival in the malnutrition group. Multiplication of nutritional and metabolic factors, such as [(body mass index (BMI) − 19.8) × (mREE/LSTM − 38)], designated as BMI-muscle metabolism index (BMM index), successfully predicted the prognosis in the group with a high BMM index (≥ 1), which showed shorter survival and a faster rate of weight loss and functional decline. Multivariate analysis using the Cox model showed high BMM index was an independent poor prognostic factor (hazard ratio: 4.05; p = 0.025). Prognostic prediction by hypermetabolism varies depending on the nutritional status in ALS, and the BMM index is a consistent prognostic factor.
Introduction
Amyotrophic lateral sclerosis (ALS) is a fatal neurodegenerative disorder characterized by progressive degeneration of the upper and lower motor neurons, with a median survival time of two to four years1. ALS is caused by diverse pathomechanisms, including genetic defects and dysregulated cellular machinery, such as proteostasis, RNA metabolism, mitochondria, excitotoxicity, and neuroinflammation2,3,4,5. Although disease-modifying drugs are underway, the therapeutic efficacy of currently available drugs––riluzole and edaravone––is unfortunately limited.
Evidence regarding the significance of non-pharmacological treatment is accumulating, indicating that it can improve the quality of life and the progression or survival of ALS. Early introduction of non-invasive positive pressure ventilation (NPPV), especially with cough assist devices, is reported to prolong the lifespan of ALS6. In addition, a lower body mass index (BMI) less than 18.5 at the first visit to the neurologists has been well-recognized as a poor prognostic factor, and a high-calorie diet effectively slows ALS progression, especially in rapid progressors7,8. Surprisingly, in rapidly progressing ALS, a fat-dominant high-calorie diet inhibits the elevation of serum neurofilament-L (NFL), a compelling biomarker of neuronal damage7. Despite these lines of clinical evidence, the mechanism by which the reduction of body weight or the intake of a high-calorie diet confers protection in ALS is not well known.
Previous studies have shown that metabolism and nutritional status play an essential role in the progression of ALS. Hypermetabolism9,10,11, low body fat percentage12, and low fat-free mass13 were poor prognostic factors, as confident as serum creatine phosphokinase (CPK), creatinine, albumin, and ferritin, as previously reported1,3,14,15. Patients with weight loss had shorter survival time, and weight loss also affected functional outcomes after tracheostomy16,17. Although not evident, subthalamic dysfunction, dysregulated autophagy, impaired mitochondrial function, and excitotoxicity4,18 are implicated in the hypermetabolism of ALS patients9, which leads to weight loss19.
Identifying the energy source is essential when analyzing metabolism. ALS patients have impaired glucose tolerance at the early stage, and free fatty acids are higher in such patients than in those with normal glucose tolerance20. It was reported that the energy production pathway changed from glycolytic to lipid metabolism during starvation in ALS mice, in a process called “fuel switch”4. This indicates that lipids may be the primary fuel in patients with malnutrition as well as ALS mice, although no studies examined changes in metabolism in response to the nutritional status of humans. Elevated levels of total cholesterol and low-density lipoprotein cholesterol (LDL), and a higher LDL/ high-density lipoprotein cholesterol (HDL) ratio has been associated with longer survival21,22, which might indicate the benefit of lipid metabolism. Therefore, we retrospectively examined our institutional cohort to test the hypothesis that the impact of hypermetabolism on survival might differ depending on the nutritional status.
Materials and methods
Patients and ethical considerations
This is a single-center retrospective study of ALS patients admitted to Shiga University of Medical Science Hospital from March 2018 to February 2021 for close investigation, the introduction of therapeutic drugs and NPPV, or percutaneous endoscopic gastrostomy (PEG). We collected the data from the first admission in this period. All patients fulfilled the revised El Escorial criteria for probable or definite ALS23 and underwent indirect calorimetry. We excluded patients who were younger than 49 years old, who had used mechanical ventilation, including NPPV, and who had experienced PEG until this admission to avoid the influence of metabolism analysis. This study was approved by the Ethics Committee of Shiga University of Medical Science Hospital (approval no.: R2020-171). We applied Opt-out method and obtained informed consent on this study, which have been performed in accordance with the ethical standards laid down in the 1964 Declaration of Helsinki and its later amendments. The participants have consented to the submission of this study to the journal.
Clinical parameters
Nutritional status was estimated by BMI at this admission, and we calculated the percent ideal body weight (%IBW), using the following formula: %IBW = body weight at this admission/22 × ([patient’s height in meters] ^2). We defined malnutrition as %IBW < 0.9, according to a previous report24. We evaluated the monthly rate of BMI decline since onset to this admission (ΔBMI), using the following formula: (BMI at this admission − premorbid BMI)/(time since onset in months). To assess the disease progression, we calculated the monthly decline rate of the Revised Amyotrophic Lateral Functional Rating Scale (ALSFRS-R) score from onset to this admission (ΔALSFRS-R), using the following formula: (48 − ALSFRS-R at this admission)/(time from onset to this admission in months)25. We also evaluated the following factors: age, sex, body region affected at the onset, excess weight loss (more than 10% compared to the body weight before the illness), and time since the first visit. To assess the influence of treatment on survival time, we collected the data of using NPPV and PEG tube feeding.
Energy metabolism and body composition
We collected data on the resting energy expenditure (REE) and respiratory quotient (RQ), which were measured by indirect calorimetry (Aeromonitor AE310S, Minato Medical Science Co., Ltd.). Indirect calorimetry was performed for 10 min in the morning after the patient had fasted overnight and rested in the supine position on a bed for 30 minutes26. We calculated the RQ as carbon dioxide production divided by oxygen uptake (VCO2/VO2) and calculated the measured REE (mREE; kcal) using the Weir equation without urinary nitrogen27. We estimated the predicted REE (pREE; kcal) via the Harris-Benedict Eq. 28. To evaluate body composition, we collected the data of lean soft tissue mass (LSTM; kg), body fat percentage (%), and skeletal muscle index (SMI; kg/m2), which were measured by bioelectrical impedance analysis with a body composition analyzer (InBody S10; InBody, Tokyo, Japan). The bioelectrical impedance analysis was performed concurrently with the indirect calorimetry.
As for the definition of hypermetabolism, we used mREE/LSTM rather than mREE/pREE9,10 because pREE tends to be overestimated in Japanese people29. Although previous reports used mREE/fat-free mass as a factor associated with hypermetabolism9,30,31, we replaced fat-free mass with LSTM expecting to get a more accurate evaluation of metabolism per lean tissue because LSTM could discriminate lean tissue from bone quantity and be effective for assessing skeletal muscle mass32,33.
We defined hypermetabolism as mREE/LSTM ≥ 38 kcal/kg, considering the percentage of patients with hypermetabolism. The number of patients with mREE/LSTM ≥ 38 was 20/46 (43.4%) in our cohort, while the number of patients with hypermetabolism was 24/58 (41.3%) in the study by Steyn10, which confirmed the validity of the cut-off value. We defined the high body fat percentage as more than 25% in men and 30% in women. For the RQ, we determined the cut-off value as 0.85, because it is 0.7 for fat and 1.0 for carbohydrates34.
Other biomarkers
We collected the following data of respiratory function tests measured by spirometry: %peak expiratory flow (%PEF; %), and %vital capacity (%VC; %). We extracted the following data of blood biomarkers on the day closest to that in which indirect calorimetry was performed: LDL; mg/dl, and fasting blood sugar (FBS; mg/dl). We defined high LDL as LDL ≥ 100 according to a previous report22.
Endpoints
We defined endpoints as the time of death or tracheotomy and survival time as the duration from onset to endpoints or censoring time. The censoring time for the follow-up was the end of February 2021.
Statistical analysis
We classified patients by metabolic status dependent on their nutritional status. We used Fisher’s exact test or Mann–Whitney U test for data comparison between the hypermetabolic group and normally metabolic group depending on nutritional status. To estimate the absolute risks of hypermetabolism on survival depending on nutritional status, we used Kaplan–Meier curves and the log-rank test. Similarly, we determined high mREE/pREE as > 1.19 to validate it as a prognostic factor in different nutritional statuses. Furthermore, excess weight loss, body fat percentage, and LDL were assessed for stratification by using the Kaplan–Meier curves and the log-rank test. Kaplan Myer curves start below 100% survival when the endpoint occurs within one month after this admission. To investigate the association between the demographics and body fat percentage, mREE/LSTM, mREE/pREE, or RQ, we used the Spearman rank-correlation method. Variables are summarized as the median and interquartile range for continuous variables or frequency for categorical variables; missing values were excluded. Statistical analyses were two-sided, and p < 0.05 was considered significant. All analyses were performed by using EZR version 1.53 (Saitama Medical Center, Jichi Medical University, Japan)35. To create figures, we used EZR and Microsoft Excel version 2016.
Result
Clinical characteristics and outcomes
Forty-eight patients were included in this study (25 men; 23 women); body composition data were lacking in two male patients. The median mREE/LSTM of the male group was 35.9 kcal/kg (interquartile range 34.4 to 39.6), and that of the female group was 36.9 kcal/kg (interquartile range 34.5 to 42.3), which were not significantly different (p = 0.50). We classified patients by the metabolic state depending on nutritional status; the clinical profiles of which were summarized in Table 1. Age and sex were not significantly different between the hypermetabolic and normal metabolic groups in the normal-weight group and the malnutrition group. The hypermetabolic normal-weight group had the following characteristics: higher mREE/pREE (p = 0.044), and lower SMI (p = 0.028). On the other hand, the hypermetabolic malnutrition group had a longer time since onset (p = 0.048), higher FBS (p = 0.023), and higher %PEF (p = 0.046).
The log-rank test showed that neither metabolic state nor nutrition state alone was a statistically independent prognostic factor (p = 0.53, p = 0.99, respectively). The hypermetabolic group had a shorter survival time in normal-weight patients (p = 0.009) but showed a trend of longer survival time in the malnutrition group (p = 0.066) (Fig. 1), which was also seen in the log-rank test for time since this admission (Supplemental Fig. 1). Of note, mREE/pREE alone was not a statistically significant prognostic factor among all patients (p = 0.43), the normal-weight group (p = 0.70), or the malnutrition group (p = 0.73) (Supplemental Fig. 2). As for other risk factors, high body fat and excess weight loss were good (p = 0.004) and poor (p < 0.001) prognostic factors for survival time (Fig. 2). Patients with low LDL had a propensity toward shorter survival, although the difference was not significant (p = 0.063). In the log-rank test for the survival time since this admission, patients with excess weight loss (p = 0.007) and low LDL (p < 0.001) had shorter survival, and patents with low body fat showed similar trend (p = 0.106) (Supplemental Fig. 3).
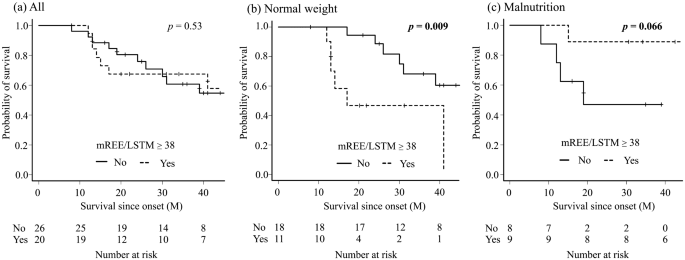
Comparison of survival rate between the hypermetabolic group and the normal metabolic group in all patients (a), the normal-weight group (b), the malnutrition group (c). Kaplan–Meier analyses and the log-rank test showed there was no difference in all patients (p = 0.53); however, the hypermetabolic group had a significantly shorter survival time in the normal-weight group (p = 0.009) and longer survival time in the malnutrition group (p = 0.066), although the difference was not significant.
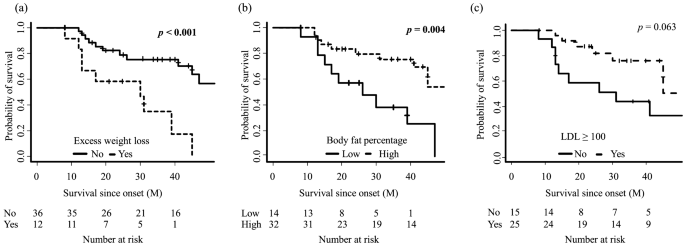
Comparison of survival rate between amyotrophic lateral sclerosis patients stratified by excess weight loss (a), body fat percentage (b), and low-density lipoprotein cholesterol (LDL) (c). Kaplan–Meier analyses and the log-rank test showed patients with excess weight loss (p < 0.001) and low body fat percentage (p = 0.004) had significantly shorter survival time. Patients with low LDL also had shorter survival time, although the difference was not significant (p = 0.063).
We examined demographics associated with RQ, mREE/LSTM, mREE/pREE, or body fat percentage. RQ was associated with ALSFRS-R (p = 0.013), time since onset (p = 0.003), body fat percentage (p = 0.017), and LSTM (p = 0.022) (Fig. 3). mREE/LSTM was positively associated with body fat percentage (rs = 0.36, p = 0.015), and negatively with BMI (rs = − 0.29, p = 0.048), and LSTM (rs = − 0.46, p = 0.002) (Supplemental Fig. 4). mREE/pREE was positively associated with LSTM (rs = 0.44, p = 0.002), and negatively with body fat percentage (rs = − 0.42, p = 0.004). mREE/pREE was not associated with BMI (rs = 0.00, p = 0.99). Body fat percentage was positively correlated with BMI (rs = 0.38, p = 0.009) and negatively with LSTM (rs = − 0.54, p < 0.001).

The association between demographics and respiratory quotient (RQ). RQ was significantly correlated with ALSFRS-R (a), lean soft tissue mass (b), body fat percentage (c), and time since onset (d). Rs means Spearman’s rank-correlation coefficient. p value is based on Spearman’s test.
BMM index
The discrepant trends in survival times between the hypermetabolic patients in the normal-weight and malnutrition groups led us to estimate the influence of hypermetabolism on survival and nutritional status. We tried to obtain the new evaluation plan named “BMI-muscle metabolism (BMM) index” via the following equation: (BMI − 19.8) × (mREE/LSTM − 38). We subtracted 19.8 from BMI because %IBW < 0.9 means BMI < 19.8. Since a BMI of 19.8 and a mREE/LSTM of 38 are normal values, the BMM index increases when both are more or less than average. We thus tested whether a high BMM index predicted a poor prognosis.
We determined the cut-off value of BMM Index with time-dependent receiver operating characteristic (ROC) curves36, which confirmed that the BMM index predicted the incidence of endpoints within two years from the onset (AUC = 0.82), with a sensitivity of 0.77, and a specificity of 0.88 when the BMM index was higher than one (Fig. 4). Therefore, we determined the cut-off value of the BMM index as one and classified patients by this cut-off value into two groups. We used Fisher’s exact test and the Mann–Whitney U test to compare the two groups and summarized demographics and biomarkers (Table 2).

The prognostic value of BMI-muscle metabolism index (BMM Index). Patients who died or underwent tracheostomy within 24 months from onset are presented as red circles, and the remaining patients are presented as black circles (a). The shaded area shows the body mass index-muscle metabolism (BMM) index ≥ 1 (a). Time-dependent receiver operating characteristic curve analysis shows that the BMM index strongly predicts the incidence of endpoints within two years from the onset (area under the curve = 0.82) (b).
In the high BMM index group, ΔALSFRS-R (p = 0.003) and ΔBMI (p = 0.004) were higher and lower than that in the low BMM index group, respectively. Regarding biomarkers, the high BMM index group had lower LDL (p = 0.011) and lower %VC (p = 0.002) compared with those of the low BMM index group. The Kaplan–Meier analysis and log-rank test revealed that the high BMM index group had significantly shorter survival time compared with that of the low BMM index group (p < 0.001) (Fig. 5). To examine the effect of the BMM index on the survival time since onset or this admission, we performed Cox proportional hazards (PH) model with the following confounding factors: age, ALSFRS-R, bulbar type, excess weight loss, high BMM Index, and %VC. Multivariate analysis showed BMM index and excess weight loss were independent poor prognostic factors (Table 3).

Comparison of survival rate between amyotrophic lateral sclerosis patients stratified by body mass index-muscle metabolism index (BMM index). The Kaplan–Meier analysis showed significant differences (log-rank test, p < 0.001).
Discussion
In this study we explored the effect of hypermetabolism on survival relative to the nutritional status of patients with ALS, and found that hypermetabolic patients with a normal-weight had shorter survival, whereas survival was longer in hypermetabolic patients with malnutrition. Of note, Steyn10 and He11 reported that hypermetabolism is a clear predictor of poor prognosis, and Bouteloup9 demonstrated similar results, although it was not statistically significant. Based on our results, the possible reason to explain these different statistics might be because the mean value of BMI in the Steyn paper was higher than that of the Bouteloup. The lower SMI and LSTM, a previously reported poor prognostic factor13 (Table 1), could be the reason the prognosis of our hypermetabolic normal-weight group is worse than that of other groups.
Surprisingly, hypermetabolism was a better prognostic factor in the malnutrition group (Fig. 1). Lipid biomarkers were characteristic in this group, which might contribute to the longer survival. The hypermetabolic malnutrition group had the highest median value of LDL among all the groups, and higher body fat percentage, which were good prognostic factors in previous studies. Indeed, patients with a high body fat percentage had longer survival in our study (Fig. 2), and the patients with high LDL showed a similar trend. It should be noted that the RQ was less than 0.85 in eight out of nine patients in this group (Table 1), and FBS was significantly higher in this group, which might indicate a lipid metabolism-shift from glucose assumption34. Indeed, the RQ was associated with ALSFRS-R and time since onset, and it is intriguing to hypothesize that a “fuel switch” may underlie metabolic profiles in ALS progression4. Furthermore, Steyn et, al. reported that high elevated fatty-acid oxidation increases whole-body energy expenditure and slows disease progression 37, which might support our results and indicate the contribution of hyper lipid metabolism for longer survival. Our findings caution against overestimation of hypermetabolism alone as a prognosis indicator.
Based on the possible involvement of skeletal muscles’ hypermetabolism in ALS prognosis9,10, we proposed the equation “BMM index = (BMI − 19.8) × (mREE/LSTM − 38),” which successfully predicted the prognostic factor, regardless of nutritional states. In agreement with a previous report38, our cohort demonstrated that weight loss of more than 10% was an independent poor prognostic factor. The rate of weight loss was faster in the high BMM index group; thus, the BMM index could be a valuable indicator to consider aggressive nutritional intervention, including PEG, at an early stage in clinical practice. High-fat or high-carbohydrate calorie supplementation is a matter of debate. Some reports suggested that high-fat calorie supplementation was a better nutritional treatment in ALS patients39,40, while others recommend high-carbohydrate calorie supplementation41. For patients with chronic obstructive pulmonary disease who have impaired CO2 emissions, a high-fat diet is recommended because lipid metabolism produces less carbon dioxide. Based on our result that lipid-shift trend might contribute a better prognosis, a high-fat intake could be an attractive option in a high-calorie diet for ALS. Of course, the choice of nutrition must be cautiously made, depending on the patients’ metabolic profiles.
The definition we adopted for hypermetabolism is a high mREE/LSTM, rather than the popular global index, mREE/pREE, because pREE estimated by the Harris-Benedict equation is reportedly not appropriate for the metabolic assessment of Japanese persons29. In our study, mREE/pREE positively correlated with LSTM, and thus mREE/pREE might be underestimated in patients with lower LSTM. Indeed, mREE/pREE was not found to be a beneficial prognostic factor in this study (Supplemental Fig. 2), contrary to previous reports9,10. On the other hand, mREE/LSTM was also negatively associated with LSTM in this study, which may cause overestimation of mREE/LSTM in patients with lower LSTM. However, high mREE/LSTM could reflect hypermetabolism more accurately than mREE/pREE in our cohort because mREE/LSTM was a poor prognostic factor in the normal-weight group, which was consistent with the previously reported fact that hypermetabolism was a poor prognostic factor9,10. There is no universally accepted index for assessing hypermetabolism, and mREE/LSTM may be a useful index for metabolic assessment in the Japanese population.
This study has several limitations. One is the small sample size; each nutritional group had a small number of patients. Second, this study is a retrospective study and included only Japanese patients in a single-center. The definition of malnutrition and hypermetabolism may be different in other countries, and it is not clear whether the prognostic prediction from mREE/LSTM depends on %IBW in other countries and this study. Adjusting the reference value of mREE/LSTM and BMI might make the BMM index more universally available. Of note, there are few studies on prognostic models for ALS in Asia, and this study is precious42. Third, we included patients at different stages with different reasons, such as close investigation, the introduction of therapeutic drugs and NPPV, and PEG. The validation of the timing of the BMM index in the clinical course is also required. Fourth, we did not perform a genetic test in most cases. Only one patient had the L106V mutation in the superoxide dismutase 1 (SOD1) gene, and this patient was in the hypermetabolic and normal-weight group and had a very high BMM index. The patient indeed showed a rapid progression. The relationship between genetic mutation and BMM index needs to be investigated in the future.
This is the first study to show that prognosis prediction by hypermetabolism varies depending on the nutrition status in patients with early ALS. The BMM index is a useful predictor of the prognosis, which could be referred to as the decision of interventions, such as PEG and NPPV, at an early stage to patients with a high BMM index.
Data availability
The datasets generated during and/or analysed during the current study are available from the corresponding author on reasonable request.
References
Chiò, A. et al. Amyotrophic lateral sclerosis outcome measures and the role of albumin and creatinine: A population-based study. JAMA Neurol. 71, 1134–1142. https://doi.org/10.1001/jamaneurol.2014.1129 (2014).
Shepheard, S. R. et al. Value of systematic genetic screening of patients with amyotrophic lateral sclerosis. J. Neurol. Neurosurg. Psychiatry https://doi.org/10.1136/jnnp-2020-325014 (2021).
Lu, C. H. et al. Systemic inflammatory response and neuromuscular involvement in amyotrophic lateral sclerosis. Neurol. Neuroimmunol. Neuroinflamm. 3, e244. https://doi.org/10.1212/NXI.0000000000000244 (2016).
Ferri, A. & Coccurello, R. What is “Hyper” in the ALS hypermetabolism?. Mediat. Inflamm. 2017, 7821672. https://doi.org/10.1155/2017/7821672 (2017).
Mandrioli, J. et al. Proteostasis and ALS: Protocol for a phase II, randomised, double-blind, placebo-controlled, multicentre clinical trial for colchicine in ALS (Co-ALS). BMJ Open 9, e028486. https://doi.org/10.1136/bmjopen-2018-028486 (2019).
Khamankar, N., Coan, G., Weaver, B. & Mitchell, C. S. Associative increases in amyotrophic lateral sclerosis survival duration with non-invasive ventilation initiation and usage protocols. Front. Neurol. 9, 578. https://doi.org/10.3389/fneur.2018.00578 (2018).
Dorst, J. et al. Effect of high-caloric nutrition on serum neurofilament light chain levels in amyotrophic lateral sclerosis. J. Neurol. Neurosurg. Psychiatry 91, 1007–1009. https://doi.org/10.1136/jnnp-2020-323372 (2020).
Ludolph, A. C. et al. Effect of high-caloric nutrition on survival in amyotrophic lateral sclerosis. Ann. Neurol. 87, 206–216. https://doi.org/10.1002/ana.25661 (2020).
Bouteloup, C. et al. Hypermetabolism in ALS patients: An early and persistent phenomenon. J. Neurol. 256, 1236–1242. https://doi.org/10.1007/s00415-009-5100-z (2009).
Steyn, F. J. et al. Hypermetabolism in ALS is associated with greater functional decline and shorter survival. J. Neurol. Neurosurg. Psychiatry 89, 1016–1023. https://doi.org/10.1136/jnnp-2017-317887 (2018).
He, J. et al. Hypermetabolism associated with worse prognosis of amyotrophic lateral sclerosis. J. Neurol. https://doi.org/10.1007/s00415-021-10716-1 (2021).
Marin, B. et al. Alteration of nutritional status at diagnosis is a prognostic factor for survival of amyotrophic lateral sclerosis patients. J. Neurol. Neurosurg. Psychiatry 82, 628–634. https://doi.org/10.1136/jnnp.2010.211474 (2011).
Kirk, S. E., Tracey, T. J., Steyn, F. J. & Ngo, S. T. Biomarkers of metabolism in amyotrophic lateral sclerosis. Front. Neurol. 10, 191. https://doi.org/10.3389/fneur.2019.00191 (2019).
Gibson, S. B. et al. Relationship of creatine kinase to body composition, disease state, and longevity in ALS. Amyotroph. Lateral Scler. Frontotemporal Degener. 16, 473–477. https://doi.org/10.3109/21678421.2015.1062516 (2015).
Ikeda, K., Hirayama, T., Takazawa, T., Kawabe, K. & Iwasaki, Y. Relationships between disease progression and serum levels of lipid, urate, creatinine and ferritin in Japanese patients with amyotrophic lateral sclerosis: A cross-sectional study. Intern. Med. 51, 1501–1508. https://doi.org/10.2169/internalmedicine.51.7465 (2012).
Janse van Mantgem, M. R. et al. Prognostic value of weight loss in patients with amyotrophic lateral sclerosis: A population-based study. J. Neurol. Neurosurg. Psychiatry 91, 867–875. https://doi.org/10.1136/jnnp-2020-322909 (2020).
Nakayama, Y. et al. Body weight variation predicts disease progression after invasive ventilation in amyotrophic lateral sclerosis. Sci. Rep. 9, 12262. https://doi.org/10.1038/s41598-019-48831-9 (2019).
Edens, B. M., Miller, N. & Ma, Y. C. Impaired autophagy and defective mitochondrial function: Converging paths on the road to motor neuron degeneration. Front. Cell Neurosci. 10, 44. https://doi.org/10.3389/fncel.2016.00044 (2016).
Shimizu, T. et al. The measurement and estimation of total energy expenditure in Japanese patients with ALS: A doubly labelled water method study. Amyotroph. Lateral Scler. Frontotemporal Degener. 18, 37–45. https://doi.org/10.1080/21678421.2016.1245756 (2017).
Pradat, P. F. et al. Impaired glucose tolerance in patients with amyotrophic lateral sclerosis. Amyotroph. Lateral Scler. 11, 166–171. https://doi.org/10.3109/17482960902822960 (2010).
González De Aguilar, J. L. Lipid biomarkers for amyotrophic lateral sclerosis. Front. Neurol. 10, 284. https://doi.org/10.3389/fneur.2019.00284 (2019).
Ingre, C. et al. Lipids, apolipoproteins, and prognosis of amyotrophic lateral sclerosis. Neurology 94, e1835–e1844. https://doi.org/10.1212/WNL.0000000000009322 (2020).
Brooks, B. R., Miller, R. G., Swash, M., Munsat, T. L. & Diseases, W. F. O. N. R. G. O. M. N. El Escorial revisited: revised criteria for the diagnosis of amyotrophic lateral sclerosis. Amyotroph. Lateral Scler. Other Motor Neuron Disord. 1, 293–299, https://doi.org/10.1080/146608200300079536 (2000).
Palange, P. et al. Nutritional state and exercise tolerance in patients with COPD. Chest 107, 1206–1212. https://doi.org/10.1378/chest.107.5.1206 (1995).
Cedarbaum, J. M. et al. The ALSFRS-R: A revised ALS functional rating scale that incorporates assessments of respiratory function. BDNF ALS Study Group (Phase III). J. Neurol. Sci. 169, 13–21. https://doi.org/10.1016/s0022-510x(99)00210-5 (1999).
Takaoka, A. et al. Comparison of energy metabolism and nutritional status of hospitalized patients with Crohn’s disease and those with ulcerative colitis. J. Clin. Biochem. Nutr. 56, 208–214. https://doi.org/10.3164/jcbn.14-95 (2015).
Weir, J. B. New methods for calculating metabolic rate with special reference to protein metabolism. J. Physiol. 109, 1–9. https://doi.org/10.1113/jphysiol.1949.sp004363 (1949).
Harris, J. A. & Benedict, F. G. A biometric study of human basal metabolism. Proc. Natl. Acad. Sci. U. S. A. 4, 370–373. https://doi.org/10.1073/pnas.4.12.370 (1918).
Miyake, R. et al. Validity of predictive equations for basal metabolic rate in Japanese adults. J. Nutr. Sci. Vitaminol. (Tokyo) 57, 224–232. https://doi.org/10.3177/jnsv.57.224 (2011).
Desport, J. C. et al. Factors correlated with hypermetabolism in patients with amyotrophic lateral sclerosis. Am. J. Clin. Nutr. 74, 328–334. https://doi.org/10.1093/ajcn/74.3.328 (2001).
Piche, T. et al. Resting energy expenditure in chronic hepatitis C. J. Hepatol. 33, 623–627. https://doi.org/10.1034/j.1600-0641.2000.033004623.x (2000).
Chen, Z. et al. Dual-energy X-ray absorptiometry is a valid tool for assessing skeletal muscle mass in older women. J. Nutr. 137, 2775–2780. https://doi.org/10.1093/jn/137.12.2775 (2007).
Costa, R. F. D., Masset, K. V. D. S., Silva, A. M., Cabral, B. G. A. T. & Dantas, P. M. S. Development and cross-validation of predictive equations for fat-free mass and lean soft tissue mass by bioelectrical impedance in Brazilian women. Eur. J. Clin. Nutr. https://doi.org/10.1038/s41430-021-00946-x (2021).
McClave, S. A. et al. Clinical use of the respiratory quotient obtained from indirect calorimetry. JPEN J. Parenter. Enteral Nutr. 27, 21–26. https://doi.org/10.1177/014860710302700121 (2003).
Kanda, Y. Investigation of the freely available easy-to-use software ‘EZR’ for medical statistics. Bone Marrow Transplant. 48, 452–458. https://doi.org/10.1038/bmt.2012.244 (2013).
Heagerty, P. J., Lumley, T. & Pepe, M. S. Time-dependent ROC curves for censored survival data and a diagnostic marker. Biometrics 56, 337–344. https://doi.org/10.1111/j.0006-341x.2000.00337.x (2000).
Steyn, F. J. et al. Altered skeletal muscle glucose-fatty acid flux in amyotrophic lateral sclerosis. Brain Commun. 2, fcaa154. https://doi.org/10.1093/braincomms/fcaa154 (2020).
Shimizu, T. et al. Prognostic significance of body weight variation after diagnosis in ALS: A single-centre prospective cohort study. J. Neurol. 266, 1412–1420. https://doi.org/10.1007/s00415-019-09276-2 (2019).
Fitzgerald, K. C. et al. Dietary ω-3 polyunsaturated fatty acid intake and risk for amyotrophic lateral sclerosis. JAMA Neurol. 71, 1102–1110. https://doi.org/10.1001/jamaneurol.2014.1214 (2014).
Veldink, J. H. et al. Intake of polyunsaturated fatty acids and vitamin E reduces the risk of developing amyotrophic lateral sclerosis. J. Neurol. Neurosurg. Psychiatry 78, 367–371. https://doi.org/10.1136/jnnp.2005.083378 (2007).
Wills, A. M. et al. Hypercaloric enteral nutrition in patients with amyotrophic lateral sclerosis: A randomised, double-blind, placebo-controlled phase 2 trial. Lancet 383, 2065–2072. https://doi.org/10.1016/S0140-6736(14)60222-1 (2014).
Xu, L. et al. Prognostic models for amyotrophic lateral sclerosis: A systematic review. J. Neurol. https://doi.org/10.1007/s00415-021-10508-7 (2021).
Funding
This study is supported by an intramural research fund at Shiga University of Medical Science.
Author information
Authors and Affiliations
Contributions
R.N. and M.U. designed research, analyzed data, and wrote manuscript. M.S., A.K., I.Y., N.O. analyzed data, M.K. and M.S. measured RQ and REE, and analyzed data. All authors reviewed the manuscript.
Corresponding author
Ethics declarations
Competing interests
The authors declare no competing interests.
Additional information
Publisher's note
Springer Nature remains neutral with regard to jurisdictional claims in published maps and institutional affiliations.
Supplementary Information
Rights and permissions
Open Access This article is licensed under a Creative Commons Attribution 4.0 International License, which permits use, sharing, adaptation, distribution and reproduction in any medium or format, as long as you give appropriate credit to the original author(s) and the source, provide a link to the Creative Commons licence, and indicate if changes were made. The images or other third party material in this article are included in the article's Creative Commons licence, unless indicated otherwise in a credit line to the material. If material is not included in the article's Creative Commons licence and your intended use is not permitted by statutory regulation or exceeds the permitted use, you will need to obtain permission directly from the copyright holder. To view a copy of this licence, visit http://creativecommons.org/licenses/by/4.0/.
About this article

Cite this article
Nakamura, R., Kurihara, M., Ogawa, N. et al. Prognostic prediction by hypermetabolism varies depending on the nutritional status in early amyotrophic lateral sclerosis. Sci Rep 11, 17943 (2021). https://doi.org/10.1038/s41598-021-97196-5
Received:
Accepted:
Published:
DOI: https://doi.org/10.1038/s41598-021-97196-5
- Springer Nature Limited