
Abstract
Unvegetated, intertidal sandflats play a critical role in estuarine carbon and nutrient dynamics. However, these ecosystems are under increasing threat from anthropogenic stressors, especially nitrogen enrichment. While research in this area typically focuses on sediment-water exchanges of carbon and nutrients during tidal inundation, there remain significant gaps in our understanding of GHG (Greenhouse Gas) fluxes during tidal emergence. Here we use in situ benthic chambers to quantify GHG fluxes during tidal emergence and investigate the impact of nitrogen enrichment on these fluxes. Our results demonstrate significant differences in magnitude and direction of GHG fluxes between emerged and submerged flats, demonstrating the importance of considering tidal state when estimating GHG emissions from intertidal flats. These responses were related to differences in microphytobenthic and macrofaunal activity, illustrating the important role of ecology in mediating fluxes from intertidal flats. Our results further demonstrate that nitrogen enrichment of 600 gN m−2 was associated with, on average, a 1.65x increase in CO2 uptake under light (photosynthetically active) conditions and a 1.35x increase in CO2 emission under dark conditions, a 3.8x increase in CH4 emission and a 15x increase in N2O emission overall. This is particularly significant given the large area intertidal flats cover globally, and their increasing exposure to anthropogenic stressors.
Introduction
Unvegetated soft sediment habitats have been shown to play a critical role in carbon and nutrient dynamics within estuaries and the coast1,2,3,4. These habitats are estimated to accumulate over 740,000 tonnes of carbon each year5, making significant contributions to reducing global carbon emissions. However, these ecosystems are under increasing threat due to stressors such as elevated nutrient loading sourced from anthropogenic activities such as agriculture and urbanization6,7,8.
Empirical measurements of fluxes on intertidal flats and the influence of nutrient enrichment on those fluxes have typically focused on the sediment-water column exchange of carbon and nutrients during tidal inundation (e.g.2,3,9,10). These submerged fluxes are subsequently used to infer fluxes during tidal emergence, either explicitly (e.g.5) or implicitly (e.g.1). However, key drivers that influence GHG (greenhouse gas) fluxes (specifically CO2, CH4, and N2O) on intertidal flats change significantly between tidal inundation and emergence, such as the benthic light climate11, temperature12, oxygen dynamics12,13, and macrofaunal activity14,15. If these drivers result in differences in GHG fluxes between submerged and emerged periods, upscaling from submerged fluxes to the full tidal cycle may result in inaccurate accounting of GHG budgets due to under- or over-estimates. Further uncertainties in GHG budgets for unvegetated intertidal flats occur due to the lack of understanding of the influence of nutrient enrichment on these habitats during tidal emergence, which could drive further differences in fluxes between submerged and emerged conditions.
The impact of nitrogen enrichment on estuaries is expected to worsen in the coming years (e.g.7,16,17). Consequently, reducing the uncertainty of estimates of the impact of nutrient enrichment on the flux of GHGs is an integral part of accurately quantifying GHG emissions from emerged intertidal flats. Here we investigate the impact of nutrient enrichment on GHG fluxes from emerged intertidal flats by manipulating sediment nutrient concentrations for several months at five sites on the North Island, New Zealand which vary in environmental characteristics. Three sites were selected in the Whangarei Harbour, with two sites in the Whangateau Harbour and the Raglan Harbour. Having three sites along an environmental gradient in the Whangarei Harbour allowed generalisations to be made for one estuary, while having a further two sites in different estuaries provided information on whether those generalisations could be applied to different estuaries. Further, we compare these values to data collected by other researchers during tidal submergence, to improve our understanding of how tidal state may impact GHG fluxes on intertidal flats.
We hypothesised nutrient enrichment will increase the emission of CO2, CH4 and N2O. We also hypothesised that that the flux of greenhouse gases from unvegetated intertidal flats will differ between periods of tidal emergence and periods of tidal submergence.
Methods
Study sites
Five sites across three estuaries were selected to span a range of environmental conditions (e.g. sediment mud content, organic matter content, chlorophyll concentrations, and macrofaunal community composition). Three of these sites were in the Whangarei Harbour, one was in the Raglan Harbour, and one was in the Whangateau Harbour (Fig. 1).
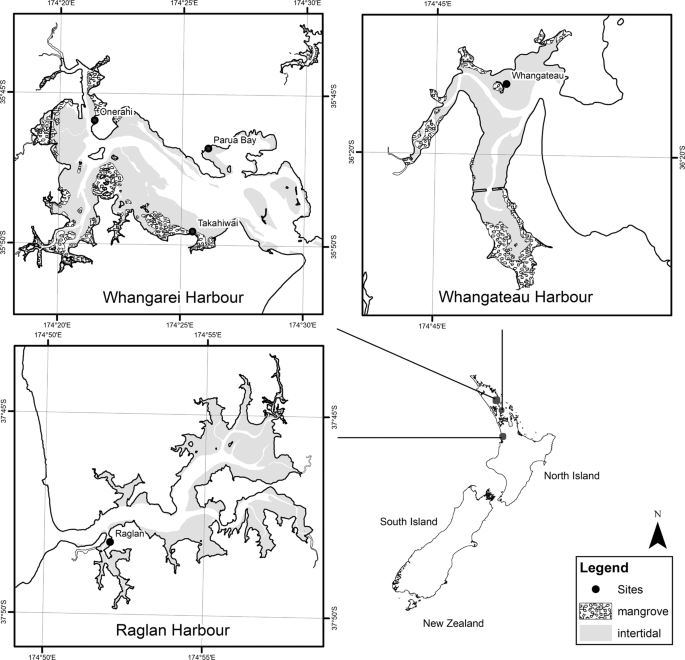
Study sites on the Whangarei, Whangateau, and Raglan Harbours in northern New Zealand.
Whangarei Harbour is a large, unstratified estuary over 20 km long, covering an area of 104 km2 18,19 and with a catchment area of 229 km2 20. Mean depth in the harbour is 4.42 m21, with a mean tidal range of 1.73 m18. Approximately 28% of the harbour flushes each tide, and about half (54 km2) of the harbour area is intertidal20,21. Approximately two thirds of the intertidal area is composed of unvegetated, intertidal flats, with the remainder being mangrove forest and seagrass meadows, both of which have expanded in recent decades22,23. Land use in the catchment varies, with high proportions of pastoral agriculture and plantation forestry alongside urban areas and areas of native vegetation20.
Whangateau Harbour is a shallow estuary of approximately 9.2 km2, with little freshwater input24. The harbour has a high flushing rate, with up to 99% of the water being exchanged with each tide24, and 85% of the harbour is composed of intertidal flats25. The spring tidal range of the harbour is 2.2 m26. The harbour has a small catchment (~ 40 km2 in area), comprised primarily of native forest, but with areas of plantation forestry, livestock agriculture, horticulture, and urban use26.
Raglan Harbour is a drowned river valley of approximately 33 km2 area, of which ~70% is intertidal. The harbour has a maximum depth of 18 m, although channel depths closer to 5 m are more common. Raglan Harbour has a neap tidal range of 1.8 m and a spring tidal range of 2.8 m with 50–75% of the volume of the Harbour being exchanged each tidal cycle (at neap and spring tides respectively). The catchment is large (165 km2), and is dominated by agriculture and plantation forestry which have historically resulted in large inputs of sediment, with small areas of native forest and urban areas27.
Nitrogen enrichment treatments
At each site, three nutrient enrichment treatments were performed: a high N treatment (600 g N m−2), a low N treatment (150 g N m−2), and a control with no enrichment. The application method and treatment doses were based on a previously tested method of nitrogen enrichment in New Zealand intertidal flats, which successfully resulted in long term nitrogen enrichment at treated sites for periods of >6 months28,29. Nitrogen fertiliser was placed in twenty 5 ×15 cm deep cores per m2, using a controlled-release, nitrogen-only, urea fertiliser (with no potassium, phosphorous, or trace elements). Fertiliser was inserted at a depth of 15 cm, with sediment cores removed, fertiliser added, and sediment returned to fill the remainder of the hole created by the core. This enrichment procedure was carried out 6 months prior to GHG flux measurements, in order to avoid impacts of the physical disturbance effects of enrichment and to measure the effect of chronic nutrient enrichment on those fluxes, which have been observed to occur at 3–6 months post nutrient enrichment using the same methodology29.
Each treatment plot was 3 × 3 m in area, and plots were separated by at least 3 m from any other plot within each replicate block (Fig. 2). Treatments were replicated three times at each site in a randomized block design, for a total of nine plots per site. Replicate blocks were situated 10–15 m apart. All plots were located at similar tidal heights (approximately four hours of tidal emergence), with distances in tidal height between treatment plots negligible relative to the tidal range. Measurements carried out using static chambers in Light/Dark pairs separated by 0.2 m within each plot (for a total of 18 benthic chambers per site) and were at least 1 m from plot edges to minimise edge effects across the edge of treatment plots. Chambers were arranged in Light/Dark pairs to capture respiration rates (dark chambers) and the impact of photosynthesis/production (light chambers) on GHG emissions.
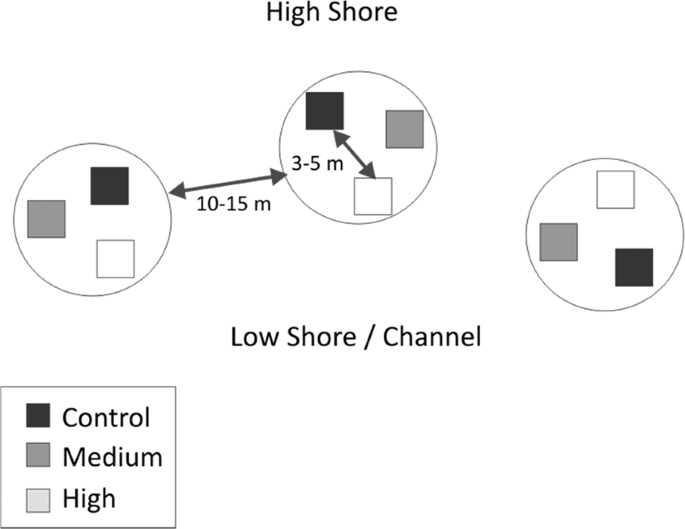
Example site layout of three replicate nutrient enrichment treatments. High Shore and Low Shore/Channel indicate proximity to terrestrial habitats, and toward open water, respectively.
Nutrient enrichment at all sites was performed in April 2017, followed by sampling of GHG fluxes in November and early December 2017. Two of the five sites (Raglan and Whangateau) were re-treated with nitrogen fertiliser in December 2017, and a second round of sampling was carried out at these sites (and in the control treatments of the three sites in Whangarei) in June and July 2018 to investigate seasonal variation in GHG fluxes.
Greenhouse gas flux measurement
GHG fluxes across the sediment-atmospheric interface were measured using 30 L, 0.25 m2 airtight benthic chambers. The measurement chambers were arranged in Light and Dark pairs, with one chamber having a clear lid and one an opaque lid. As soon as the receding tide exposed the study site, chambers were pushed 7 cm into the sediment. After approximately 10 minutes, the lids (and dark covers for dark chambers) were attached and sealed, and 10 minutes after that the first gas sample was taken. The 20 minute period between chamber placement and the start of flux measurements was chosen as a result of a preliminary experiment for this study30. As part of that experiment, the fluxes of GHGs were measured several times throughout the period of emergence at two sites with different environmental conditions, in order to determine the necessary sampling period for this study. The same light/dark paired in situ benthic chamber methods were used as those in this study, but with six gas samples collected from each chamber at approximately 25 minute intervals, instead of only collecting initial and final gas samples. This preliminary experiment showed no evidence of a large initial flux, with the flux of CO2 and CH4 over the first sampling period similar to that in the second and third period for each site, except for the CO2 flux in the light chambers at Onerahi. This provided strong evidence that there was not a high initial flux of GHGs in the chambers resulting from the physical disturbance of placing the chambers in the sediment, as any impact from this disturbance would have been expected across all treatments at all sites. Consequently, a 20-minute delay between the disturbance of placing the chamber and taking the initial measurement was used as a precaution but was considered adequate.
Initial 900 mL gas samples were collected from the chambers within ten minutes of sealing the chambers and stored in Tedlar bags. A final 900 mL gas sample was collected from each chamber immediately prior to tidal submergence at the site. The two samples in combination accounted for approximately 6% of the total 30 L volume of the measurement chamber. The period between the initial and final sampling of gases in the chambers ranged from 2–4 hours in length, depending on the magnitude of the tide, and the presence or absence of wind-driven waves that influenced the duration of tidal emergence/submergence.
Samples were kept in dark, insulated bins at ambient temperature and transported to the University of Auckland laboratory facilities for analysis. Gas samples were analysed within 24 hours of collection, using a Picarro G2508 Gas Analyser to determine the concentration of N2O, CO2, and CH4 gas in the samples. The detection and accuracy limits of the Picarro analyser are listed in the Supplementary Information.
The samples were collected twice for at each site, once in November/December 2017 for all nutrient enrichment treatments, and once in June/July 2018 for all enrichment treatments at the Whangateau and Raglan sites and for the Control treatment at the three sites in Whangarei. More regular sampling was not feasible, in part due to the unavoidable physical disturbance of sampling. It is likely that this disturbance, if it occurred more regularly, would influence the processes at those sites31, altering the fluxes and potentially obscuring the effect of prolonged nutrient enrichment on GHG fluxes.
Flux calculations
Gas concentration measurements from the Picarro Gas Analyser were given in molar parts per million (ppm). To convert this to a standard gas flux (µmol m−2 hr−1), the Ideal Gas Law was used, calculating the molar concentration of a gas at the start and end of the gas sampling and the consequent change over time (Eq. 1).
where G = concentration of a given GHG in the chamber at the start (I) and end (F) of the measurement (ppm); P = atmospheric pressure at the start (I) and end (F) of the measurement (atmosphere); V = volume of gas in the chamber (L); R = Ideal Gas Constant of 0.0821 L atm mol−1 K−1; T = temperature in the chamber at the start (I) and end (F) of the measurement (K); A = area of sediment covered by chamber (m2); and Δt = time between the start and end of the measurement (hours).
Site characteristics
While there are a multitude of environmental variables that may drive variation in the flux of GHGs, the following variables were selected with the aim of explaining the greatest possible proportion of variation in GHG fluxes with the limited resources available.
Temperature inside the chambers was recorded by 1-Wire i-button DS1921G-F5# automated loggers, located 10 cm from the edge of the chamber and 2 cm above the sediment surface. Photosynthetically Active Radiation (PAR) intensity was measured using two Odyssey Submersible PAR Loggers at each site.
Composite samples of five 2 cm deep, 2.5 cm diameter cores were collected from within 30 cm of the outer edge of each paired light and dark chambers to characterize sediment properties. To calculate pore water content, an approximately 15 g subsample was homogenised, weighed, freeze-dried for 8 days, and weighed again. The difference in weight between samples was calculated, and the proportion of the sample comprised from water expressed as a percentage. Chlorophyll a was analyzed by freeze drying an ~15 g subsample of homogenised sediment, producing approximately 5 g of dry sediment. Samples were boiled in 90% ethanol to extract chlorophyll a32. The extract was processed with a spectrophotometer (Shimadzu UV Spectrophotometer UV-1800). Samples were then acidified to separate phaeophytin from chlorophyll a33. The chlorophyll-a and phaeophytin content of the sediment is an indication of the microphytobenthic biomass that can occur at each site34,35. Due to resource constraints, more comprehensive measures of microbial activity could not be carried out. As such, the chlorophyll-a and phaeophytin content of the sediment are to be used implicitly as proxies for microbial activity.
Organic matter content was estimated using an ~5 g subsample of freeze-dried, homogenized sediment which was weighed, ashed at 450 °C for four hours36, and reweighed. Organic matter was calculated from the difference between dry and ashed weights. While attempts were made to measure the dissolved inorganic nitrogen concentration in the pore water at each site, due to analytical problems that data was unusable. As a result, the organic matter content of the sediment was used as a proxy.
Sediment grain size was measured using a Malvern Mastersizer 3000 (measuring particles 0.1–3500 µm in diameter). Samples were digested in 10% hydrogen peroxide until frothing ceased, rinsed with distilled water in a centrifuge, and run through the Malvern. The mud content was measured as the proportion of grains <63 µm in diameter.
Macrofaunal community characteristics have been found to be important factors influencing the flux of GHGs on temperate intertidal flats, with the abundance of large bioturbating bivalves being key drivers of this influence15,37. Consequently, the macrofaunal community characteristics were sampled once in summer and once in winter for each pair of Light/Dark chambers, using one 15 cm deep, 13 cm diameter sediment core immediately adjacent to the paired chambers (within the treatment plot). Cores were sieved on a 500 µm mesh. For the samples collected during summer, the material retained was preserved in 50% isopropyl alcohol and stained with Rose Bengal for subsequent analysis. All macrofaunal organisms observed were counted and identified to the lowest taxonomic level possible – in most cases species. Macrofaunal sampling in winter was limited to counts and measurements of bivalves >5 mm diameter (Austrovenus stutchburyi, Macomona liliana, and Paphies australis); material was returned to the sampling site.
Statistical analysis
The PERMANOVA + package for PRIMER v7 was used to quantify differences in the environmental variables measured at different sites and in different seasons, and to quantify differences in the flux of GHGs between and within sites, nutrient treatments, light exposure (i.e. Light or Dark chambers), and seasons.
Permanovas were carried out on Euclidian Distance Resemblance matrices, using the fixed factors of Site (Onerahi, Parua Bay, Takahiwai, Raglan, and Whangateau), Treatment (Control, Medium, or High nutrient enrichment), Light Exposure (Light or Dark), and Season (Summer or Winter) for the GHG fluxes.
For environmental variables, the factors of Site and Season were used. The highest order interaction that was significant at the p < 0.05 level was used to analyse differences in flux between groups of these factors. After an interaction was identified, post-hoc pairwise tests were carried out to identify which groups within those interactions were significantly different at the p < 0.05 level, and the direction of those differences.
Results
Site characteristics
The sites used in this study differed significantly in their environmental conditions (p < 0.05), exhibiting a gradient of environmental conditions (Table 1). Temperature, sediment mud content (<63 µm), sediment organic matter content, sediment porosity, and chlorophyll and phaeophytin concentration generally were lowest at Takahiwai, and highest at Raglan, with Onerahi, Parua Bay, and Whangateau exhibiting intermediate values (Table 1).
The sites differed in environmental conditions between summer and winter sampling, with sites generally having lower temperatures, organic matter content, and lower bivalve abundance in winter than in summer (Table 1), and higher mud content, chlorophyll, and phaeophytin concentration in winter (Table 1). However, the summer of 2016–2017 was an especially wet summer, with higher than average rainfall and lower than average daily temperatures. Also, the 2018 winter was an especially mild winter, with warm temperatures and clear skies for much of the season. This may have resulted in a smaller difference in environmental conditions between seasons than would usually be expected at these sites. Temperatures inside the chambers typically varied by 2–3 degrees in dark chambers and 3–4 degrees in light chambers over the duration of the chamber placement. The temperatures inside the chambers were on par with those outside the chambers, and did not reach temperatures higher than those that would be expected on the flats on a calm, fine day in the season the fluxes were measured.
Greenhouse gas fluxes
At the non-enriched (control) sites, under Light conditions, 172 ± 76 µmol m−2 h−1 of CO2 was removed from the atmosphere, while under dark conditions 183 ± 56 µmol m−2 h−1 of CO2 was emitted. This gave an average net primary productivity (NPP) of 355 ± 132 µmol m−2 h−1. For this study, CO2 flux data is presented as separate light and dark fluxes instead of as NPP, as expressing the fluxes as NPP would not show the actual amount of CO2 being emitted (or taken up) by the intertidal flats, which is the key interest for this study. NPP can be inferred from the data already presented in this manuscript by simply subtracting the CO2 flux under dark conditions from the CO2 flux under light conditions.
No effect of Light or Dark treatment was observed for the CH4 or N2O fluxes, with emissions of 0.050 ± 0.14 µmol m−2 h−1 and 0.004 ± 0.0148 µmol m−2 h−1 respectively.
CO2
For all nutrient treatments, at all sites, in all seasons, the chambers under Light conditions had significantly lower CO2 emissions (or higher uptake) than the chambers in Dark conditions (Fig. 3). The CO2 fluxes in Light conditions ranged from −0.1 to −670 µmol m−2 h−1 with a mean of −233 µmol m−2 h−1. In Dark conditions, the fluxes ranged from 2 to 890 µmol m−2 h−1 with a mean of 213 µmol m−2 h−1.

CO2 flux in the Control treatments for each site across both seasons sampled (mean ± standard deviation). Black bars represent Dark chambers, while light grey bars represent Light chambers.
In Light chambers, the CO2 uptake in Control treatments was significantly lower (i.e. less CO2 emission) than in the Medium and High N enrichment treatments, which were not significantly different to each other (Table 2, Fig. 4). There were no significant differences due to nutrient enrichment on the flux of CO2 in Dark chambers (Table 2).

Mean CO2 flux averaged across seasons for each nutrient enrichment treatment (Control, Medium, High) at each site under Light conditions, mean ± standard deviation.
In Light chambers in summer, the CO2 flux at Raglan was significantly smaller (i.e. more negative) than any other site except Takahiwai, and the CO2 flux at Whangateau was significantly (p < 0.05) higher than any other sites (Table 2). In the Dark chambers during summer, Takahiwai had significantly smaller emissions of CO2 than any other sites, and there were no significant differences between any other sites. In winter, no significant differences were observed between sites (Table 2).
There was a seasonal effect on the flux of CO2 at Raglan and Whangateau, with the Dark chambers at Raglan and both the Light and Dark chambers in Whangateau having significantly smaller CO2 fluxes in winter than in summer (p < 0.05) (Table 2). In contrast, Light chambers in Raglan showed significantly smaller (i.e. larger negative) CO2 fluxes in summer than in winter (Table 2).
CH4
The CH4 fluxes ranged from 0.82 to −0.65 µmol m−2 h−1, with a mean of 0.11 µmol m−2 h−1. There was a significant Site and Nutrient Treatment interaction, with significantly lower CH4 fluxes in the Control treatment than the High treatment at all sites except Parua Bay (p < 0.05). Overall, there were no significant differences in CH4 flux between Light and Dark conditions (Fig. 5, Table 3).

CH4 flux in the Control treatments for each site, averaged across seasons, mean ± standard deviation. Black bars represent Dark conditions, while light grey bars represent Light conditions.
For the Control N enrichment treatment, the fluxes at Raglan were significantly smaller than the fluxes at either Parua Bay or Whangateau, and the fluxes at Takahiwai were also significantly smaller than the fluxes at Whangateau (Fig. 6, Table 3). There were no significant differences between sites for the Medium treatments, but for the High treatments Onerahi and Parua Bay both had significantly smaller CH4 fluxes than Raglan (Table 3). There were no significant differences between Control and Medium enrichment treatments at any sites except Raglan, and at Parua Bay there were no significant differences in CH4 flux between any enrichment treatments (Table 3).

CH4 flux at each nutrient treatment at each site, mean ± standard deviation, with the measurements in Light and Dark conditions combined.
N2O
The N2O fluxes ranged from 0.84 to −0.44 µmol m−2 h−1, with a mean of 0.03 µmol m−2 h−1 (Fig. 7). There were two significant three-way interactions: a Site by Nutrient Treatment by Light Treatment interaction, and a Site by Nutrient Treatment by Season interaction (Table 4). There was a significant 4-way interaction between Site, Nutrient Treatment, Light Treatment, and Season (p < 0.05), though post-hoc pairwise tests showed no significant differences between any two groups in that interaction (Table 4).

N2O flux (µmol m−2 h−1) within light (L) and dark (D) chambers for each of N enrichment treatments (Control, Medium, High), within each season (mean ± standard deviation). A. Whangarei Harbour, Onerahi; B. Whangarei Harbour, Parua Bay; C. Whangarei Harbour, Takahiwai; D. Raglan; E. Whangateau.
The N2O flux at both Parua Bay and Raglan increased with nutrient enrichment in both seasons, with the lowest fluxes in Control treatments, and the largest N2O fluxes in High nutrient treatments (Fig. 7b,d). Across all three nutrient treatments, and in both Light and Dark conditions, Whangateau had consistently smaller fluxes of N2O than other sites (Fig. 7e). Additionally, the chambers at both Raglan and Whangateau with High nutrient enrichment had significantly larger fluxes of N2O in the Light chambers than in the Dark (Table 4).
For the Site by Nutrient Treatment by Season interaction, nutrient enrichment was found to increase the flux of N2O in Parua Bay in summer (Fig. 7b), and in Raglan in both Summer and Winter (Fig. 7d). The only N2O fluxes that were significantly different between seasons were those in Raglan, with the N2O fluxes observed in Winter being significantly larger than those observed in Summer for all three nutrient treatments (Fig. 7d). In the Medium and High N enrichment treatments in both Summer and Winter, Whangateau consistently had significantly smaller fluxes of N2O (Fig. 7e), and Raglan had significantly larger fluxes of N2O (Fig. 7d, Table 4).
Discussion
This study is the first to demonstrate that nitrogen enrichment is associated with an increase in CO2 uptake and CH4 and N2O emissions from emerged unvegetated flats, providing valuable new insights on the impact of nutrient enrichment on estuaries. This study also indicated that tidal emergence is associated with differences in the magnitude and direction of GHG fluxes when compared to fluxes measured during tidal submergence, improving our understanding of the role emerged intertidal flats play in estuarine GHG fluxes.
Nutrient enrichment of 600 gN m−2 was associated with an average of 1.65x increase in CO2 uptake under light conditions and 1.35x increase in the average CO2 emission in dark conditions (although the latter was not statistically significant). High N enrichment was also associated with a 3.8x increase in CH4 emission and a 15x increase in the emission of N2O under both light and dark conditions.
There have been several studies linking microphytobenthic activity to GHG emissions, with some estimates finding them responsible for as much as 50% of all estuarine primary production (i.e. CO2 flux) across all intertidal habitats38. These results suggest that nutrient enrichment enhanced microphytobenthic activity and resulted in a modest net reduction in CO2 emissions (driven by increased photosynthetic uptake) at our sites. However, this reduction in CO2 did not offset the significant increase in the emission of CH4 and N2O – both of which are likely also a result of increased microbial activity, as both methanogenesis and denitrification (the processes responsible for a majority of CH4 and N2O emissions respectively1,4,39) are controlled by microbial activity in the sediment37.
After accounting for the relative impact of each gas on the greenhouse effect by converting CH4 and N2O into CO2 equivalents (CH4 is 25x more potent than CO2 as a GHG; N20 is 298x more potent than CO2 as a GHG40), an estimated average of the equivalent of 8.5 µmol m−2 h−1 of CO2 was emitted to the atmosphere from control sites under emerged conditions (allowing for both light and dark conditions). Nutrient enrichment resulted in an increase of 55% to 13.2 µmol m−2 h−1 of CO2 equivalents.
This study was carried out alongside another experiment measuring the flux of O2 (and by proxy CO2, as one flux can be converted to the other with an approximate 1: −1 ratio41) under submerged conditions at the same sites42. Under Light conditions, the submerged sand flats emitted an average of over 100 µmol CO2 m−2 h−1 42. In contrast, emerged sediment from this study has taken up approximately 180 µmol CO2 m−2 h−1. These results suggest that, at least at these study sites, sediments may switch between being a source of CO2 during tidal submergence, to a sink of CO2 during tidal emergence. This may be due to the higher light intensity available at the surface of the sediment under emerged conditions11,43, allowing higher rates of photosynthesis by the microphytobenthos and lower rates of ventilation (meaning lower rates of CO2 release) by macrofauna such as bivalves under emerged conditions44.
While comparable submerged CH4 and N2O data was not collected at the same site, emerged fluxes in this study differ from submerged fluxes in other studies. Emerged CH4 fluxes in this study were on average 2.8x lower, and N2O fluxes on average 120x lower than submerged values reported elsewhere (Table 5). The differences in fluxes are consistent with the literature and likely driven by differences in environmental conditions. For example, in comparison to our study, CH4 and N2O emissions by Li et al.2 were approximately 3x and 5x higher, however sediment organic matter content was 8–8.5%, approximately 3–8x higher than our study. Sediment organic matter content is positively associated with rates of nutrient cycling, which drive increased N2O emissions4,15,45, and with microbial production of CO2 and CH446,47. Macrofaunal community composition also varied significantly between sites in this study, and with other studies, such as Kang et al.39. Macrofauna influence the flux of CO2, CH4, and N2O through several processes, such as increasing CO2 emissions directly by increasing microbial respiration, and bioturbating the sediment15,48,49. Variability in the activity of macrofauna may also drive differences in GHG flux rates between tidal emergence and submergence. For example, both CH4 and N2O are produced within the sediment, CH4 via methanogenesis1,50 and N2O as part of the denitrification process3,4,10. The delivery of these gases to the sediment-atmosphere or sediment-water interface is accelerated by bioturbation (a process largely driven by bivalves on intertidal flats in NZ)51. Most bivalves, especially A. stutchburyi and M. liliana (the two most commonly occurring bivalves in this study), are known to reduce their activity during tidal emergence (e.g.14,52). This may decrease the delivery of GHGs from deeper in the sediment to the sediment surface. In addition, methodological differences may have contributed to differences between studies. For instance, Kang et al.39 have taken sediment in the field and incubated them in the laboratory for two hours, whereas our study used in situ chambers placed over the sediment surface for up to >3 hours, with minimal disturbance to the sediment column. Disturbance to the sediment column may impact O2 concentrations and expose anoxic sediment to oxygen15,48, enhancing GHG production53,54,55. The methods used in this study were established by a pilot study carried out in Hamilton30. Part of that preliminary experiment was to measure the flux of GHG several times throughout the period of emergence, in order to determine the ideal sampling period. The same in situ incubation methods were used, but with six gas samples collected at approximately 25-minute intervals, instead of only collecting initial and final gas samples from each chamber. There has been research identifying the potential influence of the ebb and flood tide on the emission of GHGs on intertidal flats through ‘tidal pumps’39,56. Based on this research, and on the results of the preliminary experiment described above30, GHG flux sampling for this experiment was conducted over both the incoming and outgoing tides to capture any ‘tidal pump’ impact on the emission of these gases. This provides a robust measurement of the net GHG flux on unvegetated intertidal flats over the whole emerged period, allowing the upscaling of these fluxes to larger time scales, such as days, weeks, or years.
Our study showed that GHG fluxes from intertidal habitats are lower per m2 than other coastal habitats, such as salt marsh, mangroves, or seagrass (Table 5). However, intertidal sandflats often cover vast areas within estuaries57, and in these instances the contribution of intertidal flats to estuarine GHG flux fluxes is substantial. To demonstrate this, we calculate the contribution of intertidal flats to estuarine GHG emissions using a typical estuary from northern New Zealand as a case study (Tairua Harbour). After accounting for the extent of intertidal habitats within the estuary (33% based on habitat maps reported in Needham et al.58), we calculate that unvegetated, intertidal flats account for approximately 8% of the total CO2 emissions within estuaries, 1% of the CH4 emissions, and 24% of the N2O emissions (Table 6).
Conclusions
This study has shown that nutrient enrichment increases GHG fluxes from emerged intertidal flats (increasing CO2 uptake under light emissions, but also increasing the emission of CH4 and N2O). These results suggest that increased nitrogen enrichment of estuarine systems will likely lead to increased emission of GHGs, contributing to increased global GHG emissions and potentially exacerbating the impact of climate change. This study has also shown that emerged GHG fluxes from intertidal flats are an important component of estuarine GHG fluxes, particularly in estuaries where intertidal flats cover significant a significant proportion of the estuary. Finally, our study demonstrates that tidal state (submerged vs emerged) needs to be carefully considered when upscaling estimates of GHG emissions from intertidal flats, as directions and magnitudes of GHG fluxes may differ between tidal emergence and submergence.
References
Abril, G. & Borges, A. V. Carbon dioxide and methane emissions from estuaries, in Greenhouse gas emissions—fluxes and processes, Springer. p. 187–207 (2005).
Li, X. et al. Salinity stress changed the biogeochemical controls on CH4 and N2O emissions of estuarine and intertidal sediments. Science of The Total Environment 652, 593–601 (2019).
Murray, R. H., Erler, D. V. & Eyre, B. D. Nitrous oxide fluxes in estuarine environments: response to global change. Global change biology 21(9), 3219–3245 (2015).
Vieillard, A. & Fulweiler, R. Tidal pulsing alters nitrous oxide fluxes in a temperate intertidal mudflat. Ecology 95(7), 1960–1971 (2014).
Cahoon, L. B. The role of benthic microalgae in neritic ecosystems, in Oceanography and Marine Biology, An Annual Review, Volume 37, CRC Press. p. 55–94 (2014).
Heggie, K. & Savage, C. Nitrogen yields from New Zealand coastal catchments to receiving estuaries. New Zealand Journal of Marine and Freshwater Research 43(5), 1039–1052 (2009).
Thrush, S. et al. Muddy waters: elevating sediment input to coastal and estuarine habitats. Frontiers in Ecology and the Environment 2(6), 299–306 (2004).
Thrush, S. F. et al. The many uses and values of estuarine ecosystems. Ecosystem services in New Zealand–conditions and trends. Manaaki Whenua Press, Lincoln, New Zealand (2013).
Billerbeck, M. et al. Surficial and deep pore water circulation governs spatial and temporal scales of nutrient recycling in intertidal sand flat sediment. Marine Ecology Progress Series 326, 61–76 (2006).
Wang, D. et al. Summer-time denitrification and nitrous oxide exchange in the intertidal zone of the Yangtze Estuary. Estuarine, Coastal and Shelf Science 73(1–2), 43–53 (2007).
Drylie, T. P. et al. Benthic primary production in emerged intertidal habitats provides resilience to high water column turbidity. Journal of sea research 142, 101–112 (2018).
Cammen, L. M. Annual bacterial production in relation to benthic microalgal production and sediment oxygen uptake in an intertidal sandflat and an intertidal mudflat. Marine ecology progress series. Oldendorf 71(1), 13–25 (1991).
Lara, M. et al. Microscale drivers of oxygen dynamics during emersion: Microphytobenthic production, sediment compaction and shifts on diffusivity. In EGU General Assembly Conference Abstracts (2018).
Hohaia, A. K. Effects of terrestrial sediment on the burial behaviour of post-settlement Macomona liliana. Auckland University of Technology (2012).
Thrush, S. F. et al. Functional role of large organisms in intertidal communities: community effects and ecosystem function. Ecosystems 9(6), 1029–1040 (2006).
Cloern, J. E. et al. Human activities and climate variability drive fast‐paced change across the world’s estuarine–coastal ecosystems. Global Change Biology 22(2), 513–529 (2016).
Galloway, J. N. et al. Nitrogen cycles: past, present, and future. Biogeochemistry 70(2), 153–226 (2004).
Hume, T. M. et al. A controlling factor approach to estuary classification. Ocean & coastal management 50(11–12), 905–929 (2007).
Inglis, G. J. et al. Using habitat suitability index and particle dispersion models for early detection of marine invaders. Ecological Applications 16(4), 1377–1390 (2006).
Morrison, M. A review of the natural marine features and ecology of Whangarei Harbour. National Institute of Water & Atmospheric Research (2003).
Millar, A. S. Hydrology and Surficial Sediments of Whangarei Harbour: A Thesis Submitted in Partial Fulfilment of the Requirements for the Degree of Master of Science in Earth Sciences at the University of Waikato. University of Waikato (1980).
Lundquist, C. & Broekhuizen, N. Predicting suitable shelfish restoration sites in Whangarei Harbour. Larval dispersal modelling and verification. Report prepared for Ministry of Science Innovation Envirolink Fund to Northland Regional Council. 2012. (2014).
Lundquist, C. J. et al. Changes in benthic community structure and sediment characteristics after natural recolonisation of the seagrass Zostera muelleri. Scientific reports 8(1), 13250 (2018).
Larcombe, M. F. Distribution and Recognition of Intertidal Organisms in the Whangateau Harbour, and: A Classification for Sheltered Soft Shores. Zoology)–University of Auckland (1968).
Council, A. R. Ecological communities and habitats of Whangateau Harbour (2009).
Hume, T. M. & Herdendorf, C. E. Factors controlling tidal inlet characteristics on low drift coasts. Journal of Coastal Research, p. 355–375 (1992).
Alan M. Sherwood & Campbell, S. Nelson. Surficial sediments of Raglan Harbour. New Zealand Journal of Marine and Freshwater Research 13(4), 475–496 (2010).
Douglas, E. J. et al. Macrofaunal functional diversity provides resilience to nutrient enrichment in coastal sediments. Ecosystems 20(7), 1324–1336 (2017).
Douglas, E. J. et al. Sedimentary environment influences ecosystem response to nutrient enrichment. Estuaries and coasts 41(7), 1994–2008 (2018).
Hamilton, D. Greenhouse gas fluxes on emerged, unvegetated intertidal flats, in Institute of Marine Science. University of Auckland (2019).
Lohrer, A. et al. Ecosystem functioning in a disturbance-recovery context: contribution of macrofauna to primary production and nutrient release on intertidal sandflats. Journal of Experimental Marine Biology and Ecology 390(1), 6–13 (2010).
Sartory, D. & Grobbelaar, J. Extraction of chlorophyll a from freshwater phytoplankton for spectrophotometric analysis. Hydrobiologia 114(3), 177–187 (1984).
Hansson, L. A. Chlorophyll a determination of periphyton on sediments: identification of problems and recommendation of method. Freshwater Biology 20(3), 347–352 (1988).
Joint, I. Microbial production of an estuarine mudflat. Estuarine and Coastal Marine Science 7(2), 185–195 (1978).
Bittar, T. B. et al. Seasonal dynamics of dissolved, particulate and microbial components of a tidal saltmarsh-dominated estuary under contrasting levels of freshwater discharge. Estuarine, Coastal and Shelf Science 182, 72–85 (2016).
Mook, D. H. & Hoskin, C. M. Organic determinations by ignition: caution advised. Estuarine, Coastal and Shelf Science 15(6), 697–699 (1982).
Pratt, D. R. et al. The effects of short-term increases in turbidity on sandflat microphytobenthic productivity and nutrient fluxes. Journal of sea research 92, 170–177 (2014).
Underwood, G. & Kromkamp, J. Primary Production by Phytoplankton and Microphytobenthos in Estuaries. Advances in Ecological# 12 in G/WResearch. Elsevier (1999).
Kang, J. et al. Insights into Macroinvertebrate burrowing Activity and Methane Flux in Tidal Flats. Journal of Coastal Research 85(sp1), 681–685 (2018).
Griggs, D. J. & Noguer, M. Climate change 2001: the scientific basis. Contribution of working group I to the third assessment report of the intergovernmental panel on climate change. Weather 57(8), 267–269 (2002).
Hargrave, B. T. Coupling carbon flow through some pelagic and benthic communities. Journal of the Fisheries Board of Canada 30(9), 1317–1326 (1973).
Thrush, S. et al. Cumulative stressors reduce the self-regulating capacity of coastal ecosystems. Ecological Applications. Submitted.
Vermaat, J. E. & Verhagen, F. C. Seasonal variation in the intertidal seagrass Zostera noltii Hornem.: coupling demographic and physiological patterns. Aquatic Botany 52(4), 259–281 (1996).
Carroll, J. L. & Wells, R. M. Strategies of anaerobiosis in New Zealand infaunal bivalves: adaptations to environmental and functional hypoxia. New Zealand Journal of Marine and Freshwater Research 29(2), 137–146 (1995).
Kaartokallio, H. et al. Bacterial production, abundance and cell properties in boreal estuaries: relation to dissolved organic matter quantity and quality. Aquatic Sciences 78(3), 525–540 (2016).
Gelesh, L. et al. Methane concentrations increase in bottom waters during summertime anoxia in the highly eutrophic estuary, Chesapeake Bay, USA. Limnology and Oceanography 61(S1), S253–S266 (2016).
Howarth, R. W., Santoro, R. & Ingraffea, A. Methane and the greenhouse-gas footprint of natural gas from shale formations. Climatic Change 106(4), 679 (2011).
Lohrer, A. M., Thrush, S. F. & Gibbs, M. M. Bioturbators enhance ecosystem function through complex biogeochemical interactions. Nature 431(7012), 1092 (2004).
Migné, A. et al. Spatial and temporal variability of CO2 fluxes at the sediment–air interface in a tidal flat of a temperate lagoon (Arcachon Bay, France). Journal of sea research 109, 13–19 (2016).
Allen, D. E. et al. Spatial and temporal variation of nitrous oxide and methane flux between subtropical mangrove sediments and the atmosphere. Soil Biology and Biochemistry 39(2), 622–631 (2007).
Bonaglia, S. et al. Methane fluxes from coastal sediments are enhanced by macrofauna. Scientific reports 7(1), 13145 (2017).
Jones, H. F. E. The ecological role of the suspension feeding bivalve, Austrovenus stutchburyi, in estuarine ecosystems. University of Waikato (2011).
Bulmer, R. H., Lundquist, C. & Schwendenmann, L. Sediment properties and CO2 efflux from intact and cleared temperate mangrove forests. Biogeosciences 12(20), 6169–6180 (2015).
Mermillod-Blondin, F. & Rosenberg, R. Ecosystem engineering: the impact of bioturbation on biogeochemical processes in marine and freshwater benthic habitats. Aquatic Sciences 68(4), 434–442 (2006).
Migné, A. et al. A closed-chamber CO2-flux method for estimating intertidal primary production and respiration under emersed conditions. Marine Biology 140(4), 865–869 (2002).
Chen, X. & Slater, L. Methane emission through ebullition from an estuarine mudflat: 1. A conceptual model to explain tidal forcing based on effective stress changes. Water Resources Research 52(6), 4469–4485 (2016).
Murray, N. J. et al. The global distribution and trajectory of tidal flats. Nature 565(7738), 222 (2019).
Needham, H. R. et al. Intertidal habitat mapping for ecosystem goods and services: Tairua harbour (2014).
Garcias-Bonet, N. & Duarte, C. M. Methane production by seagrass ecosystems in the Red Sea. Frontiers in Marine Science 4, 340 (2017).
Bahlmann, E. et al. Tidal controls on trace gas dynamics in a seagrass meadow of the Ria Formosa lagoon (southern Portugal). Biogeosciences 12(6), 1683–1696 (2015).
Bulmer, R. H. et al. Sediment carbon and nutrient fluxes from cleared and intact temperate mangrove ecosystems and adjacent sandflats. Science of the Total Environment 599, 1874–1884 (2017).
Chen, G., Tam, N. & Ye, Y. Summer fluxes of atmospheric greenhouse gases N2O, CH4 and CO2 from mangrove soil in South China. Science of the Total Environment 408(13), 2761–2767 (2010).
Poffenbarger, H. J., Needelman, B. A. & Megonigal, J. P. Salinity influence on methane emissions from tidal marshes. Wetlands 31(5), 831–842 (2011).
Lovelock, C. E., Fourqurean, J. W. & Morris, J. T. Modeled CO2 emissions from coastal wetland transitions to other land uses: tidal marshes, mangrove forests, and seagrass beds. Frontiers in Marine Science 4, 143 (2017).
Yang, W. H. & Silver, W. L. Gross nitrous oxide production drives net nitrous oxide fluxes across a salt marsh landscape. Global change biology 22(6), 2228–2237 (2016).
Acknowledgements
This research was completed as part of the requirements for a MSc degree to D.J.H. at the University of Auckland. Additional funding for this study was provided by the NIWA Strategic Science Investment Fund, project #COME1903. We acknowledge the contributions of researchers from the University of Auckland, the University of Waikato and NIWA who contributed to the experimental design and site set up for nutrient treatments within a national experiment on multiple stressors, funded by the Ministry of Business, Employment and Innovation under the New Zealand National Science Challenge ‘Sustainable Seas’ (MBIE Contract #CO1X1515, Tipping Points project).
Author information
Authors and Affiliations
Contributions
Gas and sediment samples were collected by D.J.H., R.H.B. and C.J.L. Analysis of gas samples was carried out by D.J.H. and L.S. Sediment samples were analysed by D.J.H. and L.S. D.J.H. led data analysis and the writing of the manuscript. All authors contributed to the discussion and interpretation of the data collected, and to the writing of the manuscript.
Corresponding author
Ethics declarations
Competing interests
The authors declare no competing interests.
Additional information
Publisher’s note Springer Nature remains neutral with regard to jurisdictional claims in published maps and institutional affiliations.
Supplementary information
Rights and permissions
Open Access This article is licensed under a Creative Commons Attribution 4.0 International License, which permits use, sharing, adaptation, distribution and reproduction in any medium or format, as long as you give appropriate credit to the original author(s) and the source, provide a link to the Creative Commons license, and indicate if changes were made. The images or other third party material in this article are included in the article’s Creative Commons license, unless indicated otherwise in a credit line to the material. If material is not included in the article’s Creative Commons license and your intended use is not permitted by statutory regulation or exceeds the permitted use, you will need to obtain permission directly from the copyright holder. To view a copy of this license, visit http://creativecommons.org/licenses/by/4.0/.
About this article

Cite this article
Hamilton, D.J., Bulmer, R.H., Schwendenmann, L. et al. Nitrogen enrichment increases greenhouse gas emissions from emerged intertidal sandflats. Sci Rep 10, 6686 (2020). https://doi.org/10.1038/s41598-020-62215-4
Received:
Accepted:
Published:
DOI: https://doi.org/10.1038/s41598-020-62215-4
- Springer Nature Limited