
Abstract
Our research paper introduces a newly developed probability distribution called the transformed MG-extended exponential (TMGEE) distribution. This distribution is derived from the exponential distribution using the modified Frechet approach, but it has a more adaptable hazard function and unique features that we have explained in detail. We conducted simulation studies using two methods: rejection sampling and inverse transform sampling, to produce summaries and show distributional properties. Moreover, we applied the TMGEE distribution to three real datasets from the health area to demonstrate its applicability. We used the maximum likelihood estimation technique to estimate the distribution’s parameters. Our results indicate that the TMGEE distribution provides a better fit for the three sets of data as compared to nine other commonly used probability distributions, including Weibull, exponential, and lognormal distributions.
1 Introduction
The exponential probability distribution is a commonly used model for various real-world situations in fields such as engineering, business, economics, medicine, and biology. In modeling Poisson processes, the inter-arrival duration can typically be determined using the exponential distribution. However, in real-life situations, the assumption of constant hazard rates and constant event occurrence rates may not hold, making the model less adaptable. To address this issue, a new probability distribution called the Transformed MG-Extended Exponential Distribution has been developed. The distribution described here modifies the exponential distribution by raising its cumulative distribution to a power determined by an additional parameter. This parameter influences the shape of the distribution and allows for the representation of certain characteristics in real-world phenomena that were not accounted for by the original exponential distribution. The method involves a transformation that enhances the flexibility of the distribution.
New probability distributions have been introduced by adding new parameter(s) to existing distributions, making them more adaptable to various scenarios through transformation methods.
Several distributions have been studied in the literature that are derived from the exponential distribution. For example, Gupta and Kundu [1] introduced a new parameter to derive the exponentiated exponential distribution. Merovci [2] used a quadratic rank transformation map to obtain the transmuted exponentiated exponential distribution from the exponentiated exponential distribution. Similarly, Oguntunde and Adejumo [3] generalized the exponential distribution to a two-parameter model using the same transformation technique. Hussian [4] examined the transmuted exponentiated gamma distribution, which is a generalization of the exponentiated gamma distribution. Enahoro et al. [5] applied the performance rating of the transmuted exponential distribution to a real-life dataset. Nadarajah and Kotz [6] studied the beta exponential distribution, which is generated from the logit of the exponential distribution.
Cordeiro and Castro [7] studied a new family of generalized distributions called Kumaraswamy distributions, which includes Weibull, gamma, normal, Gumbel, and inverse Gaussian distributions. Mahdavi and Kundu [8] developed a new alpha power transformation method by adding a new parameter to the exponential distribution, producing new probability distributions. Recently, Khalil et al. [9] developed a new Modified Frechet distribution by adding a shape parameter to the Frechet distribution. In their work, [10] introduced a new Modified Frechet-Rayleigh distribution. They used the Rayleigh distribution as a base distribution and added a shape parameter to their derivation.
Alzaatreh et al. [11] combined the T-X method with the probability density function of the exponential distribution to introduce a novel technique for generating new probability distributions. Marshal and Olkin [12] proposed a new technique by adding a parameter to a family of distributions using the Weibull distribution as a base distribution. Tahir et al. [13] explored a novel Weibull G-family distribution and its characteristics by using the Weibull distribution as a base distribution. When analyzing lifetime or failure time data, the Weibull and gamma distributions with two and three parameters are commonly used. However, these models have a limitation in that their hazard functions are monotonic, i.e., they either increase or decrease with time. This may not be suitable for all scenarios. For example, as pointed out by [14], the hazard function of the Weibull distribution grows from zero to infinity as its shape parameter increases. This makes it unsuitable for modeling lifetime data in survival analysis, where some events have increasing risks over time and constant risks after a certain point.
The paper is organized into several sections for ease of navigation. The introduction can be found in Sect. 1. The transformed MG-extended exponential distribution and its associated density, cumulative distribution function, survival, and hazard function graphs are detailed in Sects. 2 and 3. The definitions of quintiles, mean, moments, and moment-generating functions are provided in Sects. 4 through 6. Section 7 explains the definition of order statistics, while Sect. 8 covers parameter estimation and the characteristics of estimators. The paper also includes a simulation study in Sect. 9 and applications discussed in Sect. 10. Finally, the conclusion can be found in Sect. 11.
2 The Transformed MG-Extended Exponential Distribution
A study conducted by [9] introduced a modified Frechet approach for generating probability distributions. The study presented the cumulative distribution function and the density function, which are defined by Eqs. 1 and 2, respectively. These functions were generated based on the base or induced distribution function, F(x), of a random variable X. The equation for the distribution function of the modefied Frechet is provided below.
The probability density function is subsequently specified to be
where \(\alpha\) is the distribution’s extra parameter.
The aforementioned approach is employed in this study to develop a new probability distribution based on the exponential probability distribution, named the Transformed MG-Extended Exponential (TMGEE) distribution. The TMGEE distribution is introduced to improve time-to-event data models for survival analysis and to increase the flexibility of the distribution for modeling real-world problems. Equations 3 and 4 define the cumulative distribution and density functions of the exponential distribution, respectively.
where \(\lambda\) is the distribution’s rate parameter, often indicating the rate at which events occur in a Poisson point process with a mean of \(1/\lambda\) and variance 1/\(\lambda ^2\).
The new proposed TMGEE cumulative distribution function is defined in Eq. 5, for the shape parameter \(\alpha\) and scale parameter \(\lambda\) by substituting the cumulative distribution function defined in Eq. 3 to Eq. 1.
By differentiating the cumulative distribution with respect to x, we determine the probability density function. Equation 6 thus defines the probability density function of the TMGEE distribution.
Proposition 1
The TMGEE distribution, \(f_{TMGEE}(x;\alpha ,\lambda )\) is a legitimate probability density function.
Proof
\(f_{TMGEE}(x;\alpha ,\lambda )\) is obviously non-negative for all \(x \ge 0\), and
Substituting \(u = (1-e^{-\lambda x})^{\alpha}\), and \(du = \alpha \lambda e^{-\lambda x} (1-e^{- \lambda x})^{\alpha -1}dx\), we have
Note that the TMGEE probability density function has a decreasing curve with a form akin to the exponential distribution’s probability density function for \(0<\alpha \le 1\). The exponential distribution, however, is not a special case of it. The probability density function and cumulative distribution function of the TMGEE distribution are displayed in Fig. 1 for a few selected \(\alpha\) and \(\lambda\) values. \(\square\)

The density function and distribution function of the TMGEE distribution for some chosen values of \(\alpha\) and \(\lambda\)
3 Survival and Hazard Functions of the TMGEE Distribution
The survival and hazard functions of the TMGEE distribution are defined, respectively, by Eqs. 7 and 8 below.
For some chosen values of \(\alpha\) and \(\lambda\), Fig. 2 displays the survival and hazard function of the TMGEE distribution. It’s worth noting that the hazard function has distinct characteristics depending on the selected parameters:
-
When \(0 < \alpha \le 1\), the curve continuously decreases until settling to the value of \(\lambda\).
-
When \(\alpha > 1\) and \(\alpha > \lambda\), the curve rises until stabilizing at the value of \(\lambda\).
-
Finally, when \(\alpha > 1\) and \(\lambda \ge \alpha\), the curve reaches its highest value and then slightly decreases before settling to the value of \(\lambda\).

The survival and hazard functions of the TMGEE distribution for some chosen values of \(\alpha\) and \(\lambda\)
Proposition 2
The function \(f_{TMGEE}(x;\alpha ,\lambda )\) is convex for \(0<\alpha \le 1\) and concave for \(\alpha >1.\)
Proposition 2 can be verified by differentiating the log of the TMGEE probability density function with respect to x. The results indicate that \(f_{TMGEE}(x;\alpha ,\lambda )\) is decreasing for \(0<\alpha \le 1\) and unimodal for \(\alpha >1\). Equation 9 can be used to get the modal value.
4 Quantiles of the TMGEE Distribution
To obtain the pth quantile value for the TMGEE distribution, where X is a random variable such that X \(\sim\) TMGEE(\(\alpha\),\(\lambda\)), follow these steps:
-
i.
Find the inverse function, \(F^{-1}(.)\), based on the cumulative distribution function Eq. 5.
-
ii.
Generate a random variable U, such that \(U \sim U(0,1)\).
-
iii.
Then, use the formula \(X_{p} = F^{-1}(U)\) to obtain the pth quantile value \(X_{p}\).
From Eq. 5, \(F_{TMGEE}(x)=\frac{e^{-{(1-e^{-\lambda x})}^{\alpha }}-1}{e^{-1}-1}\), and \(F(X_{p}) = u\) implies
Consequently, the quantile function of the TMGEE distribution is given by Eq. 10 as follows:
The median is defined in Eq. 11 and is found by substituting \(u=0.5\) in Eq. 10.
Equations 12 and 13 give the following definitions for the first and third quartiles, \(Q_{1}\) and \(Q_{3}\), respectively.
5 Mean and Moments of the TMGEE Distribution
5.1 The Mean
If X is a random variable such that X \(\sim\) TMGEE(\(\alpha\),\(\lambda\)), then mean, \(\mu = E(X)\), can be derived as follows:
If \(y = (1-e^{-\lambda x})\), and \(e^{-\lambda x} = 1-y\), then dy \(=\) \(\lambda (1-y) dx\). As a result, the mean can be written as
If \(z=y^{\alpha }\), the mean can be evaluated as follows:
By using the series expansion of \(log(1-z^{\frac{1}{\alpha }}) = -\sum _{k=1}^{\infty }\frac{z^{\frac{k}{\alpha }}}{k}\), for \(|{z^{\frac{1}{\alpha }}}| < 1\),
Therefore, using the infinite series representation of the incomplete gamma integral, Eq. 14 can be used to define the mean of the random variable following the TMGEE distribution as:
where the discussion of the upper incomplete gamma function \(\Gamma \left( .,.\right)\) can be found in the study by [15].
5.2 Moments of the TMGEE Distribution
5.2.1 Moments
The r-th moment, denoted by \(\mu _r\), of the TMGEE random variable can be defined as follows:
For \(y = 1-e^{-\lambda x}, e^{-\lambda x} = 1-y\) and \(dx = \frac{dy}{\lambda(1-y)}\), \(\mu _{r}^{/}\) can be written as
When \(z=y^\alpha , \mu _{r}^{/}\) can be expressed as
For \(|z^{\frac{1}{\alpha }}| <1\), the rth moment can be simplified by substituting the series expansion
in Eq. 15 as:
The \(r^{th}\) moment of the TMGEE distribution can be found by expanding the summation part of the equation, which is located just above, and then integrating each term that results from the expansion. Equation 16 defines the final result. The incomplete gamma function is used in this derivation.
The first moment defined in Eq. 16 is equivalent to the mean of the random variable following the TMGEE distribution given in Eq. 14.
5.2.2 Central Moments
The rth central moment of a random variable X is defined as follows.
For a random variable that follows the TMGEE distribution, Eq. 17 can be utilized to formulate the rth central moment.
The zero moment and central moments are equal to one, i.e., \(\mu _{0}^{/} = \mu _{0} =1\) and the first central moment, \(\mu _{1}\) is zero.
The variance of the random variable X, following the TMGEE distribution, can be determined using Eq. 17.
where \(\mu\) is the mean defined in Eqs. 14 and 16 can be used to find the second moment \(\mu _{2}^{/}\). The standard deviation can be determined using the square root of the variance defined in Eq. 18.
5.3 Skewness and Kurtosis of the TMGEE Distribution
To determine the coefficients of skewness and kurtosis for the random variable \(X\) \(\sim\) \(TMGEE(\alpha ,\lambda )\), we apply the methods of [16, 17]. Equations 19 and 20 define the results.
where \(CS_{TMGEE}\) and \(CK_{TMGEE}\) represent the coefficients of skewness and kurtosis for the TMGEE distribution, respectively. The standard deviation is denoted by \(\sigma\), and the third and fourth-order central moments are represented by \(\mu _{3}\) and \(\mu _{4}\), respectively.
The inverse transform algorithm based on Eq. 10 with specified values of \(\alpha\) and \(\lambda\) is used to replicate eight random samples of size 100,000 from the Transformed MG-Extended Exponential probability distribution to better familiarize with it.
The summary statistics for each sample are shown in Table 1 including mean, standard deviation (Sd), skewness, and kurtosis. The table also shows how, depending on the value of \(\alpha\), the new distribution alters the base distribution. For instance, when \(\lambda = 2\), the base distribution’s mean and standard deviation are both \(\frac{1}{\lambda }\) and equal to 0.5. The mean and standard deviation of the simulated data, however, are approximately 0.22 and 0.35, respectively.
6 The Moment Generating Function of the TMGEE Distribution
The moment-generating function (MGF), \(M_{x}(t)\), of the TMGEE random variable X is derived as follows:
By setting \(u = 1-e^{-\lambda x}, du = \lambda e^{-\lambda x} dx\) and \(e^{x} = (1-u)^{-\frac{1}{\lambda }}\), the MGF can be written as:
For \(z = u^\alpha , u=z^{\frac{1}{\alpha }}\) and \(dz = \alpha u^{\alpha -1} du\), we have
We use the following series expansion to formulate the moment-generating function:
For \(|z^{\frac{1}{\alpha }}| <1\), \(M_{z}(t)\) can be expressed as:
Consequently, the MGF is defined by Eq. 21.
7 The Order Statistics of the TMGEE Distribution
If \(X_{1}, X_{2},..., X_{n}\) are samples drawn at random from the TMGEE distribution and \(X_{(1)}, X_{(2)},..., X_{(n)}\) are the order statistics, then Eq. 22 defines the probability density function of the ith order statistics \(X_{i:n}\) as follows:
By substituting the density function f(x) and the cumulative distribution function F(x) of the random variable X in Eq. 22, the ith order statistics, \(f_{i:n}(x)\) can be written as
Consequently, Eq. 23 defines the ith order statistics of the TMGEE distribution.
Equations 24 and 25 define the first order statistics, \(f_{1:n}(x)\), and nth order statistics, \(f_{n:n} (x)\).
8 Parameter Estimation: The Maximum Likelihood Method
Let the respective realization be \(\varvec{x} = (x_{1}, x_{2},x_{3},...,x_{n})\) for \(X_{1}, X_{2}, X_{3},..., X_{n}\) independent and identically distributed (iid) random samples of size n from the TMGEE distribution. We estimate the distribution’s parameters using the maximum likelihood estimation approach.
The probability density function \(f_{TMGEE}(\varvec{x};\alpha ,\lambda )\) can be used to express the likelihood function, where \(\alpha\) and \(\lambda\) are unknown parameters.
Equation 26 can be used to define the likelihood function pf the distribution’s parameters.
The log-likelihood function, which is defined by Eq. 27, is obtained by utilizing Eq. 26.
We obtain the maximum likelihood estimates (MLEs) by differentiating the log-likelihood function with respect to the parameters \(\alpha\) and \(\lambda\). Equating the results to zero gives the score function in Eqs. 28 and 29.
Equations 30 and 31 give the second derivatives of the likelihood function specified in Eq. 27 with respect to \(\alpha\) and \(\lambda\), respectively.
Since the score function defined in Eqs. 28 and 29 cannot be solved in closed form, numerical methods can be employed to estimate the parameters. Equation 32 defines the observed Fisher information matrix of the random variable X.
The estimated variances of the parameters, which are specified on the diagonal of the variance-covariance matrix defined in Eq. 33), can be derived by inverting the Fisher information matrix defined in Eq. (32). By taking the square roots of the estimated variances, the estimated standard errors \(\hat{\sigma }(\hat{\alpha })\) and \(\hat{\sigma }(\hat{\lambda })\) are produced. Meanwhile, the off-diagonal elements represent the estimated covariances between the parameter estimates.
8.1 Asymptotic Distribution of MLEs
The MLEs are intrinsically random variables that depend on the sample size. [16] and [18] addressed the asymptotic distribution of MLEs and the properties of the estimators. The ML estimates consistently converge in probability to the true values. Owing to the general asymptotic theory of the MLEs, the sampling distribution of \((\hat{\alpha }-\alpha )/ \sqrt{\hat{\sigma }^2(\hat{\alpha })}\) and \((\hat{\lambda }-\lambda )/ \sqrt{\hat{\sigma }^2(\hat{\lambda })}\) can be approximately represented by the standard normal distribution. The asymptotic confidence intervals of the parameter estimates \(\hat{\alpha }\) and \(\hat{\lambda }\) can be determined using Eq. 34.
where \(\sqrt{\hat{\sigma }^2(\hat{\alpha })}\) and \(\sqrt{\hat{\sigma }^2(\hat{\lambda })}\), respectively, are the estimated standard errors of the estimates \(\hat{\alpha }\) and \(\hat{\lambda }\). \(z_{t/2}\) is the 100t upper percentage point of the standard normal distribution.
9 Simulation Studies
9.1 Rejection Sampling Method
In our first simulation study, we used the rejection sampling method, also known as acceptance/rejection sampling, to generate samples from a target distribution with a density function of f(x). This method allows us to simulate a random variable, X, without directly sampling from the distribution. We achieve this by using two independent random variables, U and X, where U is a uniform random variable between 0 and 1, and X is a random variable with a proposal density of g(x). The goal of this method is to ensure that f(x) is less than or equal to c times g(x) for every value of x, where g(x) is an arbitrary proposal density and c is a finite constant.
According to [19], the rejection sampling technique is versatile enough to derive values from g(x) even without complete information about the specification of f(x). Here is a step-by-step guide of the rejection sampling algorithm on how to generate a random variable X that follows the probability density function f(x).
-
1.
Generate a candidate X randomly from a distribution g(x).
-
2.
Compute the acceptance probability \(\alpha = \frac{1}{c} \cdot \frac{f(X)}{g(X)}\), where c is a constant such that \(cg(x) \ge f(x)\) for all x.
-
3.
Generate a random number u from a uniform distribution on the interval (0, 1).
-
4.
If \(u < \alpha\), accept X as a sample from f(x) and return X.
-
5.
If \(u \ge \alpha\), reject X and go back to step 1.
By following steps 1–4 repeatedly, we were able to obtain a set of samples that adhered to the probability density function f(x).
We used the rejection sampling method and inverse transform of the Monte Carlo methods to generate a random sample of observations for a random variable X, which followed the TMGEE distribution.
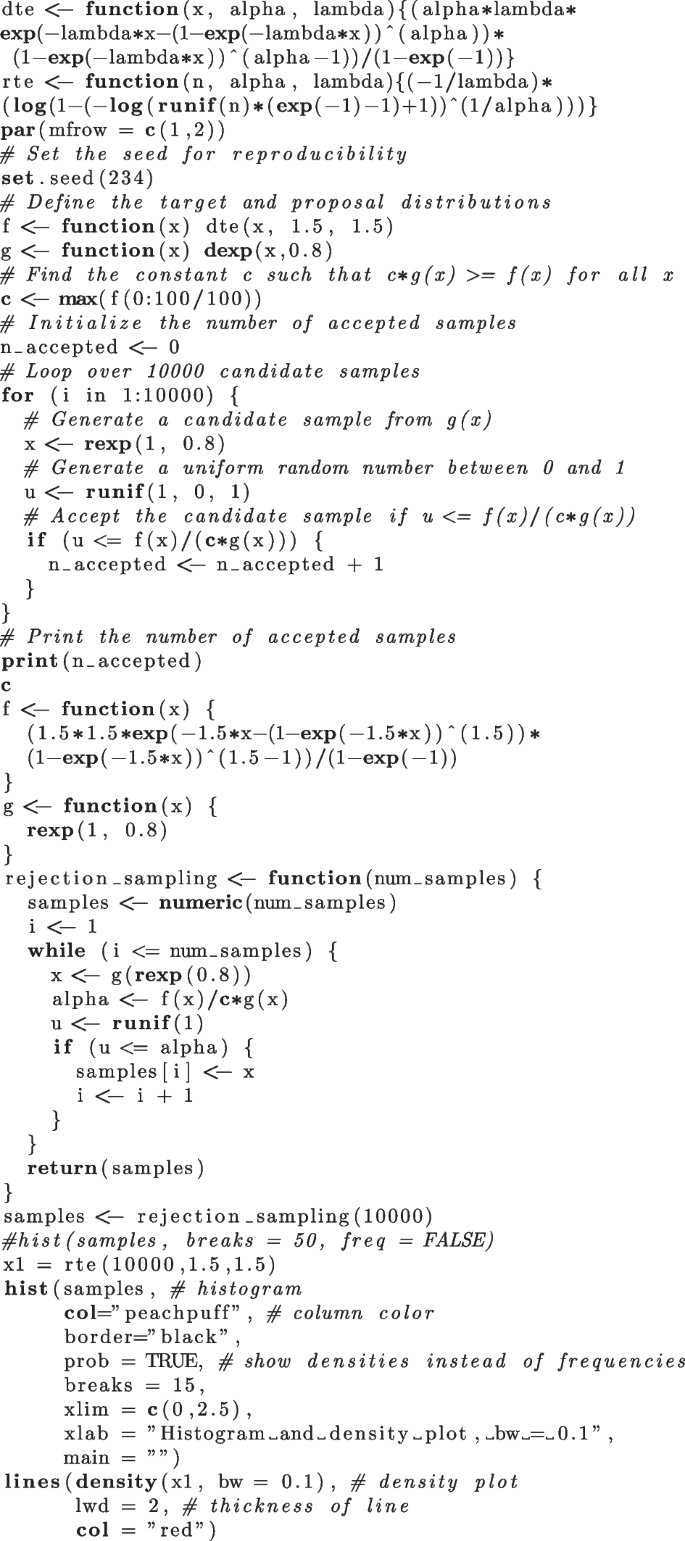
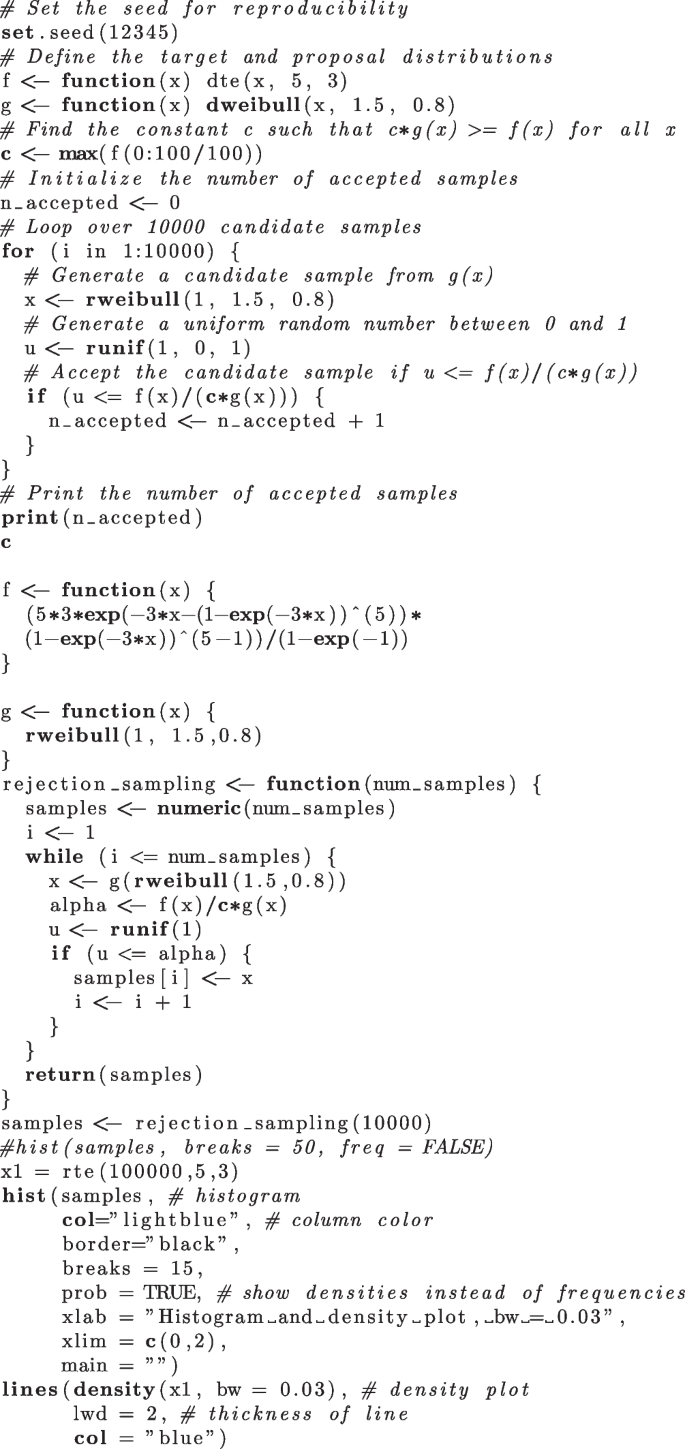
To illustrate this, we simulated random samples for two probability density functions: \(f_{TMGEE}(1.5,1.5)\) and \(f_{TMGEE}(5,3)\), using both the aforementioned methods. For the first distribution, we used the exponential distribution \(f_{exp}(0.8)\) as a proposal density, while for the second distribution, we employed the Weibull distribution \(f_{weib}(1.5,0.8)\). In each simulation, we randomly selected 10,000 samples. The R codes can be found in the appendix section of A and B.
To sample from \(f_{TMGEE}(1.5,1.5)\), we used the rejection sampling method and obtained 10,000 observations from the \(f_{exp}(0.8)\) distribution. Out of these samples, 7182 were accepted as draws from \(f_{TMGEE}(1.5,1.5)\), which resulted in an acceptance rate of 71.82%. The histogram in Fig. 3a shows the accepted draws from the rejection sampling method, while the density plot represents the target distribution.
Similarly, we used the rejection sampling method to obtain 10,000 observations from the \(f_{weib}(1.5,0.8)\) distribution. Out of the 10,000 samples, 6679 were accepted as draws from \(f_{TMGEE}(5,3)\), resulting in an acceptance rate of 66.79%. The accepted draws are displayed in the histogram in Fig. 3b, and the density plot in the figure represents the target distribution.
It has been confirmed that the proposal distribution used in each of the cases has a remarkable agreement with the results obtained using the rejection sampling method.

a Histogram created with accepted draws of rejection sampling using exponential proposal density and density plot of TMGEE (1.5, 1.5) distribution using inverse transform sampling. b Histogram created with accepted draws of rejection sampling using Weibull proposal density and density plot of TMGEE(5, 3) distribution using inverse transform sampling
9.2 Inverse Transform-Based Sampling Method
To examine the MLEs of \(\hat{\theta } \in (\hat{\alpha }, \hat{\lambda })\) for \(\theta\), we conducted a Monte Carlo simulation study utilizing the quantile function of the TMGEE distribution as defined by Eq. 10. We examined the precision of the estimators using bias and mean squared error (MSE) and observed their characteristics. We generated samples of sizes 50, 100, 150, 300, and 1000 using the quantile function of the TMGEE distribution and performed simulations with R = 1,000. Following that, we computed the bias, MSE, variance, and MLEs. To simulate and estimate, we followed these steps:
-
1.
Define the likelihood function of the model parameters.
-
2.
Obtain the MLEs by minimizing the negative log-likelihood function using the Optim approach of [20].
-
3.
Repeat the estimation for the R simulations.
-
4.
Compute the bias, MSE, and variance of the estimates.
We assume that the distribution’s \(\alpha\) values are 0.5, 2, 3, 5, and 8 and its \(\lambda\) values are 0.5, 3, 5, and 10 to run the simulations. There are 20 different parameter combinations for each of the generated sample sizes. Bias and MSE are calculated using Eqs. 35 and 36, respectively.
where \(\theta \in (\alpha ,\lambda )\) and \(MSE(\hat{\theta }) = (Bias(\hat{\theta }))^2+Var(\hat{\theta })\)
The Monte Carlo simulation was conducted for each parameter setting to estimate the random variable’s bias, MSE, and variance. The results of the parameter estimates are presented in Tables 2, 3, 4, 5, and 6.
As part of our analysis, we ran R = 10,000 simulations and generated samples of size n = 1,000 for each simulation. This helped us evaluate the asymptotic distribution of the TMGEE distribution’s parameter estimates. To do this, we utilized the inverse transform method with the parameter values of \(\alpha =1.5\), \(\lambda =2\), and \(\alpha =5\), \(\lambda =3\). We’ve presented the outcomes of the respective estimates in Figs. 4 and 5.
Based on the simulation studies carried out, using the varying sample sizes, samll (n = 50) to large (n = 1000), we can draw the following conclusions: As we increase the sample size, the MSE, the variance of the parameter estimates decreases, and the estimates of the parameters converge towards their true values. This means that the MLEs of the TMGEE parameters are unbiased and consistent. Upon examining the histograms in Figs. 4 and 5 and considering the large sample properties of the MLEs, it has been established that the asymptotic distribution of the MLEs of the TMGEE distribution parameters is normal. Furthermore, the simulation study has revealed that there is a positive correlation between the MLEs of the TMGEE distribution’s parameters for some parameter settings (refer to Fig. 6).

The results of 10,000 simulations for sample sizes of 1000 in each, with corresponding histogram and density plots for \(\alpha = 1.5\) in a and for \(\lambda = 2\) in b

The results of 10.000 simulations for sample sizes of 1.000 in each, with corresponding histogram and density plots for \(\alpha = 5\) in a and for \(\lambda = 3\) in b

The results of estimated alpha, estimated lambda, and Pearson correlations for different parameter settings from 1,000 simulations for sample sizes of 1000 each
10 Applications
In this section, we compare the TMGEE distribution with various probability distributions, including the exponential (Exp) distribution, the Weibull (WE) distribution, the lognormal (LN) distribution, and the alpha power exponential (APE) and alpha power Weibull (APW) distributions studied by [8]. We also compare the exponentiated Weibull distribution (EW) introduced by [21], the exponentiated Kumaraswamy G family distribution where the baseline distribution is exponential (EKG-E), as studied by [11], and the Kumaraswamy G family distributions (KG-W and KG-G) researched by [7], where the baseline distributions are Weibull and gamma, respectively. We define the probability density functions and cumulative distribution functions of some of these distributions below.
-
Exponentiated Weibull distribution(EW)
\(f(x;\beta , c,\alpha ) = \alpha \beta c (\beta x)^{c-1} (1-e^{-(\beta x)^c})^{\alpha -1}e^{-(\beta x)^c}\)
\(F(x;\beta , c,\alpha ) = (1-e^{-(\beta x)^c})^{\alpha }, x>0, c>0, \alpha >0\) and \(\beta >0\)
-
Alpha power exponential distribution(APE)
\(f(x;\alpha ,\lambda ) = \frac{log(\alpha )\lambda e^{-\lambda x} \alpha ^{1-e^{-\lambda x}}}{\alpha -1}\)
\(F(x,\alpha ,\lambda ) = \frac{\alpha ^{1-e^{-\lambda x}}-1}{\alpha -1}, x>0, \alpha >0, \alpha \ne 1\) and \(\lambda >0\)
-
The alpha power Weibull distribution (APW)
\(f(x;\alpha ,\lambda , \beta ) = \frac{log(\alpha )\lambda \beta e^{-\lambda x^\beta } x^{\beta -1} \alpha ^{1-e^{-\lambda x^\beta }}}{\alpha -1}\)
\(F(x;\alpha ,\lambda ,\beta ) = \frac{1-\alpha ^{1-e^{-\lambda x^\beta }}}{1-\alpha },x>0, \alpha >0, \alpha \ne 1\) and \(\lambda>0,\beta >0\)
-
Exponentiated Kumaraswamy G family distributions (EKG-E)
\(f(x;a,b,c) = abcg(x)G(x)^{\alpha -1} (1-G(x)^a)^{b-1}(1-(1-G(x)^a)^b)^{c-1}\)
\(F(x;a,b,c) = (1-(1-G(x)^a)^b)^c, x>0, a>0, b>0,c>0\)
where g(x) and G(x) are, respectively, the pdf and CDF of the exponential distribution.
-
Kumaraswamy G family distributions (KG-W and KG-G)
\(f(x;a,b) = abg(x)G(x)^{\alpha -1} (1-G(x)^a)^{b-1}(1-G(x)^a)^{b-1}\)
\(F(x;a,b) = 1-(1-G(x)^a)^b, x>0, a>0, b>0,c>0\)
where the Weibull and gamma distributions’ respective pdf and CDF are denoted as g(x) and G(x).
Three real datasets were used to illustrate the fitting of distributions. One of the datasets used in this study was obtained from [22]. The dataset consists of the frailty term assessed in a study of the recurrence time of infections in 38 patients receiving kidney dialysis. The data set includes 76 observations. [23] explained that each person has a distinct level of frailty or an observed heterogeneity term, which determines their risk of death in proportional hazard models. Another dataset was obtained from the systematic review and meta-analysis conducted by [24]. This dataset shows overall mortality rates among people who injected drugs. The third dataset consists of 128 individuals with bladder cancer, and it shows the duration of each patient’s remission in months. This dataset was used by [25] to compare the fits of the five-parameter beta-exponentiated Pareto distribution. Tables 7, 8, and 9 display these datasets.

MLEs and model fitting statistics were obtained by fitting the models with numerical techniques adapted from [26] and [17]. We provided the MLEs and standard errors of the model parameters for three datasets in Tables 10, 11, and 12. To compare the fit of the models, we used various information criteria, such as Akaike information criteria (AIC), corrected Akaike information criteria (AICc), Bayesian information criteria (BIC), Hannan-Quinn information criterion (HQIC), Kolmogorov-Smirnov test statistic (K-S), and its p-value. These information criteria, as explained in [27, 28], are useful in comparing model fits in various applications. However, AIC can be vulnerable to overfitting when sample sizes are small. Therefore, to correct this, we added a bias-correction term of second order to AIC to obtain AICc, which performs better in small samples. The bias-correction term raises the penalty on the number of parameters compared to AIC. As the sample size increases, the term asymptotically approaches zero, and AICc moves closer to AIC. In large samples, the HQIC penalizes complex models less than the BIC. However, individual AIC and AICc values are not interpretable [27], so they need to be rescaled to \(\Delta _i\), which is defined as follows.
Let \(\Delta _i\) denote the difference between \(AIC_i\) and \(AIC_{min}\), where \(AIC_{min}\) is the minimum value of AIC among all models. According to [27], the best model has \(\Delta _i=0\). A smaller value of the information criteria indicates a better fit, regardless of the specific criteria used. The equations defined from 37 to 40 for k and \(l(\hat{\theta })\) can be used to compute some of the model fitting statistics, where k is the number of parameters to be estimated and \(l(\hat{\theta })\) is a likelihood.
The values of the model-fitting statistics are summarized in Tables 13, 14, and 15. Goodness-of-fit plots were produced for three datasets (shown in Tables 7, 8, and 9) using specific distributions (TMGEE, exponential, Weibull, and lognormal) with methods proposed by [26]. The results of these plots can be seen in Figs. 7, 8, and 9. Our analysis shows that the newly proposed TMGEE probability distribution provides a better fit than the previously considered distributions when applied to the three datasets.

Q–Q plots (TMGEE, exponential, Weibull, and lognormal distributions)

P–P plots (TMGEE, exponential, weibull, and Lognormal distributions)
11 Conclusions
In this research, a new probability distribution called the Transformed MG-Extended Exponential Distribution (TMGEE) has been developed from the exponential probability distribution. The distribution’s detailed features have been explored and derived, and the approach of maximum likelihood has been used to estimate the parameters. We obtained unbiased and consistent estimates. Two simulation experiments have been conducted using the rejection sampling and inverse-transform sampling techniques. The usefulness of the new distribution has been evaluated using three different real datasets.
To evaluate the maximum likelihood estimates, we have used different statistical tools such as the Kolmogorov-Smirnov test statistic, the Hannan-Quinn information criteria, the corrected Akaike information criteria, the Bayesian information criteria, and the Akaike information criteria. The newly introduced TMGEE distribution has been found to fit the three sets of data far better than some of the most commonly used probability distributions, including the Weibull, exponential, and lognormal distributions.
We recommend further studies on this probability distribution in statistical theory, such as the Bayesian parameter estimation method and its application to other datasets involving lifetime and time-to-event processes.
Data availability
We have used secondary data. All data sets are available in the citations given.
References
Gupta, R.D., Kundu, D.: Exponentiated exponential family: an alternative to gamma and weibull distributions. Biometric. J. J. Math. Methods Biosci. 43(1), 117–130 (2001)
Merovci, F.: Transmuted exponentiated exponential distribution. Math. Sci. Appl. E-Notes 1(2), 112–122 (2013)
Oguntunde, P., Adejumo, A.: The transmuted inverse exponential distribution. Int. J. Adv. Stat. Probab. 3(1), 1–7 (2015)
Hussian, M.A.: Transmuted exponentiated gamma distribution: a generalization of the exponentiated gamma probability distribution. Appl. Math. Sci. 8(27), 1297–1310 (2014)
Enahoro A. Owoloko, P.E.O., Adejumo, A.O.: Performance rating of the transmuted exponential distribution: an analytical approach. Springerplus 8, 1–15 (2015)
Nadarajah, S., Kotz, S.: The beta exponential distribution. Reliab. Eng. Syst. Saf. 91(6), 689–697 (2006)
Cordeiro, G.M., Castro, M.: A new family of generalized distributions. J. Stat. Comput. Simul. 81(7), 883–898 (2011)
Mahdavi, A., Kundu, D.: A new method for generating distributions with an application to exponential distribution. Commun. Stat. Theory Methods 46(13), 6543–6557 (2017)
Khalil, A., Ahmadini, A.A.H., Ali, M., Mashwani, W.K., Alshqaq, S.S., Salleh, Z.: A novel method for developing efficient probability distributions with applications to engineering and life science data. J. Math. 2021, 1–13 (2021)
Ali, M., Khalil, A., Mashwani, W.K., Alrajhi, S., Al-Marzouki, S., Shah, K.: A novel fréchet-type probability distribution: its properties and applications. Math. Probl. Eng. 2022, 1–14 (2022)
Alzaatreh, A., Lee, C., Famoye, F.: A new method for generating families of continuous distributions. Metron 71(1), 63–79 (2013)
Marshall, A.W., Olkin, I.: A new method for adding a parameter to a family of distributions with application to the exponential and weibull families. Biometrika 84(3), 641–652 (1997)
Tahir, M., Zubair, M., Mansoor, M., Cordeiro, G.M., Alizadehk, M., Hamedani, G.: A new weibull-g family of distributions. Hacettepe J. Math. Stat. 45(2), 629–647 (2016)
Gupta, R.D., Kundu, D.: Theory & methods: generalized exponential distributions. Aust. N. Z. J. Stat. 41(2), 173–188 (1999)
Chaudhry, M.A., Zubair, S.M.: Generalized incomplete gamma functions with applications. J. Comput. Appl. Math. 55(1), 99–124 (1994)
Casella, G., Berger, R.L.: Statistical Inference, 2nd edn. Cengage Learning, Wadsworth Group (2021)
Muller, M.L.D., Dutang, C.: fitdistrplus: an R package for fitting distributions. J. Stat. Softw. 64(4), 1–34 (2015). https://doi.org/10.18637/jss.v064.i04
Roussas, G.G.: An Introduction to Probability and Statistical Inference. Elsevier, New York (2003)
Gamerman, D., Lopes, H.F.: Markov Chain Monte Carlo: Stochastic Simulation for Bayesian Inference, 2nd edn. CRC Press, New York (2006)
R Core Team: R: A Language and Environment for Statistical Computing. R Foundation for Statistical Computing, Vienna, Austria (2022). R Foundation for Statistical Computing. https://www.R-project.org/
Mudholkar, G.S., Srivastava, D.K.: Exponentiated weibull family for analyzing bathtub failure-rate data. IEEE Trans. Reliab. 42(2), 299–302 (1993)
McGilchrist, C., Aisbett, C.: Regression with frailty in survival analysis. Biometrics, 461–466 (1991)
Zarulli, V.: Unobserved heterogeneity of frailty in the analysis of socioeconomic differences in health and mortality. Eur. J. Popul. 32, 55–72 (2016)
Mathers, B.M., Degenhardt, L., Bucello, C., Lemon, J., Wiessing, L., Hickman, M.: Mortality among people who inject drugs: a systematic review and meta-analysis. Bull. World Health Org. 91, 102–123 (2013)
Aldeni, M., Lee, C., Famoye, F.: Families of distributions arising from the quantile of generalized lambda distribution. J. Stat. Distrib. Appl. 4, 1–18 (2017)
Nadarajah, S., Rocha, R.: Newdistns: an r package for new families of distributions. J. Stat. Softw. 69, 1–32 (2016)
Burnham, K.P., Anderson, D.R.: Model selection and multimodel inference. A practical information-theoretic approach 2 (2004)
Cavanaugh, J.E., Neath, A.A.: The akaike information criterion: background, derivation, properties, application, interpretation, and refinements. Wiley Interdiscip. Rev.: Comput. Stat. 11(3), 1460 (2019)
Acknowledgements
We are grateful to the editors and reviewers for their valuable feedback.
Funding
Not applicable.
Author information
Authors and Affiliations
Contributions
The idea and conceptualization of this study was conceived by AAM and ATG. AAM derived the model and its properties. ATG verified the computations. AAM drafted the paper. Both AAM and ATG edited the draft and the final manuscript. ATG supervised the whole study.
Corresponding author
Ethics declarations
Conflict of interest
The authors hereby state that they possess no Conflict of interest and do not have any Conflict of interest.
Ethics approval
Not applicable.
Consent to participate
Not applicable.
Consent for publication
Authors read and approved the final version of this article.
Presented data
This study’s findings are supported by comprehensive and clearly presented data, including tables, figures, and references.
Code availability
Not applicable.
Appendices
Appendix A: AR sampling with exponential distribution as proposal density
Appendix B: AR sampling with Weibull distribution as proposal density
Rights and permissions
Open Access This article is licensed under a Creative Commons Attribution 4.0 International License, which permits use, sharing, adaptation, distribution and reproduction in any medium or format, as long as you give appropriate credit to the original author(s) and the source, provide a link to the Creative Commons licence, and indicate if changes were made. The images or other third party material in this article are included in the article's Creative Commons licence, unless indicated otherwise in a credit line to the material. If material is not included in the article's Creative Commons licence and your intended use is not permitted by statutory regulation or exceeds the permitted use, you will need to obtain permission directly from the copyright holder. To view a copy of this licence, visit http://creativecommons.org/licenses/by/4.0/.
About this article

Cite this article
Menberu, A.A., Goshu, A.T. The Transformed MG-Extended Exponential Distribution: Properties and Applications. J Stat Theory Appl (2024). https://doi.org/10.1007/s44199-024-00078-8
Received:
Accepted:
Published:
DOI: https://doi.org/10.1007/s44199-024-00078-8