
Abstract
A series of earthquakes that struck Taiwan's southern Longitudinal Valley on September 17 and 18, 2022 severely damaged several buildings in Taitung and Hualien. The Chishang earthquake, which had a magnitude of ML 6.8 and a large foreshock with a magnitude of ML 6.6 the day before, was the mainshock in this sequence. The strongest intensity reported in the epicentral region during this earthquake sequence, which was 6 + , is the highest ever recorded since the Central Weather Bureau (CWB, renamed as the Central Weather Administration since September 15, 2023) revised its seismic intensity scale. National Taiwan University (NTU) has operated a low-cost earthquake early warning (EEW) system known as the P-Alert for a decade. In this study, we demonstrate the performance of the P-Alert network during the 2022 Chishang earthquake and the largest foreshock. The P-Alert network plotted shake maps during these earthquakes that displayed various values within 5 min. The high shaking areas on these maps were in good agreement with observed damages during this earthquake, providing valuable insights into rupture directivity, a crucial component of earthquake engineering. Individual P-Alert stations acted as on-site EEW systems and provided a lead time of 3–10 s within the blind zone of CWB. For the ML 6.8 mainshock, there was a lead time of at least 5 s, even up to 10 s, demonstrating their effectiveness in the blind zone. The P-Alert regional EEW system provided the first report about 9 s and 7 s after the mainshock and the largest foreshock occurrence, respectively, with estimated magnitudes of 5.74 and 5.67. The CWB system estimated magnitudes of 6.72 and 6.16 in the first report, respectively, about 7 s and 9 s after the earthquake occurrence. The timeliness of the two systems were not significantly different. Despite the effectiveness of the P-Alert network, data loss due to connection interruptions prompted us to develop a new compact data logger for improved data availability.
1 Introduction
Due to Taiwan's location at the junction of tectonic plates, it has a complicated tectonic environment and a high risk of earthquakes. Taiwan has witnessed several big earthquakes during the past few decades, including the 1999 Chi-Chi earthquake (Shin and Teng 2001), the 2016 Meinong earthquake (Wu et al. 2016; Rau and Liang 2017), and the 2018 Hualien earthquake (Rau and Tseng 2019; Wu et al. 2019). All these damaging earthquakes can be categorized into two distinct groups: those associated with active faults in western Taiwan, and those associated with the plate boundary in eastern Taiwan (Wu et al. 1999).
The recent local magnitude (ML) of 6.8 Chishang earthquakes on September 18, 2022, and the foreshock with an ML of 6.6 on September 17, 2022, belong to the latter group, that occurred at the boundary of tectonic plates in eastern Taiwan. As shown in Fig. 1, the epicenters of both events and the subsequent aftershocks are located in the southern section of the Longitudinal Valley (LV), which is a part of the Longitudinal Valley suture zone. At a convergence rate of up to about 8 cm/yr, this zone, which separates the Eurasian Plate (EP) from the Philippine Sea Plate (PSP), is one of Taiwan's active seismogenic structures (Yu et al. 1997). The most recent large-scale earthquake in the southern part of the LV suture, which had a magnitude of 7.3 and occurred in 1951 (Chen et al. 2008; Lee et al. 2008), was quite near the epicenter of the present earthquake sequence.

Tectonics map of Taiwan region and Longitudinal Valley area. Stars show the epicenter of the 17 September 2022 largest foreshock and the 18 September 2022 mainshock of the Chishang earthquake. The green and red line indicates the faults of Central Range Fault (CRF) and Longitudinal Valley Fault (LVF) respectively. The squares show the buildings damaged by the earthquake. The circles show the rest of the foreshocks (Orange circles) and the aftershocks (Red circles) sequence of this event. Also includes focal mechanisms provided by the Institute of Earth Sciences, Academia Sinica (AutoBATS) and U.S. Geological Survey (USGS W-phase). The foreshocks closely linked to the fault rupture of mainshock and aftershocks along the Longitudinal Valley were a consequence of the tectonic forces and geological conditions in the region
The southern section of the LV suture zone is composed of two different fault systems with distinct dipping orientations (Shyu et al. 2006, 2016). The western part is the west-dipping Central Range Fault (CRF) system, while the eastern part is the east-dipping Longitudinal Valley Fault (LVF) system. According to records, the LVF system has been more active than CRF in this region, but no large magnitude (M > 6.0) occurred in southern part of LVF in the last decade (Lee et al. 2023). However, the mainshock and largest foreshock of the Chishang earthquake was on a reverse fault dipping to the west and with a left-lateral component, according to focal mechanism solutions (Fig. 1) provided by the Institute of Earth Sciences, Academia Sinica (IESAS) (Jian et al. 2018) and the U.S. Geological Survey (USGS) (Hayes et al. 2009). The majority of the aftershocks also showed a high-angle west-dipping distribution, showing that this event happened on the CRF system rather than the more active LVF system (Lee et al. 2023).
The mainshock of the Chishang earthquake that occurred on the CRF system had its epicenter located in the Chishang area, 42 km north of Taitung City, according to the earthquake report by the Central Weather Bureau (CWB, renamed as the Central Weather Administration since September 15, 2023) in Taiwan. The maximum seismic intensity record was a 6 + on the new CWB scale in the Chishang area, which is the highest record since the updated seismic intensity scale was implemented by the CWB. Unfortunately, this earthquake damaged and collapsed several buildings, including some bridges that connected the eastern and western sides of the LV, in addition to leaving one person dead and numerous more injured. The distribution of the damaged buildings (Fig. 1) was correlated to the direction of the rupture of the mainshock, suggesting that directivity and other near-fault effects, may play an important role here.
A high-density seismic network is essential for carrying out near-fault studies. The P-Alert network (Fig. 2a) and the CWB seismic network (CWBSN, Fig. 2b) are just two of Taiwan's seismic observation networks. The P-Alert network is a low-cost earthquake early warning (EEW) system established by the National Taiwan University (NTU) team, which primarily comprises micro-electro-mechanical system (MEMS) sensors (Wu et al. 2013; Wu 2015). Currently, there are 770 stations in this network (Fig. 2a), all of which are Internet-enabled and capable of sending waveform data to the main server in real time. With just a few data missing owing to power failures, the P-Alert network largely functioned normally throughout this Chishang earthquake. Detailed shake maps depicting peak ground acceleration (PGA), peak ground velocity (PGV), and spectrum acceleration (Sa) were generated about one and a half minutes after the earthquake. In this regard, it is worth noting that the PGA and PGV shake maps provide a clear indication of the primary fault rupture direction. The ground motion values are found significantly higher in the rupture direction and significantly lower in the opposite direction. The same phenomenon has also been reported in previous studies of major earthquakes (Wu et al. 2016, 2019; Kanamori et al. 2017; Mittal et al. 2022).
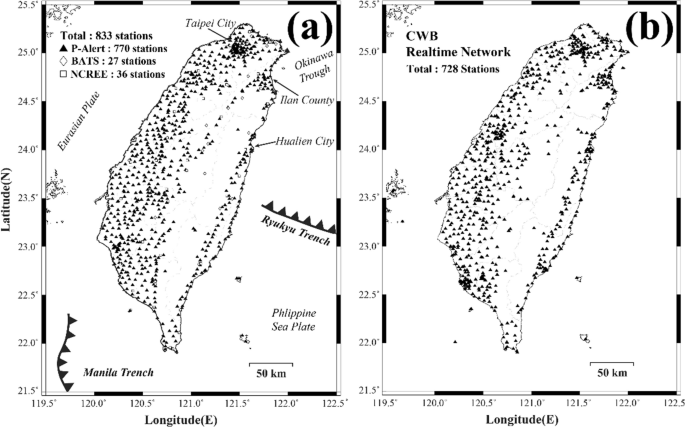
a Station distribution of the P-Alert network along with the Broadband Array in Taiwan for Seismology (BATS) and National Center for Research on Earthquake Engineering (NCREE) real-time strong-motion networks. b Station distribution of the Central Weather Bureau (CWB, renamed as the Central Weather Administration since September 15, 2023) real-time networks
In addition to creating shake maps, the data transmitted back to the central servers from each P-Alert sensor was also used to calculate regional EEW parameters including the epicenter and magnitude (Chen et al. 2015a, b). Furthermore, each P-Alert sensor is capable of providing on-site EEW alerts. When the relevant values exceed the pre-set threshold (Wu et al. 2011, 2013; Hsieh et al. 2015), alarms are issued to surrounding users to achieve on-site EEW.
In this study, we aim to analyze the performance of the P-Alert network during the Chishang earthquake, focusing on each of its functions. By examining each function of the network, we intend to provide a comprehensive assessment of its performance in terms of early warning capabilities, accuracy of earthquake detection, and timely dissemination of alerts. By conducting this performance analysis, we aim to contribute to the ongoing efforts in earthquake early warning systems and provide insights for further improvement of the P-Alert network. We believe that our findings will be of significant interest to the seismology community, researchers in earthquake early warning systems, and stakeholders involved in earthquake preparedness and response.
2 P-Alert network
The P-Alert network presently has 770 stations spread over the island, making it Taiwan's seismic network with the highest station density. Remarkably, densely populated areas in Taiwan boast an impressive station density, with approximately one station for every 5 km. When the station data shared with the Broadband Array in Taiwan for Seismology (BATS) and the National Center for Research on Earthquake Engineering (NCREE, https://santa.ncree.org/) is combined, the total number of stations exceeds 800, as depicted in Fig. 2a. The MEMS sensors utilized by the P-Alert network continuously transmit real-time waveform data to the central processing servers located at NTU and IESAS for further analysis and application. These central servers employ the Earthworm platform developed by the USGS (Johnson et al. 1995; Chen et al. 2015a, b), with its primary functions and architecture illustrated in Fig. 3.
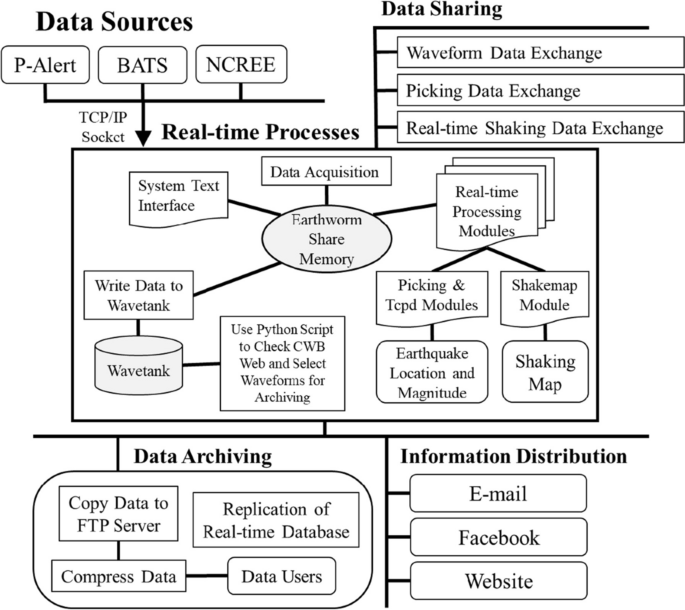
Architecture and Configurations of the existing P-Alert network system
The P-Alert sensor records three-component acceleration data at 16-bit resolution, a 100 Hz sampling rate, and a full dynamic range of ± 2 g. And it comes with a pre-installed 10 or 20-Hz low-pass filter to reduce high-frequency noise interference from the sensor itself. In addition to recording ground motion, P-Alert sensor also performs real-time monitoring for on-site EEW. The maximum displacement of the P-wave (\({P}_{d}\)) is calculated through double integrations and a 0.075 Hz high-pass filter (Shieh et al. 2008). Simultaneously, PGA and PGV are also calculated, and an alarm is issued when any of these values exceed the pre-set threshold (\({P}_{d}\) > 0.35 cm or PGA > 80 gal).
As previously stated, the P-Alert network can provide regional EEW in addition to on-site EEW. At NTU's central server, data from all sensors is gathered, and real-time algorithms for picking, association, and locating are applied to determine the earthquake's epicenter, magnitude, and depth, ultimately generating an earthquake information report file (Chen et al. 2015a, b). However, it is important to note that the CWB remains the sole official authority responsible for issuing public EEW messages in Taiwan. Consequently, the EEW messages produced by the P-Alert system serve research purposes and are not disseminated to the public. In the Chishang earthquake, the P-Alert regional EEW system provided the first report about 9 s and 7 s after the mainshock and the largest foreshock occurrence, respectively, with estimated magnitudes of 5.74 and 5.67. The CWB system estimated magnitudes of 6.72 and 6.16 in the first report, respectively, about 7 s and 9 s after the earthquake occurrence. The warning times of the two systems were not significantly different. Due to the current network density of the two systems being similar, this result is not surprising. However, in terms of magnitude estimation which relies on the measurement of \({P}_{d}\) (Wu and Zhao 2006), the P-Alert system appears to be less stable. This instability may be attributed to the higher noise level and low sensitivity to low-frequency signal of the sensor itself. The magnitude (\({M}_{pd}\)) estimation function is as follows:
where \(R\) represents the hypocenter distance in kilometers. The typical value range of \({P}_{d}\) is around 0.1 to 0.4 cm near epicenter (10 ~ 50 km). Sometimes it may reach 1.0 cm, but that's usually very close to the epicenter (< 10 km). According to Eq. (1), if the sensor measures \({P}_{d}\) as 0.1 cm when it should be around 0.2 cm, it results in a 0.5 lower estimated magnitude. Although \({P}_{d}\) also serves as one of the thresholds for on-site EEW, the warning result is binary, either “yes” or “no,” without specifying a numerical value. Consequently, the impact of noise in on-site EEW may not be immediately evident. However, if the noise level of P-Alert sensors decreases, the performance of the entire system will become more accurate.
3 Data availability
The quality of the P-Alert network's waveform recording has gradually improved during several recent major earthquakes. Since the Meinong earthquake in 2016 (Wu et al. 2016), only the early portion of the P-wave records could be collected from the near-source stations; however, during the Hualien earthquake in 2018 (Wu et al. 2019), entire records could be retrieved even from stations placed close to the ruptured fault. The data performance improved during the Chishang earthquake where only one station experienced a recording interruption during the largest foreshock (Fig. 4), and the data quality was comparable to that of the 2018 Hualien earthquake. But during the mainshock, more than half of the stations that were close to the ruptured fault experienced recording interruptions (Fig. 5). As each P-Alert station is equipped with 4 h of backup power and batteries are replaced regularly, the interruption is believed to be the consequence of in-situ network transmission equipment malfunctioning due to power outages, which prevented the transfer of P-Alert waveform data to the central servers. The solution to this problem will be discussed and presented later. It is also important to note that one elementary school (W01E, Chun-Rih Elementary School) with a P-Alert station suffered severe building damage, possibly even collapsing, which cut off the network link to the outside of the school.

A series of (a) acceleration and (b) velocity traces recorded by P-Alert during the largest foreshock of the Chishang earthquake. They represent the data quality of the network for north–south (NS), east–west (EW), and Z components

A series of (a) acceleration and (b) velocity traces recorded by P-Alert during the mainshock of the Chishang earthquake. They represent the data quality of the network for NS, EW, and Z components
The waveform interruptions observed during this event could have been influenced by factors such as an unstable internet connection or incomplete packets transmitted to the central servers, potentially contributing to the disruptions.
There were outages outside of the P-Alert network as well. Four stations of the Taiwan Strong Motion Instrumentation Program network (TSMIP) close to the same ruptured fault also suffered waveform interruptions, especially after the arrival of the S-wave (Fig. 6). This shows that the majority of the disruptions are local issues that require more comprehensive improvements to address rather than simply fixing the network connection of a single station.

A series of (a) acceleration and (b) velocity traces recorded by Taiwan Strong Motion Instrumentation Program (TSMIP) during the mainshock of the Chishang earthquake. They represent the data quality of the network for NS, EW, and Z components
4 Shake map
Since 2014, the P-Alert system has been able to provide detailed near-real-time shake maps (Hsieh et al. 2014). According to Wang et al. (2018), the P-Alert stations installed in basements show no difference in PGA compared to free-field records. The PGA ratio between P-Alert and free-field records for the stations installed on the 1st and 2nd floors is 1.07 and 1.52, respectively. These ratios can be used to account for building response when generating shake maps. The NTU team upgraded the system at the end of 2019 (Yang et al. 2021) to plot shake maps not just of PGA, but also of PGV, Sa, and the new seismic intensity scale recommended by the CWB in 2019. This allows disaster relief agencies, such as the National Science and Technology Center for Disaster Reduction (NCDR), to more accurately assess the actual damaged areas (Mittal et al. 2021). The shake map program of the P-Alert network is used extensively for plotting shake maps of other regions (Legendre et al. 2017; Mittal et al. 2018, 2019; Naik et al. 2023).
In addition to the variety of shake maps produced, the NTU team has also accelerated the updating speed of shake maps from one-minute intervals to 30-s intervals on various platforms. In addition to email and Facebook, Twitter (Since July 2023, it has been renamed as X) was added as an additional platform (Yang et al. 2021). For the Chishang earthquake, the mainshock occurred at UTC 06:44:15.2, and the upgraded P-Alert system posted the first shake map report on both Facebook and Twitter at UTC 06:44:18.8, just 3.6 s after the earthquake occurrence. Subsequently, the post was updated every 30 s until the final report was generated, 5 min after the first report, with 729 triggered stations in total. Figure 7a shows the final PGA shake map of the mainshock, where five anomalous points with relatively high PGA values (larger than 1 g) can be observed in the western plain of Taiwan. After further investigation, it was found that this was caused by unstable connections, which resulted in incomplete waveform packets, and thus the central server recorded abnormal values that did not exist. Figure 7b shows the corrected PGA shake map, with a much more reasonable distribution of PGA. In addition, when comparing the PGA (Fig. 7a, b) and PGV maps (Fig. 7c, d), even in the uncorrected version, it can be observed that the PGV map (Fig. 7c) does not exhibit the anomalous points that are present in the PGA map, which is much more reasonable. The reason for this difference might be that the integration process used to generate velocity waveforms smooths out abnormal acceleration values, making them less significant. Finally, the produced shake map is not far off from the corrected shake map, especially in the anomalous area of the western plain mentioned above. Therefore, compared to the PGA map, the PGV map is not only better at indicating the actual damaged areas (Mittal et al. 2021), but also more stable in operation.

Shake maps of the 18 September 2022 mainshock of the Chishang earthquake produced by the P-Alert network & CWB network. a The original Peak ground acceleration (PGA) shake map after all available P-Alert instruments have been triggered. b The corrected PGA shake map was generated from the archived P-Alert waveform data. c The original Peak ground velocity (PGV) shake map after all available P-Alert instruments have been triggered. d The corrected PGV shake map was generated from the archived P-Alert waveform data. e The PGA shake map derived from grid data provided by CWB. f The PGV shake map derived from grid data provided by CWB
Similar to the CWB network, the P-Alert system recorded a seismic intensity of 6 + for the first time after CWB updated its intensity scale. According to the earthquake report provided by CWB, the maximum ground shaking of the mainshock was recorded at the Chishang station (ECS) near the epicenter, with a PGA of 428.84 gal, a PGV of 96.58 cm/s, and an intensity of 6 + . The P-Alert system observed the maximum ground shaking at the Wan-An Elementary School (W39B), located only about 500 m away from the ECS station, with a PGA of 478.95 gal, a PGV of 93.55 cm/s, and an intensity also of 6 + . From the shake map, both PGA and PGV exhibit elliptical shapes with their major axes oriented parallel to the LV. Moreover, if we focus on the near-epicentral area (Fig. 6), it can be observed that the locations of damage are generally consistent with the high PGA (> 250 gal) and PGV (> 40 cm/s) zones. The high PGA and PGV zones extend from the epicenter towards the NNE direction, while the opposite SSW direction is not extended.
Comparing the PGA and PGV shake maps from P-Alert (Fig. 7a, c) and the CWB system (Fig. 7e, f), the overall patterns are similar. However, there are slight differences in the relative positions between the epicenter and the areas of highest shaking, especially in the PGA shake map. This disparity arises from the method used to generate the CWB shake map, which relies on ground motion prediction equations. This approach results in the distribution of the highest shaking areas being centered on the epicenter. Due to the high density of stations, the P-Alert system generates shake maps directly through interpolation of raw data from each station. While this may lead to less smooth shaking distribution, the high-resolution shake map produced by the P-Alert system allows us to infer that the primary fault rupture during the mainshock took place in the NNE direction relative to the epicenter. This information proves invaluable for disaster relief organizations as it allows them to identify potential disaster areas. Furthermore, despite the largest foreshock not resulting in significant damage, the shaking map enables us to deduce the fault rupture direction in the SSW direction.
5 On-site EEW
Within 10 to 15 s of an in-land earthquake occurring, the official agency CWB's EEW system can send out alerts (Wu et al. 2021), giving effective warning time to places beyond 40 km from the epicenter. The blind zone, also known as the area within 40 km, cannot, however, receive warning messages beforehand. Despite efforts to reduce the size of the blind zone in recent years, there are still certain areas that cannot receive effective early warnings. The P-Alert sensor features an integrated on-site EEW capability to address this problem. A warning alarm will be issued to the public in the area if either of the two warning thresholds (\({P}_{d}\) more than 0.35 cm or PGA greater than 80 gal) is exceeded (Wu and Kanamori 2005).
The performance of the on-site EEW provided by P-Alert stations in the area close to the epicenter of this event, including the mainshock and the biggest foreshock, is shown in Fig. 8. The performance is assessed based on lead time, which refers to the duration between the issuing of a warning and the onset of the most intense ground shaking. A longer lead time implies better performance. At the high ground shaking record sites of Guanshan and Luyeh, the biggest foreshock of ML 6.6 had a lead time of at least 6 s and even up to 3 s in the region of the epicenter. There were at least 5 s, and possibly up to 10 s, of lead time for the ML 6.8 mainshock in the vicinity of the epicenter. Based on the lead time evaluated from the stations, it is evident that no obvious difference in lead time is observed from the instruments placed along the two different fault systems LVF and CRF. Also, the aftershocks are not supposed to affect the lead time as the warning was issued during the mainshock and its foreshock.
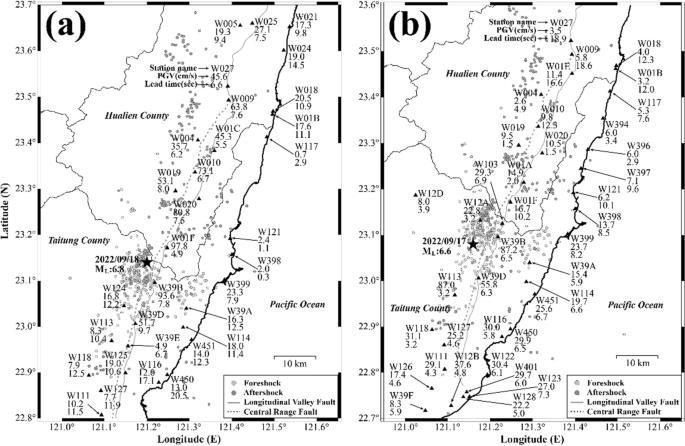
Distribution of early warning lead time based on PGV for the P-Alert network during the Chishang earthquake. a Lead time in 0918 mainshock. b Lead time in 0917 largest foreshocks
However, when we divide the measurement stations situated in the LV and Taitung City (distributed along the LVF and CRF) into northern and southern groups with the epicenter as the center, significant variations in lead times become evident. Taking the mainshock as an example, the average lead time for the group of stations located to the north of the epicenter is around 7.0 s, while the average lead time for the group of stations to the south is around 10.4 s. A contrasting pattern is observed in the records of the largest foreshock. The average lead time for the northern station group is around 8.6 s, whereas the average lead time for the southern station group is around 5.0 s. This distinction can be attributed to the fault's rupture direction, commonly known as the directivity effect. As mentioned earlier, the largest foreshock ruptured in the SSW direction, while the mainshock ruptured in the NNE direction. In simpler terms, when a station is situated in the rupture direction, it generally provides a shorter lead time compared to a station situated in the opposite direction. This indicates that peak ground motion in the rupture direction arrives more rapidly than in the opposite direction. The distribution of fore- and aftershocks shown in Fig. 8 is also correlated with the fault's rupture direction. Hence, fore- and aftershocks correspond, to some extent, with the two groups of stations divided by the epicenter.
Comparing these performances to the CWB regional EEW system, in the largest foreshock, the CWB system issued a warning at UTC 01:41:26, just 6.9 s after the origin time (UTC 01:41:19.1). With an S-Wave apparent velocity of 3.5 km/s, the blind zone extended approximately 24 km. Consequently, the first effective regional warning received by the P-Alert stations occurred at W019, W127, or W398. Thus, without on-site EEW, any station closer to the epicenter than these three stations did not have an effective lead time. In the mainshock, the CWB system issued a warning at UTC 06:44:25, 9.8 s after the origin time (UTC 06:44:15.2). The blind zone extended approximately 34 km. Again, any station closer to the epicenter than this distance did not have an effective lead time. In contrast, the P-Alert stations provided an average lead time of 5.9 s in the blind zone during the largest foreshock and 9.3 s during the mainshock.
6 Discussion
The P-Alert network has recorded several moderate earthquakes since the first P-Alert station was installed in 2010, including the 2013 Nantou (Hsieh et al. 2014) and Hualien earthquake (Wu 2015), the 2016 Meinong earthquake (Wu et al. 2016), the 2018 Hualien earthquake (Wu et al. 2019), and the most recent Chishang earthquake. The successful working and performance of the P-Alert network during these events are well-documented and proven in previous studies. During the past ten years, the number of P-Alert stations has gradually increased, from 581 stations in 2016 to 636 stations in 2018, and there are currently 770 stations. An average of 20 new stations are added to the network per year. The NTU team has also been working continuously to improve the system as a whole and develop new features, such as enabling the system to produce detailed shake maps (Yang et al. 2021) to provide a comprehensive earthquake damage distribution.
The Chishang earthquake was the first higher-magnitude earthquake following the upgrading of the P-Alert system in 2019. Although the system successfully generated an expected shake map roughly 2 s after the earthquake, some abnormal stations with a PGA of more than 1700 gal were observed on the mainshock's PGA shaking map in Taiwan's western plain region. After a re-examination of the waveform recordings of the abnormal stations, a new shake map was generated and the abnormal values were found missing from the corrected map. Further investigation of the waveform records revealed that only a small proportion of the stations had stopped recording after the arrival of the S-wave, while the rest were entirely normal. However, neither of the records showed values exceeding 1700 gal, which proved that the data returned by the P-Alert stations were accurate.
As the server for archiving waveform records and the server for generating shake maps were not in the same networking environment, and the server for generating shake maps had an unstable internet connection before the earthquake occurred, we attempted to simulate incomplete packets by appending another packet header to the original header to be identified as a data sector. Finally, we succeeded in reproducing waveform records with values exceeding 1700 gal. It was concluded that the cause of the anomaly was likely an unstable internet connection. To solve this problem, we suggested canceling the existing triggering packets to lower the throughput during an earthquake and stepping up packet data integrity checks to keep contaminated packets out of the computation. Since the beginning of 2023, these two solutions have been gradually implemented over the entire network, with a focus on data integrity verification, which has already been fully implemented on the receiving server. Since the implementation of these solutions, no other events with abnormal values in several subsequent events have occurred. Nevertheless, it remains to await an event of commensurate significance and magnitude to the 2022 Chishang earthquake in order to rigorously validate the efficacy of these solutions.
As demonstrated during many past significant earthquakes (Wu 2015; Wu et al. 2016, 2019; Legendre et al. 2017), the shake maps were successful in identifying the primary rupture direction of the fault for this earthquake, excluding the issue of abnormal value. The PGA and PGV shake maps of the mainshock revealed that the intensity distribution was significantly higher in the NNE direction of the epicenter and lower in the opposite direction. Although the largest foreshock had a higher intensity distribution toward the SSW direction of the epicenter, it was still parallel to the distribution direction of the mainshock. Therefore, the fault strike direction is likely to be NNE-SSW, which is parallel to the strike of LV and most of the faults within the LV. Furthermore, according to the focal mechanism solutions provided by IESAS and USGS, both the mainshock and the largest foreshock had two main nodal planes striking NNE-SSW and WNW-ESE. Additionally, the distribution direction of the majority of the subsequent aftershocks was NNE-SSW (Fig. 1). A close resemblance exists between the fault strike direction indicated by the focal mechanism solutions, aftershock distribution, and shaking map with the actual distribution of damage. Studies using inversion methods (Lee et al. 2023; Yagi et al. 2023) also suggested a similar fault rupture direction.
This earthquake was the first time that a seismic intensity of 6 + was observed after the CWB updated its seismic intensity scale, indicating the high intensity during this event. Along with the Chishang region close to the epicenter, towns along the fault rupture, like Fuli, Yuli, and Chunrih, also experienced intensity levels of 5 or higher. Several buildings and bridges in this area got damaged or even collapsed. According to reports, a three-story building collapsed in the downtown of Yuli, trapping four people. Fortunately, rescue teams quickly responded and successfully rescued those trapped, and there were no fatalities. Based on the PGV shake map and the distribution of damaged buildings, the majority of the collapsed buildings were located within the area of PGV greater than 49 cm/s and the rest were at least within the range of PGV larger than 30 cm/s. While the damage distribution is comparable to that following the 2018 Hualien earthquake, it differs significantly from the 2016 Meinong earthquake, which saw the majority of the damage concentrated in regions with PGVs higher than 17 cm/s. The conclusion drawn following the 2018 earthquake that structures in eastern Taiwan is more seismically resilient than those in western Taiwan is reconsidered in light of this difference in damage distribution. The thicker sediment layers on the Tainan Plain compared to the eastern region may also be a contributing factor.
The one of P-Alert stations with code W01E was installed in the office of Chun-Rih Elementary School, Hualien got damaged during this earthquake. According to the investigation by NCREE (Chou et al. 2023), the collapsed structure of Chun-Rih Elementary School in this event was the corridor connecting to the teaching building. Although the main building was not collapsed, it caused communication difficulties for the school and also prevented records of P-Alert stations from being fully transmitted to the central server.
Despite the P-Alert station having backup power for up to 4 h, the overall system can still experience significant loss of valuable waveform records if external transmission is blocked, particularly in the vicinity of the earthquake epicenter and fault zone. To address this issue, the NTU team is currently developing a compact data logger, which will be low-cost as well. This logger will have the capability to monitor the power supply and network connection status. When a network connection is lost, the data logger will automatically initiate archiving of waveform records in local storage. Once the network connection is restored, the archived records will be transferred back to the main server. This innovative solution aims to enhance data archiving completeness during normal operations, reduce the occurrence of data gaps, and prevent data interruption following a destructive earthquake event. To summarise, the P-Alert network's functionality was once again validated after the 2022 Chishang earthquake, which caused considerable damage in southeastern Taiwan. In terms of regional alerts, the P-Alert network worked similarly to Taiwan's official CWB EEW system, triggering 6 to 7 s after the mainshock and the largest foreshock and reaching convergence in about 10 s. In terms of on-site EEW, the system provided 3 to 6 s of lead time for the greatest foreshock in the close epicenter area. During the mainshock, it provided 5 to 10 s of lead time. Furthermore, in 2019, the NTU team changed its real-time shake map technology, and this event served as a platform for testing the new system. The updated system was able to provide the first report triggered by 6 stations on Facebook and Twitter within 2 s after the earthquake, and the final report triggered by a total of 729 stations within 5 and a half minutes after the earthquake. Besides providing various shake maps, the timeliness of the system has indeed been improved. This real-time information can be provided to disaster response agencies as a basis for deploying rescue resources.
7 Conclusion
After the P-Alert system update in 2019, the Chishang earthquake is the biggest earthquake recorded by the P-Alert network. The network performed well in terms of shake maps, on-site warning, and regional performance. For the Chishang earthquake, the mainshock occurred at UTC 06:44:15.2, and the upgraded P-Alert system posted the first shake map report on both Facebook and Twitter at UTC 06:44:18.8, just 3.6 s after the earthquake occurrence. Subsequently, the post was updated every 30 s until the final report was generated, 5 min after the first report, with 729 triggered stations in total. During the Chishang earthquake, the P-Alert regional EEW system provided the first report about 9 s and 7 s after the mainshock and the largest foreshock occurrence, respectively, with estimated magnitudes of 5.74 and 5.67. The CWB system estimated magnitudes of 6.72 and 6.16 in the first report, respectively, about 7 s and 9 s after the earthquake occurrence. The warning times of the two systems were not significantly different.
The P-Alert network provided substantial lead times for EEW warnings in the region of the epicenter. During the largest foreshock with a magnitude of ML 6.6, high ground shaking record sites like Guanshan and Luyeh perceived a lead time of at least 6 s, extending up to 3 s in some cases. Similarly, for the ML 6.8 mainshock in the vicinity of the epicenter, there was a lead time of at least 5 s, possibly even up to 10 s. These lead times were observed within the blind zone of the CWB regional warning system, demonstrating their remarkable effectiveness. When considering the entire network of P-Alert stations, they provided an average lead time of approximately 5.9 s within a 24 km blind zone during the largest foreshock. For the mainshock, with a 34 km blind zone, the P-Alert stations offered an even more substantial average lead time of approximately 9.3 s. These lead times, achieved within areas where the CWB regional warning system may not be as effective, highlight the valuable contribution of the P-Alert network to EEW system.
When comparing the PGA and PGV shake maps obtained from the P-Alert system and the CWB system, it is evident that the overall seismic patterns align closely. Notably, the P-Alert system recorded a seismic intensity of 6 + for the first time, following CWB's update to its intensity scale. According to the earthquake report provided by CWB, the highest ground shaking during the mainshock was recorded at the Chishang station (ECS), located near the epicenter. This station reported a PGA of 428.84 gal, a PGV of 96.58 cm/s, and an intensity level of 6 + . Remarkably, the P-Alert system observed the maximum ground shaking at Wan-An Elementary School (W39B), which is situated only around 500 m away from the ECS station. At this location, the P-Alert system recorded a PGA of 478.95 gal, a PGV of 93.55 cm/s, and, notably, an intensity level also reaching 6 + . These results emphasize the accuracy and sensitivity of the P-Alert system in recording earthquake data, as it closely matched with the data recorded by the CWB system, especially in the proximity of the epicenter.
Overall, the P-Alert network offers valuable warning features as well as real-time shake maps for disaster prevention and relief. This event, however, has revealed the P-Alert network's existing flaws. Compared to the 2018 Hualien earthquake, the P-Alert observation network provided many valuable near-fault records. When external communication is interrupted, the existing P-Alert stations will inevitably lose those records. Overcoming this problem is a long-term aim that will be pursued.
Availability of data and materials
The strong motion waveform records from the P-Alert network used in this study can be downloaded at https://palert.earth.sinica.edu.tw/database/.
References
Chen KH, Toda S, Rau RJ (2008) A leaping, triggered sequence along a segmented fault: the 1951 ML 7.3 Hualien-Taitung earthquake sequence in eastern Taiwan. J Geophys Res Solid Earth. https://doi.org/10.1029/2007JB005048
Chen DY, Hsiao NC, Wu YM (2015a) The earthworm based earthquake alarm reporting system in Taiwan. Bull Seismol Soc Am 105(2A):568–579. https://doi.org/10.1785/0120140147
Chen DY, Wu YM, Chin TL (2015b) Incorporating low-cost seismometers into the central weather bureau seismic network for earthquake early warning in Taiwan. Terr Atmos Ocean Sci 26(5):503. https://doi.org/10.3319/TAO.2015.04.17.01(T)
Chou CC, Wu CL, Chai JF, Yao GC (2023) Reconnaissance Report on Seismic Damage Caused by the 2022 Guanshan and Chihshang Earthquake Sequence, Taiwan, Technical Report of National Center for Research on Earthquake Engineering, NCREE-23-007, 229 pp
Hayes GP, Rivera L, Kanamori H (2009) Source inversion of the w-phase: real-time implementation and extension to low magnitudes. Seismol Res Lett. 80(5):817–822. https://doi.org/10.1785/gssrl.80.5.817
Hsieh CY, Wu YM, Chin TL, Kuo KH, Chen DY, Wang KS, Chan YT, Chang WY, Li WS, Ker SH (2014) Low cost seismic network practical applications for producing quick shaking maps in Taiwan. Terr Atmos Ocean Sci 25(5):617. https://doi.org/10.3319/TAO.2014.03.27.01(T)
Hsieh CY, Chao WA, Wu YM (2015) An examination of the threshold-based earthquake early warning approach using a low-cost seismic network. Seismol Res Lett 86(6):1664–1667. https://doi.org/10.1785/0220150073
Institute of Earth Sciences, Academia Sinica, Taiwan (1996) Broadband Array in Taiwan for Seismology. Institute of Earth Sciences, Academia Sinica, Taiwan. Other/Seismic Network. https://doi.org/10.7914/SN/TW
Jian P, Tseng T, Liang W, Huang P (2018) a new automatic full-waveform regional moment tensor inversion algorithm and its applications in the Taiwan area. Bull Seismol Soc Am 108(2):573–587. https://doi.org/10.1785/0120170231
Johnson CE, Bittenbinder A, Bogaert B, Dietz L, Kohler W (1995) Earthworm: a flexible approach to seismic network processing. IRIS Newsl 14(2):1–4
Kanamori H, Ye L, Huang BS, Huang HH, Lee SJ, Liang WT, Lin YY, Ma KF, Wu YM, Yeh TY (2017) A strong-motion hot spot of the 2016 Meinong, Taiwan, earthquake (Mw = 6.4). Terr Atmos Ocean Sci 28(5):637–650. https://doi.org/10.3319/TAO.2016.10.07.01
Lee YH, Chen GT, Rau RJ, Ching KE (2008) Coseismic displacement and tectonic implication of 1951 Longitudinal Valley earthquake sequence, eastern Taiwan. J Geophys Res Solid Earth. https://doi.org/10.1029/2007JB005180
Lee SJ, Liu TY, Lin TC (2023) The role of the west-dipping collision boundary fault in the Taiwan 2022 Chihshang earthquake sequence 1. Sci Rep 13(1):3552. https://doi.org/10.1038/s41598-023-30361-0
Legendre CP, Tseng TL, Mittal H, Hsu CH, Karakhanyan A, Huang BS (2017) Complex wave propagation revealed by peak ground velocity maps in the Caucasus Area. Seismol Res Lett 88(3):812–821. https://doi.org/10.1785/0220160178
Mittal H, Wu YM, Sharma ML, Lin TL, Yang BM (2018) Shake maps generation for Delhi region using two different algorithms. In Proceedings of the 16th Symposium on Earthquake Engineering, Department of Earthquake Engineering, Indian Institute of Technology, Roorkee, India. 20–22
Mittal H, Wu YM, Lin TL, Legendre CP, Gupta S, Yang BM (2019) Time-dependent shake map for Uttarakhand Himalayas India, using recorded earthquakes. Acta Geophys 67:753–763
Mittal H, Yang BM, Tseng TL, Wu YM (2021) Importance of real-time PGV in terms of lead-time and shakemaps: results using 2018 ML 6.2 & 2019 ML 6.3 Hualien, Taiwan earthquakes. J Asian Earth Sci 220:104936. https://doi.org/10.1016/j.jseaes.2021.104936
Mittal H, Yang BM, Wu YM (2022) Progress on the earthquake early warning and shakemaps system using low-cost sensors in Taiwan. Geosci Lett 9(1):42. https://doi.org/10.1186/s40562-022-00251-w
Naik SP, Mohanty A, Mittal H, Porfido S, Michetti AM, Yang BM, Gwon O, Kim YS (2023) The earthquake environmental effects (EEEs) of the 6th February 2018, Hualien earthquake (Mw=6.4): a contribution to the seismic hazard estimation in the epicentral area. Quatern Int 656:48–69
Rau RJ, Liang WT (2017) Introduction to the special issue on the 2016 Meinong, Taiwan, earthquake. Terr Atmos Ocean Sci. 28(5):I–III. https://doi.org/10.3319/TAO.2017.06.07.01
Rau RJ, Tseng TL (2019) Introduction to the special issue on the 2018 Hualien, Taiwan, earthquake. Terr Atmos Ocean Sci 30(3):281–283. https://doi.org/10.3319/TAO.2019.05.31.01
Shieh JT, Wu YM, Allen RM (2008) A comparison of τc and τpmax for magnitude estimation in earthquake early warning. Geophys Res Lett. https://doi.org/10.1029/2008GL035611
Shin TC, Liang Teng T (2001) An overview of the 1999 Chi-Chi, Taiwan, Earthquake. Bull Seismol Soc Am 91(5):895–913. https://doi.org/10.1785/0120000738
Shyu JBH, Sieh K, Chen YG, Chung LH (2006) Geomorphic analysis of the Central Range fault, the second major active structure of the Longitudinal Valley suture, eastern Taiwan. GSA Bull 118(11–12):1447–1462. https://doi.org/10.1130/B25905.1
Shyu JBH, Chuang YR, Chen YL, Lee YR, Cheng CT (2016) A new on-land seismogenic structure source database from the Taiwan Earthquake Model (TEM) project for seismic hazard analysis of Taiwan. Terr Atmos Ocean Sci 27(3):311. https://doi.org/10.3319/TAO.2015.11.27.02(TEM)
Wang KS, Chao WA, Mittal H, Wu YM (2018) Building effects on the P-Alert-based real-time shaking map determination. Seismol Res Lett 89(6):2314–2321. https://doi.org/10.1785/0220170252
Wu YM (2015) Progress on development of an earthquake early warning system using low-cost sensors. Pure Appl Geophys 172(9):2343–2351. https://doi.org/10.1007/s00024-014-0933-5
Wu YM, Kanamori H (2005) Rapid assessment of damage potential of earthquakes in Taiwan from the beginning of P Waves. Bull Seismol Soc Am 95(3):1181–1185. https://doi.org/10.1785/0120040193
Wu YM, Zhao L (2006) Magnitude estimation using the first three seconds P-wave amplitude in earthquake early warning. Geophys Res Lett. https://doi.org/10.1029/2006GL026871
Wu YM, Chung JK, Shin TC (1999) Development of an integrated earthquake early warning system in Taiwan-case for the Hualien Area Earthquakes. Terr Atmos Ocean Sci 10(4):719. https://doi.org/10.3319/TAO.1999.10.4.719(T)
Wu YM, Lin TL, Chao WA, Huang HH, Hsiao NC, Chang CH (2011) Faster short-distance earthquake early warning using continued monitoring of filtered vertical displacement: a case study for the 2010 Jiasian, Taiwan, Earthquake. Bull Seismol Soc Am 101(2):701–709. https://doi.org/10.1785/0120100153
Wu YM, Chen DY, Lin TL, Hsieh CY, Chin TL, Chang WY, Li WS, Ker SH (2013) A high-density seismic network for earthquake early warning in Taiwan based on low cost sensors. Seismol Res Lett 84(6):1048–1054. https://doi.org/10.1785/0220130085
Wu YM, Liang WT, Mittal H, Chao WA, Lin CH, Huang BS, Lin CM (2016) Performance of a low-cost earthquake early warning system (P-Alert) during the 2016 ML 6.4 Meinong (Taiwan) Earthquake. Seismol Res Lett 87(5):1050–1059. https://doi.org/10.1785/0220160058
Wu YM, Mittal H, Huang TC, Yang BM, Jan JC, Chen SK (2019) Performance of a low-cost earthquake early warning system (P-Alert) and shake map production during the 2018 Mw 6.4 Hualien, Taiwan, Earthquake. Seismol Res Lett 90(1):19–29. https://doi.org/10.1785/0220180170
Wu YM, Mittal H, Chen DY, Hsu TY, Lin PY (2021) Earthquake early warning systems in Taiwan: current status. J Geol Soc India 97(12):1525–1532. https://doi.org/10.1007/s12594-021-1909-6
Yagi Y, Okuwaki R, Enescu B, Lu J (2023) Irregular rupture process of the 2022 Taitung, Taiwan, earthquake sequence 1. Sci Rep 13(1):1107. https://doi.org/10.1038/s41598-023-27384-y
Yang BM, Mittal H, Wu YM (2021) Real-time production of PGA, PGV, intensity, and Sa shakemaps using dense MEMS-based sensors in Taiwan 3. Sensors 21(3):943. https://doi.org/10.3390/s21030943
Yu SB, Chen HY, Kuo LC (1997) Velocity field of GPS stations in the Taiwan area. Tectonophysics 274(1):41–59. https://doi.org/10.1016/S0040-1951(96)00297-1
Acknowledgements
The authors would like to thank Taiwan's National Science and Technology Council (NSTC) for funding the project that allowed this study to be conducted. Our research was also supported by the National Taiwan University (NTU) Research Centre of Future Earth. The NTU Research Centre for Future Earth was also financially supported by the Ministry of Education (MOE) in Taiwan through the Featured Areas Research Centre Programme as part of the Higher Education Sprout Project. The authors also thank to National Center for High-performance Computing (NCHC) for providing computational and storage resources. The GMT software from Wessel and Smith (1998) was used to plot the majority of the figures, for which we are appreciative. The author (HM) wishes to express gratitude to the Director of the National Centre for Seismology, Ministry of Earth Sciences, India, for allowing him to participate in this study. The authors are thankful to three anonymous reviewers and the editor for their constructive comments which helped in improving the manuscript.
Funding
This study was supported by the National Science and Technology Council, Taiwan.
Author information
Authors and Affiliations
Contributions
Conceptualization, Y.-M.W.; methodology, Y.-M.W., and B.M.Y.; software, B.M.Y.; validation, B.M.Y., H.M., and Y.-M.W.; formal analysis, B.M.Y.; investigation, B.M.Y., H.M. and Y.-M.W.; resources, Y.-M.W.; data curation, B.M.Y.; writing—original draft preparation, H.M., and B.M.Y.; writing—review and editing, B.M.Y., H.M., and Y.-M.W.; visualization, B.M.Y.; supervision, Y.-M.W.; project administration, Y.-M.W.; funding acquisition, Y.-M.W.; All authors have read and agreed to the published version of the manuscript.
Corresponding author
Ethics declarations
Ethics approval and consent to participate
Not applicable.
Consent for publication
Not applicable.
Competing interests
We declare that this manuscript is original, has not been published before and is not currently being considered for publication elsewhere. We confirm that the manuscript has been read and approved by all named authors and that there are no other persons who satisfied the criteria for authorship but are not listed. The authors have no conflict of interest. We further confirm that the order of authors listed in the manuscript has been approved by all of us. We understand that the Corresponding Author is the sole contact for the Editorial process. He is responsible for communicating with the other authors about progress, submissions of revisions and final approval of proofs.
Additional information
Publisher's Note
Springer Nature remains neutral with regard to jurisdictional claims in published maps and institutional affiliations.
Rights and permissions
Open Access This article is licensed under a Creative Commons Attribution 4.0 International License, which permits use, sharing, adaptation, distribution and reproduction in any medium or format, as long as you give appropriate credit to the original author(s) and the source, provide a link to the Creative Commons licence, and indicate if changes were made. The images or other third party material in this article are included in the article's Creative Commons licence, unless indicated otherwise in a credit line to the material. If material is not included in the article's Creative Commons licence and your intended use is not permitted by statutory regulation or exceeds the permitted use, you will need to obtain permission directly from the copyright holder. To view a copy of this licence, visit http://creativecommons.org/licenses/by/4.0/.
About this article

Cite this article
Yang, B.M., Mittal, H. & Wu, YM. P-Alert earthquake early warning system: case study of the 2022 Chishang earthquake at Taitung, Taiwan. Terr Atmos Ocean Sci 34, 26 (2023). https://doi.org/10.1007/s44195-023-00057-z
Received:
Accepted:
Published:
DOI: https://doi.org/10.1007/s44195-023-00057-z