
Abstract
Generation of quality data to aid planning, assessing the education performance, monitoring programs implementation and learning outcomes are the basic functions of the Education Management Information System (EMIS). This study examines the existing EMIS in the Pacific Island Countries PICs and proffers solution. A SWOT analysis on the selected PICs EMIS through the published technical reports and policy documents from government and donors’ between years 2000 and 2021, revealed that EMIS in PICs have not progressed beyond the stages of collecting demographic data and generating basic indicators. Fiji EMIS which has prospect of leading other PICs EMIS could only generate few indicators manually, and the findings indicate that these indicators are not being considered in decision making. To solve these defects, we proposed data-driven microservices architecture developed with MERN (MongoDB, ExpressJS, ReactJS, and NodeJS) stack on 13 NoSQL collections, tested with pseudonymised data from Fiji Ministry of Education (consisting of 98.6% Learners, 100.2% Schools and 99.5% Teachers in post). Our solution renders dynamic visualized production-ready education data and 28 UNESCO standard indicators to guide decision making and this may serve as a model for PICs EMIS.
Introduction
Education sectors have received increase attention in recent years on Artificial Intelligence (AI) in the areas such as profiling and prediction, intelligent tutoring systems, assessment and evaluation, and adaptive systems and personalization [1]. Learning Analytics on Learning Management System (LMS) in tertiary institutions have also started receiving researchers’ attention because of its importance in improving students' academic performances and aiding decision in policymaking [2, 3]. This advancement has uniquely separated plethora of information management systems from one another. Intelligent Information Systems (IIS) which combines AI advancement [4], database technologies and knowledge to exhibit intelligent behavior [5] in assisting users and other systems to retrieve or manipulate data [6, 7] becomes a game changer in allowing non-data analytics experts to make evidence-based decisions in complex situations [8]. Cruz-Domínguez and Santos-Mayorga [9] opined that IIS must possess the ability to efficiently store and retrieve large amounts of data needed to solve problems or make decisions. In spite of new contributions in IIS, there has been a growing demand for valid and reliable historical education data for planning, management of educational services and providing comparative information on pre and post-primary education performances in the developing countries [10].
The design specifications and operations of Education Management Information System (EMIS) are within the Ministries of Education country’s objectives and priorities, yet the efficacy is still largely low [11]. EMIS is described as a smart system embedded with functions of sensing, self-inducing and controlling in analyzing education situation and decisions on available data in a predictive or adaptive manner [12, 13]. However, a survey conducted by Asian Development Bank (ADB) in 2018 revealed that no EMIS in the Pacific Island Countries (PICs) appears to have progressed beyond the stages of collecting demographic data and reporting on sector indicators [14]. Those issues are still at the front burner in recent times, many countries have performed poorly in rendition of annual education indicators into the UNESCO education database.Footnote 1 The situation is the same in other regions, as reproducing 5 years old data without data discrepancy [10] remains a major challenge, since education data at the ministry is managed manually which oftentimes are characterized with data overlap and data gap. These problems are responsible for delay in publishing annual education digest report and affect utilization of education data in planning and decision making by relevant stakeholders (i.e., Ministry of Education, Government, Schools, Parents and donors etc.). [15] observed that developing an EMIS is complex and takes several years to arrive at a working system to accommodate all stakeholders’ needs. EMIS implementation design models has received less attention and scholarly articles are limited in the public domain. One of the PICs EMIS reference most is Fiji EMIS (FEMIS). FEMIS became popular in 2017 following the world bank recognition for its evolving affordable school-centered integrated web solution [16]. However, Abdul-Hamid [17], Saraogi et al. [18] identified some weaknesses in FEMIS and these include:
-
i.
Architectural design deficiency (FEMIS is being used to manage the allocation of school grants and provision of vouchers to students against the generation of education statistic data which cater for education performances),
-
ii.
Ineffective use in decision processes such as policy making and evaluation,
-
iii.
Manual generation of a few education indicators,
-
iv.
Lack of built-in validation mechanism which reduces the productivity of quality data analysts on data preparation and
-
v.
Login security vulnerabilities among other weaknesses.
To solve these defects, this paper proposes a modern web-based EMIS termed “Intelligent EMIS (IEMIS)” for PICs through the lens of FEMIS’ weaknesses. The proposed solution is built on microservices architecture framework using MongoDB, ExpressJS, ReactJS, and NodeJS (MERN) stack. These technologies are free, open-source, cross-platform, JavaScript and implemented on 13 NoSQL collections of pseudonymised dataFootnote 2 consisting of 98.6% Learners, 100.2% Schools and 99.5% Teachers in post for the Year 2020 Academic Session. The NodeJS and ExpressJS bind web backend together with MongoDB (NoSQL database) which has an expressive query language, indexing for fast lookup and aggregation that provides powerful ways to access and analyze data and ReactJS handles the frontend that the users see and interact with [19]. The rest of the paper is organized as follows: “Evolution of EMIS in PICs” Section presents an overview of the related works on the evolution of Pacific EMIS and MERN stack underlying concept. “MERN Stack Concept” Section presents design methodology and implementation. Followed by result discussion and conclusion in Section “Design Methodology and Implementation” and “Discussion”, respectively.
Evolution of EMIS in PICs
Desktop Solution Era
Samoa EMIS (SEMIS) was built on the Microsoft Access system in 2001 with a data warehouse put in place to create various modules of data capturing in line with the Ministry of Education needs and demands [20] and there has not been any upgrade till now. Pacific Island Nation Evaluation Analysis Policy and Planning Leveraging Education Statistics (PINEAPPLES) built on Microsoft SQL Server and compatible with Microsoft applications became the Solomon Islands EMIS (SIEMIS) in 2004 [21]. Between 2004 and 2005 Microsoft Access System and Excel were used to manage education data in Papua New Guinea Education Management Information System (PNG EMIS) [22]. Fiji had three main standalone databases built on MySQL, namely SIMS (School Information System), FESA (Education Staffing Information System) and LANA (Literacy and Numeracy Assessment System) [18]. This desktop phase was also characterized by non-communication among databases, data were manually collected, collated and fed into the database with many data issues and data cleansing becomes important before analysis could be done for data integrity which invariably wasted most of data quality analysts’ productivity time, thereby delay result in the production of education data for planning, decision making and respond to an international survey request from donors – International Development Partner (IDP).
Unfortunately, many developing countries’ EMIS are yet to advance from this stage to a web-based solution, in a survey conducted in the Q3 of 2020 by the UNESCO Institute for Statistics (UIS), 25% of pacific countries still uses spreadsheet packages, 88% who claimed to have an EMIS in place recorded 25% with online interface [10] for collecting data. Tables 1 and 2 show data management and collection mode respectively.
-
StatEduc is a built-in EMIS software developed with UIS involvement on system development.
-
Global ED*ASSIST or more commonly referred to as EdAssist is an integrated built-in EMIS software.
In a separate survey conducted by Global Partnership for Education (GPE) [23], showed 43% of developing country partners (DCPs) reported 10 out of 12 core education indicators to UIS and only 23% of countries worldwide currently report on the most important Sustainable Development Goals (SDG) global indicators with COVID-19 ravaging across the continents, the huge data gap is inevitable.
Integration of Web Presence in Pacific EMIS
FEMIS databases were upgraded to allow intranet for transmission of data into three (3) databases and later merged into two (2) physical databases vis-à-vis LANA and FESA, while information on SIMS database was migrated into FESA with a corresponding web application, FESA application maintains staffing data and learners’ detail and the LANA application maintains assessment data in the LANA database. Schools’ class lists are being administered in the LANA database using FEMIS and hardware design consists of a webserver to serve web pages and reports over the open Internet became available in 2017 [17, 18]. Vanuatu Government introduced Open VEMISFootnote 3 developed on FEMIS source code in the same year (2017) using the cloud hosting platform, while PNG adopted Oracle Application Express and old EMIS data was migrated into new web-based software development environment. Due to non-support for Discoverer by Oracle in 2015, PNG switched to Business Intelligence (BI) for querying, reporting, data analysis and web publishing. Solomon Islands adopted OpenEMISFootnote 4 and is in the process of recruiting consultant-project manager for managing its OpenEMIS.Footnote 5 Figures 1 and 2 show web interface login page of OpenEMIS and own developed EMIS.

Maldives -OpenEMIS login page

Fiji -FEMIS school login page
Challenges with Early Web Solution and the Modern Web App
Potency to manage data/information effectively gave rise to application of information technology in educational management [24]. Thus, early web solutions received low user satisfaction from inability to receive immediate feedback, a clear perception contrast and experience from desktop applications. Wang and Yang [25] attributed the synchronous interaction to traditional web application development model of request-wait-request, where browser renders blank pages until the server returns data pages which made user’s experience with desktop application different from early web solution. The emergence of Ajax (Asynchronous JavaScript and XML)Footnote 6 in public in 2005 enhances the page rendering performances and the web2.0 application based on Ajax became a powerful competitor to Java-based desktop application.Footnote 7 A new era from static to dynamic web page became popular, companies such as Google, IBM, Oracle, Yahoo and other famous companies that started the Open Ajax projects promote the adoption of Ajax development in web application. The built-in XMLHttpRequest "fetch()" function within JavaScript introduced around 2017 allowed the execution of Ajax on webpages to load content onto the screen without refreshing the page.Footnote 8
With the explosion of web-enabled devices, Almeida and Monteiro [26] observed that users' web browsers and devices determine how web pages are rendered, this development forced the web application solutions to migrate to responsive web design that can adapt to the users' technology platforms such as user personal preferences, screen resolutions and internet connection speed. Nowadays, web-based application development has undergone a transformation with many cross-platforms, high-performance and open-source framework such as ASP.NET Core versions (.NET 5 released in November 2020Footnote 9), Ruby on Rails, Cake PHP, Laravel, Aftertaste, Spring Web MVC,Footnote 10 Django, LAMP stack (Linux, Apache, MySQL or MongoDB, PHP) and MERN stack etc.
Modern Web Application with MERN Stack
Web apps are developed by widgets for quicker loading, interactive, mobile-responsive and Single Page Application (SPA). Researchers’ contributions in modern web development showed that MEAN (MongoDB, Express.js, AngularJS, and Node.js) and MERN (MongoDB, Express.js, ReactJS, and Node.js) stack framework are simple to learn, flexible, faster and more suitable for web-based application than LAMP stack framework [27, 28]. To support these claims, [27] designed and implemented real-time digital signage system (DSS), which supports handling real-time tasks like urgent/instant messaging, system status monitoring and conventional digital signage Content Management System (CMS) service tasks with both MEARN (ME(A + R)N) stack which performed better and render fetch data faster than DSS implemented with LAMP stack.
Aggarwal and Verma [29] compared two of the most popular and extremely powerful stacks used in the development of modern web applications MEAN and MERN stacks JavaScript framework, noticeable difference is AngularJS (supported by Google Company and uses TypeScript coding and Model View Controller (MVC)) and React.js (a Facebook initiative written in JavaScript and based on Virtual DOM (Document Object Model)). A comparison between both stacks showed that MEAN stack is a better option for large-scale applications with better productivity in design and operations because it is a complete framework. However, MEAN data flow is bidirectional which connotes a change in the user interface (UI) automatically changes the model state.Footnote 11 In contrast, MERN stack is preferred for fast development of small-scale applications and suitable for cases that are JSON-heavy, cloud-native, dynamic web interfaces.Footnote 12 Unlike MEAN, it has unidirectional data binding which provides better data overview in managing large projects. React.js is not a framework but a JavaScript library, this lowers its productivity as it is being used in conjunction with 3rd party libraries and remains the most popularly used stack by developers [30, 31].
MERN is being adopted in many of the recent modern web application research works. Bagade, et al. [32] developed the Farmer Portal System with MERN Stack, a modern web application that helps farmers to directly connect with the seller and also deploys a chatbot to clear some of customers doubts. Real-Time BPMN Website web application developed with MERN Stack by Handoyo, et al. [33], helps several users to make BPMN diagrams collaboratively. Deepika, et al. [31] implemented a Virtual Assistant AI-powered RASA framework with MERN stack, a web solution that was demonstrated with virtual C laboratory, and is accessible by the students anywhere with capacity for simulated laboratory assistants to help students solve problems faced during an experiment, which in turn reduces laboratory assistants spent time for solving students repetitive mistakes. Mishra, et al. [34] implemented Management Information System with MERN stack, the solution was specially designed for non-governmental organizations (NGOs) and the Government of India in reducing a lot of paper work by integrating database of registered NGOs to manage medium and small enterprises who want to apply for loan from the government. Analysis on search engine optimization techniques for a MERN stack web applications conducted by Shivani, et al. [35] revealed that Google page rank algorithm works best and yielded positive results which improve the ranking of application on search engines. The popularity of MERN in most recent web-based applications showed that it is more suitable when intensive interactive UI and faster development are required and thus, its adoption in the development of our proposed “IEMIS”.
MERN Stack Concept
The MERN architecture allows 3-tier architecture constructs (frontend, backend, database) entirely using JavaScript and JSON, Fig. 3 shows the interaction among the 3-tier architectures.

Full stack MERN stack architecture. Source: Clusterdb.com
Front End (React.js)
React.js is a client-side application that uses a declarative and versatile JavaScript library for building UI. Building complex UI is possible through Components (small, isolated and reusable pieces of code) which is then connected to backend server data, to render UI as HTML. React is suitable for handling stateful, data-driven interfaces with minimal code and support modern web framework and forms error handling.
Server Tier (Express.js and Node.js)
Backend (server-side application) is the backbone of any web app, this tier protects APIs (Application Programming Interfaces) against external attacks, authenticating users, enabling seamless interaction with databases, and handling user requests to collect and present required information. Express.js server-side framework runs inside a Node.js server. Express.js has powerful models for URL routing (matching an incoming URL with a server function) and handling HTTP requests and responses [19].
Database Tier (MongoDB)
MongoDB is a NoSQL database. It is document-oriented using collections and documents instead of traditional SQL databases tables and rows, where similar types of documents are grouped to form collections. MongoDB stores the data in binary JSON format (BSON-provides additional data types such as date and binary which is not supported in JSON) that allows the fast exchange of data between client and server. MongoDB works extremely well with Node.js [19], and makes storing, manipulating, and representing JSON data at every tier of application which makes it perfect for our proposed solution that allows individual records management with thousands of routine data manipulation operations.
Design Methodology and Implementation
Requirement Analysis
Basic EMIS requirements should house data for schools, learners, teachers and infrastructures, while a complete EMIS ideally should also include data on enrollments, attendance, completion rates, learning assessments, student health, finance, teacher characteristics, and some administrative statistics [36].
UIS [10] posited that among the four primary data sources used in calculating the SDG4 indicators such as household-based survey and assessment data; Annual School census data; school-based survey and assessment data; and EMIS or administrative data. The school/individual-based administrative data has the capacity to produce around half of the 43 thematic indicators. However, most PICs EMIS are not tailored towards this direction and this has been responsible for the low/no generation of indicators as evident in internationally comparable data in the UIS database.Footnote 13
In this paper, we proposed 13 NoSQL collections and implemented 11 of these collections as depicted in the relationship diagram, while the description on all 13 collections on Fig. 4 and Table 3 respectively, Table 4 presents comparison data on number of records used to populate the IEMIS and Fiji Ministry of Education, Heritage and Arts (MoEHA) published 2020 Academic Session data. (Fig. 5).

IEMIS Collections Relationship Diagram

IEMIS Model
The above table shows that pseudonymised data used were really close to the 2020 Academic Session data with deficit of 594 learners’ record, excess of 5 schools and 68 teachers shortfall. Due to data privacy policy in Fiji, only records that did not identify the record owners were released and used.
IEMIS Model
The activities diagram below captures, IEMIS users’ activities in addressing FEMIS’ weaknesses and other PICs EMIS’ challenges.
The IEMIS Model component are briefly discussed as follows;
Users
Seven (7) out of the proposed thirteen (13) collections are dedicated to IEMIS users for seamless data management, accessibility, data integrity and buy-in from stakeholders for effective use in planning and decision making, these users include Admins from the Ministry, District Heads, School Portal Admin, Teacher, Staff (non-teaching and other staff), Student and Parent. Figures 6 and 7 show all the IEMIS users and Admin login page with features on password reset and email notification.

Users in IEMIS

Admin Login Pages
Management Dashboard
Any interaction with IEMIS is through the users’ dashboard which is accessible after successful login with proper authentication and authorization. Figures 8 below depict Admin dashboard. Anyone with Admin role can manage all users and generate interactive education indicators or statistics report at School, District and Ministry Level for decision making.

Admin Dashboard
IEMIS CRUD Operations
IEMIS is built on the FEMIS schemas, this enable users to perform CRUD operations through a protected API route. Few attributes were carefully structured to assist in the generation of education indicators for example CohortA combines “Admission Year” and “Entry Class” the code snippets below.

Implementation on the middlewares that must be passed before the API endpoint to delete school can be executed.

Delete School controller implementation.

Figure 9 shows Students’ CRUD operations available on MoEHA Admin dashboard.

CRUD Operations
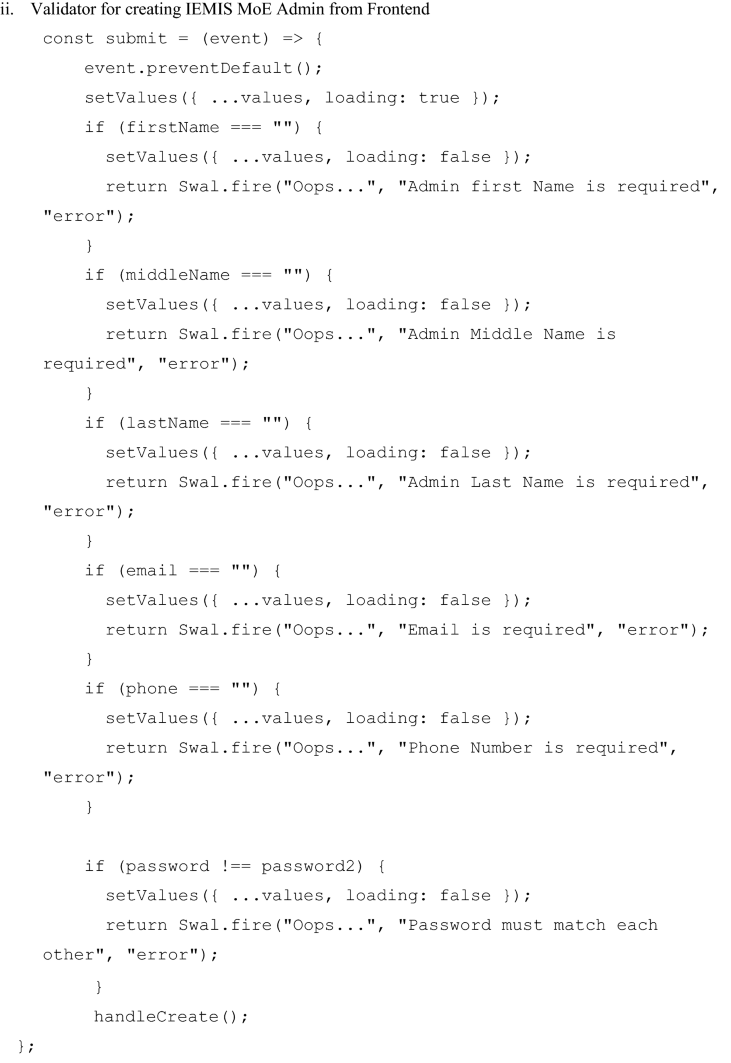
Validation checker (frontend and backend) protects the integrity of data to be stored or prevent missing required data to be sent to the database by ensuring the schema types match with mongoose schema design. The following code snippets perform a validation check and ensure data consistency in the database.
-
i.
Backend Validator for creating IEMIS MoE Admin


-
ii.
Validator for creating IEMIS MoE Admin from Frontend

IEMIS NoSQL Database
After a successful CRUD operations, MongoDB removes or stores data in a closer way to the applications which makes it highly scalable and providing superior performance even on low-resource devices [19]. Embedding and referencing design patterns are implemented in the IEMIS schemas, this improves fast retrieval of records, generation of statistics data and indicators with visualization to aid policy making. Figure 10 depicts a school record stores as JSON in MongoDB. (Fig. 11).

School record in School collection

IEMIS Education Statistics and FEMIS dashboard
Education Statistics summary
Depending on the users’ request, the phase allows generation of aggregated data on basic education statistics in a granular decision making form. Each of the attributes in the collection were carefully selected to produce every day statistic data needed for generating education indicators for day to day school routine activities and decision making.
Education Indicators:
According to Mendes [37], a good education indicator system is expected to provide accurate and precise information to illuminate the condition of education and contribute to its improvement. Thus, indicators are expected to assist policymakers in the formulation of school goals and translate those goals into actions.
PanapaFootnote 14 of PICs submitted that low response rates to international surveys reflected the lack of effective EMIS to produce data and indicators in line with international standards in the region. IEMIS implements 28 education indicators across;
-
i.
Access & Participation indicators used to analyze education coverage e.g. gross intake, net intake, adjusted net intake, gross enrollment, net enrollment etc.
-
ii.
Internal Efficiency to measure the number of years it takes a child to complete a particular cycle or level of education e.g. repetition rates, promotion rate, survival by grade, school life expectancy etc.
-
iii.
Resources Utilization indicators generate learners-teacher ratio.
Our IEMIS mathematical formula representation followed UIS Education Indicators Technical guidelines of November 2009, to produce real-time granular disaggregated education indicators in a dynamic visualized forms as shown on Fig. 12 and the FEMIS Score card on Indicators is depicted on Fig. 13.

Education Indicator

Fiji Records with UNESCO on 2 indicators. Source: http://uis.unesco.org/en/country/fj. (Last accessed 14/10/2021)
Knowledge Based System
Applying formula correctly and interpreting result remains another challenge to many countries due to lack of technical expertise, this is why an integration of Knowledge Based System (KBS) is necessary to intelligently guide policy makers in making decision. Proposed KBS is a form of AI that captures the knowledge and analytical skills of experts in a specific problem domain to support decision making [38]. Baierle, et al. [39] observed that the development of a KBS aided by rules can support the decision-making processes for sales department of a company, the authors illustrated the application with a simplified Management Information System model on Fig. 14.

Knowledge Management Chain
We proposed IEMIS KBS to enhance the intelligence and will be implemented in the second phase of this research work. The KBS model would allow interpretation of generated indicators and implication to the country’s education policy. The report could be on current year or previous years and Predictive Analytics API would be integrated into KBS for an AI enhanced EMIS.
The proposed model is captured on Fig. 15 and a brief explanation on 3 out 28 education indicators are provided on Table 5 below:

Proposed IEMIS KBS Business Model
Cloud Services architecture
To leverage on cloud services’ scalability and availability, IEMIS MongoDB Atlas (database-as-a-service) clusters is paired with Heroku,Footnote 15 one of the most popular Platform as a Service (PaaS) solutions for developers to build and deploy fully managed cloud applications services for both backend and frontend [40].
Results and Discussion
EMIS design specifications and operations are within ministry of education country’s objectives and priorities [36]. This flexibility has resulted into plethora of systems and deciding what system to use is a difficult and challenging task. A microservices architecture adopted in the development of proposed IEMIS allows data interoperability as no EMIS is optimally designed to produce all the datasets needed to meet the requirements of the education sector, by allowing the proposed system to separate portions of apps into logical sections that can be maintained, scaled, or updated independently. IEMIS provides a richer useful data require for decision making to improve the standard of education in the PICs through automated visual education indicators. FEMIS limitation on statistics data generation is enhanced with granular disaggregated with corresponding dynamic visualization charts. Decision-makers from schools to ministry can easily interpret their education data in real-time without the need for technical assistant or further analysis to understand the data. For instance, it is evident from Fig. 16 that no admission took place in the Year 2014 across the level of education while the trends showed Year 2020 recorded highest admission rate in the country. (Fig. 17).

Student by year of Admission

Granular Education data report
Authors have identified unavailable of data [41], lack of data integrity [42] and data not presented in a useful wayFootnote 16 as top reasons why data are not being used in decision making. EMIS in PICs is characterized by those reasons. IEMIS not only provides education data but also ensure granular disaggregated data with modern intelligent and dynamic visualization.
Automation on 28 education indicators makes IEMIS timely to PICs challenges in generating education indicators, the region has shown great concern and the data gap observed in the UIS database corroborated those challenges. However, since the population projected data falls outside the purview of the Ministry of Education. IEMIS implementation considers this constraint and allows indicator generation without population, EMIS officers can divide the result with corresponding population or historical data as they become available.
The security issue was also recognized as one of the weaknesses of FEMIS, with the use of UUID4 in IEMIS for salting and password hashing algorithm implementation the user credential is safe from attacker. A stateless authentication mechanism JSON Web Token (JWT) is also used for Auth implementation to protect API endpoints from unauthorized users.
Conclusion
IEMIS offers a modern fast non-blocking data-driven web-based application, the implementation prioritizes the availability of education data to facilitate planning & budgeting, policy formulation, decision making and routine management at the national, district and school level for PICs. It is imperative to note that pseudonymised data released from MoEHA is misleading and does not reflect the situation in the country. This level of distrust to share pseudonymised data (which does not compromise data privacy policy) would discourage researchers and EMIS developers to contribute towards the advancement of EMIS development if such practices continues.
3 out of 7 EMIS users’ dashboards (i.e., Ministry, District and School) have been implemented covering 11 collections (i.e., admin, district, school, staff, teacher, student, assessment, class, session population and parent) out of 13 proposed collections.
Cloud services (platform-as-a-service) such as servers and database-as-a-service remains cost-effective for web-based EMIS deployment because they offer high availability, scalability, elasticity and disaster recovery infrastructures. Migration to the cloud would relieve the government from the responsibility of managing infrastructures’ security and updates without impacting services availability and the problems of aftermath damage on physical ICT infrastructures witnessed during and after the impact of seasonal climate change disasters in the scattered PICs.
Further improvement on state management with Redux or its variants is required to prevent event listeners from Page reloads on screen resize, scroll and keyboard pop up on mobile devices.
Notes
http://uis.unesco.org/en/country/fj (Last accessed 14/10/2021).
Pseudonymisation of data means replacing any sensitive attributes which could be used to identify an individual with a pseudonym.
A cloud based information system for collecting, storing and disseminating basic data, statistics and indicators to support education planning and management in Vanuatu.
OpenEMIS is a built-in open-source EMIS software developed by Community System Foundation.
Microsoft ASP.NET AJAX, lunched by Microsoft Company, is the package of Ajax technology and visible Ajax application framework.
Jerome Sonnet, Charles Savage. OGC Web Service Soap Experiment Report 0.8 Document#03–014, Jan 2003.
References
Zawacki-Richter O, Marín VI, Bond M, Gouverneur F. Systematic review of research on artificial intelligence applications in higher education–where are the educators? Int J Educ Technol High Educ. 2019;16:39.
Lemay DJ, Baek C, Doleck T. Comparison of learning analytics and educational data mining: A topic modeling approach. Comput Edu: Artif Intell. 2021;2:100016.
Jacob J, Jha K, Kotak P, Puthran S. Educational data mining techniques and their applications. In 2015 International Conference on Green Computing and Internet of Things (ICGCIoT), 2015;1344–1348.
Shabbir J, Anwer T. Artificial intelligence and its role in near future. arXiv preprint arXiv:1804.01396 (2018).
Ras Z. Advances in intelligent information systems. NY: Springer; 2018.
Wiederhold G. The roles of artificial intelligence in information systems. J Intell Info Syst. 1992;1:35–55.
Collins C, Dennehy D, Conboy K, Mikalef P. Artificial intelligence in information systems research: A systematic literature review and research agenda. Int J Inf Manage. 2021;60:102383.
Ahmed M, Ahmad MS, Yusoff MZM. A collaborative framework for multiagent systems. Int J Agent Technol Syst (IJATS). 2011;3:1–18.
Cruz-Domínguez O, Santos-Mayorga R. Artificial intelligence applied to assigned merchandise location in retail sales systems. S Afr J Ind Eng. 2016;27:112–24.
UIS, "Data Innovation for Producing SDG 4 Indicators: An EMIS Metadata Global Analytical Report," UNESCO Institute for Statistics, P.O. Box 6128, Succursale Centre-Ville Montreal, Quebec H3C 3J7 Canada UIS/2020/LO/IP/65, September 2020 2020.
GPE. (2019). What can we learn from EMIS diagnostics? Available: https://www.globalpartnership.org/blog/what-can-we-learn-emis-diagnostics
Abdul-Hamid H. Data for Learning: Building a Smart Education Data System. World Bank Publications. 2017.
World-Bank. SABER annual report 2016 : smarter education systems for brighter futures (English). World Bank Group, 2017;114293 2017
Pillay HK, Velasco-Rosenheim RP, Thonden C. ICT for Better Education in the Pacific. Asian Development Bank, 2018.
Durnali M. Managing the Utilization of Technologies in Adult Education, Training, and Administration: The Case Study of Turkish MoNE. in Utilizing Technology, Knowledge, and Smart Systems in Educational Administration and Leadership. IGI Global 2020; 1–19.
Abdul-Hamid H, Data for Learning: Building a Smart Education Data System. World Bank Publications, 2017.
Abdul-Hamid H. Developing an Affordable and School-Centered EMIS: The Case of Fiji. ed, 2017.
Saraogi N, Mayrhofer DK, Abdul-Hamid H. Fiji Education Management Information Systems: SABER Country Report 2017. World Bank, 2017.
Hoque S. Full-stack React Projects. Birmingham, UK: Packt Publishing; 2020.
Mintz SM, Saraogi N. Samoa-Education management information systems. The World Bank 2015.
WorldBank G. Solomon Islands Education Management Information Systems: SABER Country Report 2015. World Bank, 2015.
World-Bank-Group. 2015, Papua New Guinea Education Management Information System : SABER Country Report 2015.
GPE. Meeting the Data Challenge in Education. Global Partnership for Education254/04/2021 2019.
Shah M. Impact of management information systems (MIS) on school administration: what the literature says. Procedia Soc Behav Sci. 2014;116:2799–804.
Wang H, Yang J. Research and application of web development based on ASP. NET 2.0+ Ajax. in 2008 3rd IEEE Conference on Industrial Electronics and Applications, 2008;857–860.
Almeida F, Monteiro J. The Role of Responsive Design in Web Development. Webology 14, (2017)
Khue TD, Nguyen TB, Jang U, Kim C, Chung S-T. Design and Implementation of MEARN Stack-based Real-time Digital Signage System. J Korea Multimedia Soc. 2017;20:808–26.
Porter P, Yang S, Xi X. The Design and Implementation of a RESTful IoT Service Using the MERN Stack. in 2019 IEEE 16th International Conference on Mobile Ad Hoc and Sensor Systems Workshops (MASSW). 2019, pp. 140–145.
Aggarwal S, Verma J. Comparative analysis of MEAN stack and MERN stack 2018.
Shetty J, Dash D, Joish AK, Guruprasad C. Review Paper on Web Frameworks, Databases and Web Stacks. Intern Res J Eng Technol (IRJET), 07: 5, 2020.
Deepika N, Bala MM, Kumar R. Design and implementation of intelligent virtual laboratory using RASA framework. Materials Today: Proceedings 2021.
Bagade S, Bhatt M, Gondhali S, Jadhav V. Farmer Portal System using MERN Stack 2021.
Handoyo R, Santoso LW, Setiawan A. Real-time BPMN website menggunakan teknologi MERN stack. Jurnal Infra. 2019;7:75–80.
Mishra SK, Kumar A, Kaundal A, Joshi U. Management Information System. Int J Res Eng Sci Manag. 2021;4:144–6.
Shivani G, Mutreja P, Nagrath P. Analysing search engine optimization techniques for a full stack web application. in IOP Conference Series: Materials Science and Engineering. 2021;012097.
Wyk CV, Crouch L. Efficiency and Effectiveness in Choosing and Using an EMIS. Available: http://emis.uis.unesco.org/wp-content/uploads/sites/5/2020/09/EMIS-Buyers-Guide-EN-fin-WEB.pdf 2020.
Mendes S. Progress and result indicators and their relevance for educational policy analysis. 2003.
Tripathi K. A review on knowledge-based expert system: concept and architecture. IJCA Special Issue Artif Intell Technique-Novel Approach & Practical Appl. 2011;4:19–23.
Baierle IC, Sellitto MA, Frozza R, Schaefer JL, Habekost AF. An artificial intelligence and knowledge-based system to support the decision-making process in sales. S Afr J Ind Eng. 2019;30:17–25.
Ansaharju J. Improving Software Development with Platform-as-a-Service Product–Using Heroku in Web Application Project. 2016.
Svensson RB, Feldt R, Torkar R. The unfulfilled potential of data-driven decision making in agile software development. in International Conference on Agile Software Development, 2019;69–85.
Beck B, Seeliger D, Kriegl JM. The impact of data integrity on decision making in early lead discovery. J Comput Aided Mol Des. 2015;29:911–21.
Author information
Authors and Affiliations
Corresponding author
Ethics declarations
Conflict of Interest
My coauthors and I do not have any interests that might be interpreted as influencing the research “Conflicts of interest: none”.
Ethical Approval
This article does not contain any studies with human participants or animals performed by any of the authors.
Additional information
Publisher's Note
Springer Nature remains neutral with regard to jurisdictional claims in published maps and institutional affiliations.
Rights and permissions
Springer Nature or its licensor (e.g. a society or other partner) holds exclusive rights to this article under a publishing agreement with the author(s) or other rightsholder(s); author self-archiving of the accepted manuscript version of this article is solely governed by the terms of such publishing agreement and applicable law.
About this article

Cite this article
Badru, L.O., Vasudevan, V., Lingam, G.I. et al. MERN Stack Web-Based Education Management Information Systems for Pacific Island Countries. SN COMPUT. SCI. 4, 70 (2023). https://doi.org/10.1007/s42979-022-01457-7
Received:
Accepted:
Published:
DOI: https://doi.org/10.1007/s42979-022-01457-7