
Abstract
The increasing data scales in today’s business sectors coupled with the necessity of risk management raise the importance of business intelligence tools as an integrated solution for the insurance industry. These tools have mostly been used to achieve effective risk management. Although methods of risk management in the insurance industry have been proposed many years ago, the research effort has primarily been focused on predictive analyses. This study aimed to investigate the role of business intelligence as a solution to illustrate its potential in risk management particularly for decision-makers in agricultural insurance. We hypothesized that this would make a preferable decision in uncertain conditions. Sample data from the online transaction process system of Iran agricultural insurance fund were preprocessed in SQL server. Multidimensional online analytical processing architecture was analyzed using Targit business intelligence tool. Our results identified financial risks that lead to a framework of controlling risk based on business intelligence in the agricultural insurance fund.
1 Introduction
Risk management is an effective tool to tackle uncertainties in the probability of an event’s occurrence that challenges decision makings. Many factors associated with risk management including business intelligence (BI) have the potential to be used to reduce such uncertainties. This challenge in decision making, appears to increase together with the expansion of globalization. Easy-to-use technologies for saving data and widespread access to the internet allow researchers and organizations to collect more data (Zhu et al. 2019). Because the origin, content, and display methods of most of these data vary and because they relate to diverse settings, such as commercial and financial, the current literature lacks enough findings concerning how these data are modeled and how they contribute to a company’s decision making strategy. Although methods for managing the uncertainties (e.g., managing liquidity related risks) in insurance have been proposed for many years, the research efforts, thus far, have primarily been focused on predicting outcomes based on the given dataset as well as its variables. While business intelligence has always been regarded as the highest priority for investment, companies have complained about the overflow of information and lack of access to the relevant data (Howson 2013). Hence, relevant data from companies’ data servers can be analyzed in favor of cost reduction (e.g., time and resources) by different BI algorithms that can also lead to controlling financial risks (Ghosh et al. 2018; Chen 2017). By implementing the risk management processes, many organizations aim to increase the impact of risk management activities and to build up value for stakeholders (Williams and Heins 1989). The necessity of using BI raised from the fact that financial enterprises including insurance companies like any other financial enterprises have analyzable data that can be used to modify knowledge-based risk management. In this study, our research purpose besides an investigative case study and providing an implementable framework was how business intelligence approaches can be used to risk management process using real-world data. This study particularly focused on the implication of BI approaches in improving decision making in agricultural insurance. We, therefore, investigated whether agricultural insurance data pertain to online transactional processing (OLTP) system contain the following elements: complete data of insurers, their properties specifications, locations, amount of paid compensations, reasons of damages, and bank account of insurers in the agricultural bank. However, previous studies have addressed a variety of problems in using BI, from leveraging organizational agility (Cheng et al. 2020) to improve decision making in other sectors such as transportation, health, telecommunications, etc. (Ain et al. 2019). This study draws on BI approaches (e.g., observation, reporting, and prediction) with a focus on the phases of risk management (e.g., detection analysis and risk control) to demonstrate how BI can improve provided services, preferable managing of uncertainties coupled with improving decision quality based on existing data in the company.
2 Literature review
The term BI was first referred to “an automatic system to disseminate information to the various sections of any industrial, scientific or government organization” (Luhn 1958). In recent years, BI has been known as an intended process through which a company can investigate and train to extract information from vast stocks of data to detect an obtainable opportunity while minimizing the threats associated with uncertainty (Cheng et al. 2020). Previous studies have shown that the progress of computational intelligence occurs in various fields (Wu et al. 2014; Ain et al. 2019), in which a survey of the significant areas and perspectives are presented in this section.
2.1 Early warning systems
Various studies have addressed the importance of early warning systems (EWS) as a method to control risk. By testing EWS in practice, in her study, Krstevska (2012) referred to macroeconomic models with the features of Macedonia’s economy and they proved that EWS is an advantageous solution that can be conducted in BI tools to forecast the risk of a financial crisis. In another study, Flores (2009) addressed the early warning in insurance utilizing stochastic optimization to find an investment policy for the management of a fund from the perspective of a risk-averse government. Early warning is also discussed for conveying the mechanisms of financial and macroeconomic supervision that regional monetary units can be considered in the BI policies to cultivate existing surveillance tools for improving crisis detection and prevention. In particular, they illustrated that the RMU might be beneficial as a tool for macroeconomic consultation (Castell 2009). Some studies argued their method in industrial applications and described a method for identifying logistic risks for small-to-medium size companies (Xie et al. 2009). Fuzzy cognitive map (FCM) is a mixed methodology based on neural network and fuzzy logic, which both are in the querying algorithms of the BI. Liu et al. (2006) developed an intelligent early warning system using fuzzy logic based on an integrated set of software metrics from multiple perspectives to make sponsors, users, project managers and software developers aware of many potential risks as early as possible. It has the potential to improve software development and maintenance to a great extent. Han and Deng (2018) combined artificial neural networks, fuzzy optimization and time-series econometric models in one unified framework to form a hybrid intelligent early warning system for predicting economic crises. Wang et al. (2018) proposed a financial crisis early warning monitoring algorithm based on FCM, and evaluated the effect of the algorithm based on the relevant data of listed companies in China; the experimental outcomes showed that the technique is efficient, economical, and timely and can practically reflect the crisis state of financial data.
2.2 Risk-based decision making
Employing computational intelligence for decision-making based on risk in information systems as supporting systems of decision-making has been studied since 1970 (Keen 1978; Sprague 1982). Some studies have taken advantage of the business intelligence to provide another application for analyzing the loan risk in financial modeling of pulp and paper industry (Warenski 2012). Some researchers have specifically addressed the assessment of value and risk in IT investment; by taking the resource-based view of the company and the perspective of the feasible option, they found that IT investments and their timing influence organizational downside risk (Otim et al. 2012). Such investments involving a complex series of stakeholders require attention to organizational policies. Some have studied the role of political pluralism in the expansion of commercial banks, especially from the perspective of risk management in India (Olson 1996). Industrial decision-making does not merely include multi-stakeholders, but it also includes multi-criteria. Some researchers have provided a risk assessment technique of multiple criteria for analyzing risk in safety by integrating the accepted features of the common failure mode, effects, and criticality analysis technique in the BI tools with taking into account economic variables in terms of risk and to minimize the total safety costs by defining a specific index called total risk priority number (Wu et al. 2014). Lakemond et al. (2013) dealt with a model for considering risk in product development, which is capable of initial assessments of risk and other challenges. Some of the neural networks study applications to assess reliability to reduce the project failure risk. Another application showed the value of artificial neural network models in the projects of public-private partnerships. The application was also used in the banking industry which included employing artificial neural networks to analyze credit cards applications which allow banks to effectively control their risk after the post-2008 bubble (Yazici 2011). Some researchers combined neural networks with text mining software to address financial risk management in daily trading. Another application was to use the artificial neural network models, which is one of the main algorithms in BI tools to manage the financial risk of over 7000 small companies in Italy. The results showed that when the method is unconnectedly designed according to size, geographical area, and business sector, the method prediction accuracy is noticeably higher for the smallest sized companies and especially those which are operating in central Italy (Ciampi 2013).
2.3 Game-based risk analysis
The role of Nash in offering game theory and studying the competitive strategy is significant (Nash 1950). The focus of this field is mainly on industrial risk management. Some researchers studied a complete information game model which examines emerging multi-risks in a project management environment by designing an effective algorithm to deal with the allocation solution based on Nash equilibrium that can also be reflected in the BI based plans, and an experiment is presented to show the usefulness of the proposed game method. The proposed solution methods can be employed to support decision-making in project risk management (Zhao 2009). Some extended the game theory models to probabilistic risk analysis in counter-terrorism activities. They carried out a comparative analysis of probabilistic risk analysis methods such as Bayesian networks, decision trees, and game theory that are the main algorithms in BI tools to get insights into the significant differences in assumptions and results. They found that assessing the distribution of potential attacker decisions is a problematic judgment, especially considering the adaptation of the attacker to defender decisions. Intelligent opponent risk analysis is an extension of decision analysis and sequential game theory that can be taken to decompose such judgments (Merrick 2011). And some used this theory to model vertical distinction in online advertising and found that a higher revenue can result in lower service prices (Lin et al. 2012).
2.4 Credit risk decisions
The basic task of the financial industry in risk management is to study the probability of default. Some researchers offered a scoring model for the Czech banks by means of linear discriminatory analysis, the initial probability of default is calculated through a scoring model in US banks by using linear discriminant analysis. They showed that even though all banks are well organized, there is still a high chance that “a financial crisis” will arise (Gurny 2009). Some others utilized the Six Sigma DMAIC methodology to reduce financial risk (Chen et al. 2012). Still, some others showed how scorecards can be used to predict the risk management of credit value of large banks (Wu 2010). Caracota et al. (2010) offered a scoring model for (small- and medium-size) enterprises that applied for loans. Some others studied the effectiveness of credit scoring of public enterprises (sponsored by the state) and showed how credit bureau scoring resulted in support for different strategies of risk escape or preference for less risk and greedy investments risks (Poon 2009).
2.5 Data mining in enterprise risk management
Data mining has turned into a very popular concept in statistical and artificial intelligence tools as well as plays a pivotal role in the BI tools for the analysis of sets of big data. Among the various risk management related studies, some researchers have applied the data mining tools to the financial affairs of companies, including fraud detection management, credit risk estimation, and performance prediction of the company (Shiri et al. 2012). Some argued that data mining in internal fraud renders preferable results compared to a single-variant analysis (Jans et al. 2010). Holton (2009) employed data mining for occupational fraud in auditing which the main focus is on detecting motivational aspects such as employee disgruntlement. Their proposed model predicts whether emails contain disgruntled communications, providing extremely relevant information not otherwise likely to be revealed in a fraud audit. The model can be incorporated into fraud risk analysis systems to improve their ability to detect and deter fraud. In other industries, data mining is employed to better predict the electricity supply cut-off, especially when caused by a storm (Nateghi et al. 2011). Some other studied data mining to support risk management in the supply chain; the recognized papers’ insights, gaps and future directions could inspire new investigation procedures with a view to managing the risks in the globalized supply chain environment (Ghadge et al. 2012; Shojaei and Haeri 2019). Some other studies have been conducted to reduce occupational damage risk using data mining (Murayama et al. 2011; Zhu et al. 2019).
The aforementioned studies, therefore, support the adaptation and utilization of the BI systems and their capabilities in wider organizational settings including sequential case studies. Although companies have been unsuccessful to capture the advantages of BI systems to their full extent. They mainly are pursuing means to leverage value from the carried out systems (Visinescu et al. 2017). However, prior studies do not have any comprehensive solution that discusses the ways related to adoption and utilization of BI system in practical and sequential stages in financial settings such as agricultural insurance, we present a utilitarian and sequential exploratory case study with a limited dataset in the agricultural insurance coupled with a suggested framework, which not only is a universal and reusable abstraction but it also delivers specific functionality that facilitates the development of BI applications, products, and solutions.
3 Methods
3.1 Description of the Iran agricultural insurance system
Iran agricultural insurance fund is the only active insurance company in the agriculture section in Iran. It was established in 1984 by agricultural bank which is one of the governmental banks in Iran. The initial aim of setting up this fund was to support the farmers and ranchers whose products were damaged by pests, diseases, drought, frostbite, and other natural disasters. Cotton and beet were first insured in 1984 as the first agricultural products ever insured, and at the time being, more than 153 products and activities are under insurance. During 30 years its responsibilities had been expanded into some main responsibilities, such as, investigating in any research in terms of increasing and improving agricultural products, holding courses to educate farmers and ranchers, investing in developing the company’s IT sections to become an IT-based system, like updating data servers to collect all relevant datasets such as farmers’ data, their properties location and specifications, paid compensations in each year, etc. (Agricultural insurance fund 2020). The historical reports have showed that the capacity of insurance is as follows (which has not fully been materialized due to the voluntary nature of insurance and also a limitation in financial resources): farming products (85 %), garden products (89 %), birds (100 %), products of livestock, aquatics and natural resources (95 %). Some of the indices of agricultural insurance development within the last 10 years (the 10 years ending in the agricultural year 2011–2012, comparative performance) are as follows:
-
Insurance of farming products; from 2 million hectares to 5.8 million hectares (2.9 times)
-
Insurance of garden products; from 12,000 hectares to 510,000 hectares (42.5 times)
-
Livestock insurance; from 2 million animals to 14 million animals (7 times)
As it can be seen from Fig. 1, the upward trend of agricultural insurance growth among signed contracts is significant. In Fig. 1 the ascending growth trend of insurers number within the last 10 years is shown, which amounts to more than 2 million at the end of the farming year 2011–2012:

Insurers’ number within 10 years (Agricultural insurance fund 2020)
Table 1 shows the overall figures of premium (including government’s share and insured person’s share) and compensation paid during the 10 farming years 2002–2003 to 2012–2013 (by million Rials).
3.2 Dataset description
The sample dataset contained 7740 insured agricultural lands and 21 numerical and categorical variables of each land, which is taken by the informatics section of agricultural banks from the online transaction processing servers of the agricultural insurance fund in 2013–2014. It consisted of lands that were cultivated by insured landowners with wheat in the Kermanshah region which has 5 branches of agricultural bank: Kozaran district, Shahid Rajaie, Keshavari Blvd, Mahidasht and Kermanshah. The online transaction processing servers of the company are collecting data of contracts, financial transactions, and insurance appraisers’ reports in all Iran agricultural banks in an integrated data center.
3.3 Model
The dataset consisted of two types of data: measures and dimensions. (1) The measures were numerical variables, which were organized in a fact table and contained foreign keys of the logical relationships. These variables included: insured ID, contract number, date, tax amount, paid compensation, the total amount of insurance, insurer’s share, insured person’s share, maximum obligation. (2) The dimensions or the system’s key performance indicators (KPIs) were categorical variables and contained primary keys; in our case study dimensions contain five tables, Solar Hijri calendar, Gregorian calendar, insurer profile, the insured person or company profile, insurance contract specifications. These two types of data based on the created database on the fund’s online transactions processing servers shape the data cube scheme (Fig. 2). Financial risks in agricultural insurance are generally related to unexpected financial outcomes that can cause many issues such as liquidity risk. A suitable mechanism to manage uncertainty in agricultural insurance must have the ability to accurately detect all kinds of risks by modeling all data in the agricultural insurance online transaction processing (OLTP) servers without impeding the performance of the platform. Therefore, a mechanism of insured individuals clustering through schemed data cube was presented. Using the clustering mechanism, we grouped data points together based on a set of parameters such as their similarities and relations. Despite that insured individuals may have various possessions in different regions, the logical relationships among the tables still have a mechanism to identify the users who have partially similar features. By investigating the created data cube, which was a multidimensional array of all involved variables the financial risk management purposes of the research were asserted.

Data cube scheme and logical relationships
In various relative analytics, we had three primary factors: hindsight, insight, and foresight. At the foresight level, predictive analyses were used to predict the outcomes, by taking the advantage of various machine learning (ML) algorithms (McNellis 2019; Ereth and Eckerson 2018). BI tools based on collected data can predict the future state of the variables. Two pivotal predicting algorithms in BI are regression and classification, which both are categorized under the same umbrella of supervised ML. The regression algorithm allows evaluating the mapping function of the input variables as numerical or continuous output variables known as measures. The, classification algorithm, on the other hand, attempts to assess the mapping function of the input variables to discrete or categorical output variables known as dimensions. These algorithms can be conducted based on several architects, the main two ones are multidimensional online analytical processing (MOLAP) and relational online analytical processing ROLAP; in the present work, the chosen architecture is MOLAP because it has some merits over ROLAP, such as, better performance in real-time analysis and dealing with a bigger amount of data. Creating MOLAP architecture has various steps (Fig. 3). We used SQL server analysis service (SSAS) 2012 to create tables out of OLTP datasets contains 5 dimension tables and 1 fact table represents the measures, then raising an analysis services multidimensional and data mining project in Microsoft visual studio 2010 and connect to the created database in SSAS and transfer all data, next generating data source view from all added tables and data, this is followed by forming logical relationships between fact table (with foreign keys) and dimensional tables (with primary keys), then creating dimensions’ attributes and hierarchies which leads to building data cube based on fact table that contains measures. In the penultimate stage, making a connection string from Targit (business intelligence tool) to the Microsoft visual studio. Finally, the created data cube is available in the Targit environment to make customized queries, comparisons, dashboard system, prediction, etc.
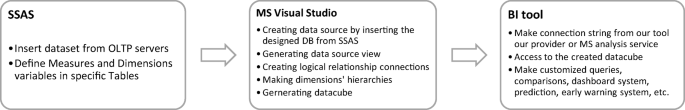
Steps in various platforms to create MOLAP architecture
4 Results
4.1 The applied MOLAP
Risk management phases, in general, were as follows: risk detection, risk analysis and risk control. According to the results obtained from designing the dimensions and measures existing in the data cube and experts’ comments, some financial risks were identified, which are regarded as the function of financing decisions of the company (Bandaly et al. 2018). All the next indicated graphs belong to 2014–2015 were the BI predictions, which were processed by the sample 2012–2013 dataset. Figure 4 shows the analyses and behavior trend of total earning insured amount in each premium issuing branches in the given region (Kermanshah which has 5 branches: Keshavarzi Blvd., Shahid Rajai, Kermanshah, Kozaran, and Mahidasht) during the farming year of 2013–2014 and the predicted year of 2014–2015. In the 2013–2014 graph, axis x represents the amount of money earned by each branch for insuring the farmers’ lands. Graph 2014–2015 is a prediction of the same trend in the next year in which Mahidasht and Kozaran branches would have better financial performance. This foresight is achieved by learning algorithms such as a neural network in the BI software engine depending on the measures of the dataset such as land area, number of bank accounts, insured savings, and insurance fee. Based on these figures’ managers can take actions to prevent the causes of decreasing trends in Kermanshah, Shahid Rajai branches and empowering positive impacts on increasing trends in the other branches. As it can be seen (Fig. 4) Kermanshah had better performance although Kozaran and Mahidasht could earn much more insurance fees since they cover vaster farmlands. The reason behind the performance of the Kermanshah branch in comparison to other branches was behind the fact that the manager’s main focus was no longer on acquiring new customers but on retaining old ones. Managers in Keshavarzi Blvd. and Shahid Rajai branches by carrying the same policies in the next year they would run the risk of losing their positions.

Forecasting amount of received money for insurance fee
In another analysis in Fig. 5, the predicted paid compensation amount in comparison with insurers’ received fee in different branches in the 2014–2015 farming year is shown. Due to the updating of new policies in terms of agricultural insuring tariffs in the share of government in 2014, all the districts except Kozaran would be faced with an increasing trend in the amount of paid compensation in the 2014–2015 farming year. This assessment and prediction are crucial at the beginning of each farming year and should be considered, because the budget of the fund is provided by the annual government budget, therefore the agriculture bank must send the estimated budget to the government for the upcoming farming year. Basically, each branch has its agricultural experts to advise farmers and after every report given by landowners they have to visit the reported land to evaluate the level of damage also farmers can take full advantage from their consultations, for example, the right form of ploughing or plowing a field which is one of the basic instructions of field management that can dramatically reduce the level of damage especially in the fields with a slope of higher than 20 degrees. Kozaran branch is the only branch with a higher insurance fee than the amount of total paid compensation. These figures demonstrate that they could use their experts to keep the level of damage low.

The paid compensation amount and insurers’ received fee prediction in 2014–2015 farming year
Through analysis indicated in Fig. 6, the trend of the production of each land (x-axis is the name of lands with the lowest damage) compared with the paid compensation amount (y, axis) in the 2014–2015 farming year is predicted. These 19 lands would be the most profitable lands among 7740 lands in the agricultural insurance fund in the region of Kermanshah which paid compensation amount to them is the lowest one, therefore their owners’ performance in controlling relevant risks is noticeable. From the marketing point of view and saving financial resources, finding lands with low damage level is essential because by investigating the reasons behind it, experts in the ministry of agriculture can encourage other farmers to follow those models and solutions to reduce the damage, consequently, the paid compensation amount would be decreased as well. Besides general risk management mechanisms such as adopting cropping techniques pest management systems, fertilization, irrigation that are considered in most of the land there are two extra common techniques among these 19 fields which are the owners not only used resistant variables (this is a crucial factor in farming because many farmers are using their product in each year as the next year seed which this can cause reduce the next year’s product more than 5 % in each year) but also they employed crop rotation strategy which can naturally build up soil fertility, crop yield, reduce soil erosion. Through BI customized queries drill down into the data cube entities finding differences and the reasons for managers in each branch is applicable. Being aware of the reasons behind each damage can solve or reduce it for upcoming farming years.

Profitable insured lands
Based on the principles of financial risk management, the agricultural insurance fund financial analysis process includes four steps: collecting financial data, providing financial balance sheets, providing financial ratios and creating financial measures based on the fund’s strategies (Agricultural insurance fund 2020). As you can see in Fig. 7, by employing business intelligence various algorithms the mentioned four steps financial processes are achievable through designing an analytical database and an appropriate data cube. Based on the financial records in the sample dataset of 2013–2014, the financial variables in 2014–2015 are predicted. High dependence on the government’s resources, high damage in products, and absence of participation on the part of the private sector, heightens the importance of management, financial risk analysis, and extraction of meaningful trends out of transactional data of the fund. The government’s share in the 2014–2015 farming year would be increased by 4 % as compared to 2013–2014. Upon the occurrence of minor damage in 2013–2014 (indicated by 2014 in Fig. 6), the amount of paid compensation would be increased by 24 times as compared to the previous year which can cause obvious liquidity risk. Since the outsourcing of financial risk is not possible for agricultural insurance fund in such farming years (e.g., with a high level of damage), the compensation should be paid through consultation with the government, which often is accompanied by payment deferment, absence of appropriate approaches for similar risky events for the following years. Failing in predicting financial outcomes would cause serious financial risks furthermore high dependence of agricultural insurance fund on the government budget can make fund fails in meeting its obligations unless the decision-makers could have an insight of the upcoming outcomes based on their existing data sets which are feasible by employing business intelligence approaches.

Predicted financial measures for 2014–2015 by analyzing 2013–2014 financial records
4.2 A framework of BI in relationship with risk management
As a foundation for developing applications whereby business intelligence developers can define a specific platform to prepare a groundwork for a data-driven company, frameworks have an undeniable role to play. For the sake of having a comprehensive framework, every database must be taken into account through which analyzing them the developers can achieve beneficial outputs and results for the next layer; the first layer of the framework (Fig. 8) is dedicated to all potential databases that could give the feeds for the customized queries in the interface layer, for example, the rate of rainfall in a particular area has unquestionable impacts on dry farming. In the integration layer, all valid datasets are extracted; data cleaning and cleansing, which aims to pass only proper data to the target is one of the actions in the transform step; in the last step of ETL through loading all created data marts are gathered to feed the data warehouse; data warehouse (DW) as the data provider of the BI algorithms is conducted by loading data marts in the analysis layer. In the application layers, all outputs of implementing BI based on multidimensional online analytical processing architecture are available, such as online analytical processing (OLAP), data cube, data management, key performance indicators monitoring, business process management. In the interface layer, all elements of our BI arsenal can be seen, which early warning system is the most important one that quite stands out and leads the whole framework to the knowledge layer with regard to controlling uncertainties and risk management.

The framework of BI system in agricultural insurance
5 Discussion
The scope of this paper focused on the implication of business intelligence as a solution to illustrate its potential in risk management particularly for decision-makers in agricultural insurance. Through multidimensional online analytical processing architect, we carried out series of predictions in terms of financial measures (numerical variables) for 2014–2015 farming year by analyzing a limited sample of financial and operational records consists of insured lands were cultivated with wheat in 2013–2014 in Kermanshah region and its 5 branches.
As risk analysis attempts at assessing an underlying true risk with quantified uncertainty limits (Goerlandt and Reniers 2018); indeed business intelligence solutions can determine how likely specific outcomes are if some aspects of the system are not precisely known. The presented BI system predicted the government’s share in the 2014–2015 farming year would be increased by 4 % compared to 2013–2014. Our results showed that upon the occurrence of minor damage in 2013–2014 (Fig. 6) the amount of paid compensation increased by 24 times compared to the previous year which can cause obvious liquidity risk. The relationship between a financial enterprise liquidity risk and its performance has been also shown by the previous studies (Pac et al. 2018). This is a vital analysis of the risk perspective since the outsourcing of financial risk is not possible for agricultural insurance fund in farming years with a high level of damage therefore, compensation should be paid through consultation with the government, which often is accompanied by payment deferment as well as the absence of appropriate approaches for similar risky events for the following years. Failing in predicting financial outcomes would cause serious financial risks; furthermore, high dependence of agricultural insurance fund on the government budget can make fund fails in meeting its obligations; hence, an implication of the aforementioned prescriptive analytic would be to allow agricultural insurance to use collected data from OLTP, contracts, climate parameters, etc., to predict future possible outcomes by employing proposed MOLAP architecture along with the customized framework suggested by the current study.
Furthermore, improved decision excellence is the pivotal expected upside of implementing BI systems. Specifically, common decision making methods in the Iran agricultural insurance fund as for: command, consult, vote, consensus (i.e., talk until reaching an agreement) can be replaced by BI algorithms to help agricultural insurance to become an insights-driven organization even when there is a paucity of relevant data. Take for instance, predicting 19 lands that would be the most profitable lands among 7740 records in the agricultural insurance fund in the given region is a good example of defining future strategies because their owners’ performance in controlling relevant risks is noticeable; therefore, by investigating the reasons behind it, experts in the ministry of agriculture can encourage other farmers to follow those models and solutions to reduce the damage, consequently, the paid compensation amount would be decreased as well.
This study had some limitations that need to be mentioned. Since we used real data from the online transactional processing of the fund, we couldn’t show all the possible results. The granted permission for receiving sample dataset was only for the 2013–2014 farming year, whereas at least 15 years of data is collected in the fund servers which can lead to more accurate results and a wide range of problems in terms of fraud detection, human resource management, etc., can be covered and analyzed. Furthermore, because of the insured persons, personals, insurance appraisers’ private privacy data, our ability to show the results was another important limitation.
6 Conclusions
To handle financial risk management numerous companies are struggling with becoming data-driven businesses. A financial enterprise like agricultural insurance is one of these enterprises that face financial risks through business intelligence analysis. Considering the nature of agriculture as an industry with unique conditions we can witness uncertainty in its sections and experts in these fields are dealing with the most uncertain factors therefore, altering the obsolete strategies in terms of being a data-driven company for agricultural insurance fund has to be categorized as a high priority goal. A practical contribution of this research was to demonstrate the benefits of business intelligence solutions regarding financial uncertainties. We showed employing business intelligence can dramatically decrease imprecise estimations caused countless uncertainties in agricultural insurance. In this experimental case study, we strove to illustrate the BI approaches to indicate three levels of analytics (e.g., hindsight, insight, foresight) which can lead to risk management’s stages (e.g., detection, analysis, control). The results of the analytical model of BI revealed four possible predictions to tackle financial risks. We also proposed a framework of BI system in agricultural insurance with the main focus on financial and operational risk management through which minor modifications can be employed in various financial enterprises.
References
Agricultural insurancefund (2020) Agricultural Insurance Fund, History and Responsibilities. In:Agriculture Bank Web Page. http://www.sbkiran.ir/about/tasks
Ain N, Vaia G, Delone WH (2019) Two decades of research on business intelligence system adoption, utilization and success – a systematic literature review. Decis Support Syst 125(April):113113. https://doi.org/10.1016/j.dss.2019.113113
Bandaly D, Shanker L, Şatır A (2018) Integrated financial and operational risk management of foreign exchange risk, input commodity price risk and demand uncertainty. IFAC-PapersOnLine 51(11):957–962. https://doi.org/10.1016/j.ifacol.2018.08.484
Caracota RC, Dimitriu M, Dinu MR (2010) Building a scoring model for small and medium enterprises. Theoret Appl Econ 17(9):117–128
Castell MRF, Dacuycuy LB (2009) Exploring the use of exchange market pressure and RMU deviation indicator for Early Warning System (EWS) in the ASEAN + 3 region. DLSU Bus Econ Rev 18(2):1–30
Chen CH (2017) Research on business intelligence with data mining applications. Int J Bus Econ Res 6(2):19. https://doi.org/10.11648/j.ijber.20170602.11
Chen YC, Chen SC, Huang MY, Tsai CL (2012) Application of six sigma DMAIC methodology to reduce financial risk: a study of credit card usage in Taiwan. Int J Manag 29:166–176
Cheng C, Zhong H, Cao L (2020) Facilitating speed of internationalization: the roles of business intelligence and organizational agility. J Bus Res 110(January):95–103. https://doi.org/10.1016/j.jbusres.2020.01.003
Ciampi F, Gordini N (2013) Small enterprise default prediction modeling through artificial neural networks: an empirical analysis of italian small enterprises. J Small Bus Manag 51(1):23–45
Ereth J, Eckerson W (2018) AI: The new BI. How algorithms are transforming business intelligence and analytics. Retrieved August, 1, 2019
Flores C (2009) Management of catastrophic risks considering the existence of early warning systems. Scand Actuar J 1:38–62
Ghadge A, Dani S, Kalawsky R (2012) Supply chain risk management: present and future scope. Int J Logist Manag 23(3):313–339
Ghosh P, Som S, Sen S (2018) Business intelligence development by analysing customer sentiment.2018 7th International Conference on Reliability, Infocom Technologies and Optimization: Trends and Future Directions, ICRITO 2018, 287–90. https://doi.org/10.1109/ICRITO.2018.8748517
Goerlandt F, Reniers G (2018) Prediction in a risk analysis context: implications for selecting a risk perspective in practical applications. Saf Sci 101 (October 2017):344–51. https://doi.org/10.1016/j.ssci.2017.09.007
Gurny P, Tichy T (2009) Estimation of future PD of financial institutions on the basis of scoring model. In: 12th International Conference on Finance & Banking: Structural & Regional Impacts of Financial Crises, 215–228
Han Y, Deng Y (2018) A hybrid intelligent model for assessment of critical success factors in high-risk emergency system. J Ambient Intell Humaniz Comput 9(6):1933–1953. https://doi.org/10.1007/s12652-018-0882-4
Holton C (2009) Identifying disgruntled employee systems fraud risk through text mining: a simple solution for a multi-billion dollar problem. Decis Support Syst 46(4):853–864
Howson C (2013)Successful business intelligence: unlock the value of BI & big data, 2nd edn. McGraw-Hill Osborne Media, New York. https://doi.org/10.1036/9780071809191
Jans M, Lybaert N, Vanhoof K (2010) Internal fraud risk reduction: results of a data mining case study. Int J Account Inf Syst 11(1):17–41
Keen PGW, Scott Morton MS (1978) Decision support systems: an organizational perspective. Addison-Wesley, Reading
Krstevska A (2012) Early warning systems: testing in practice. IUP J Financ Risk Manag 9(2):7–22
Lakemond N, Magnusson T, Johansson G et al (2013) Assessing interface challenges in product development projects. Res Technol Manag 56(1):40–48
Lin M, Ke X, Whinston AB (2012) Vertical differentiation and a comparison of online advertising models. J Manag Inf Syst 29(1):195–236
Liu X, Kane G, Bambroo M (2006) An intelligent early warning system for software quality improvement and project management.J Syst Softw 79(11):1552–64. https://doi.org/10.1016/j.jss.2006.01.024
Luhn HP (1958) A business intelligence system. IBM J Res Dev 2(4):314–319. https://doi.org/10.1147/rd.24.0314
McNellis J (2019) You’re likely investing a lot in marketing analytics, but are you getting the right insights? Gartner. https://blogs.gartner.com/jason-mcnellis/2019/11/05/youre-likely-investing-lot-marketing-analytics-getting-right-insights/
Merrick J, Parnell GS (2011) A comparative analysis of PRA and intelligent adversary methods for counterterrorism risk management. Risk Anal 31(9):1488–1510
Murayama S, Okuhara K, Shibata J, Ishii H (2011) Data mining for hazard elimination through text information in accident report. Asia Pac Manag Rev 16(1):65–81
Nash J (1950) Equilibrium points in N-person games. Proc Natl Acad Sci 36(1):48–49
Nateghi R, Guikema SD, Quiring SM (2011) Comparison and validation of statistical methods for predicting power outage durations in the event of hurricanes. Risk Anal 31(12):1897–1906
Olson DL (1996) Decision aids for selection problems. Springer, New York
Otim S, Dow KE, Grover V, Wong JA (2012) The impact of information technology investments on downside risk of the firm: alternative measurement of the business value of IT. J Manag Inf Syst 29(1):159–194
Pac R, Finan B, Pol M, Yi-kai, Chen (2018) Bank liquidity risk and performance 21(1). https://doi.org/10.1142/S0219091518500078
Poon M (2009) From new deal institutions to capital markets: commercial risk scores and the making of subprime mortgage finance. Acc Organ Soc 34(5):654–674
Shiri MM, Amini MT, Raftar MB (2012) Data mining techniques and predicting corporate financial distress. Interdiscip J Contemp Res Bus 3(12):61–68
Shojaei P, Haeri SAS (2019) Development of supply chain risk management approaches for construction projects: a grounded theory approach. Comput Ind Eng 128:837–850. https://doi.org/10.1016/j.cie.2018.11.045
Sprague RHJ, Carlson ED (1982) Building effective decision support systems. Prentice-Hall, Englewood Cliffs
Visinescu LL, Jones MC, Sidorova A (2017) Improving decision quality: the role of business intelligence. J Comput Inf Syst 57(1):58–66. https://doi.org/10.1080/08874417.2016.1181494
Wang Q, Hui F, Wang X, Ding Q (2018) Research on early warning and monitoring algorithm of financial crisis based on fuzzy cognitive map. Clust Comput 7. https://doi.org/10.1007/s10586-018-2219-7
Warenski L (2012) Relative uncertainty in term loan projection models: what lenders could tell risk managers. J Exp Theor Artif Intell 24(4):501–511
Williams AC, Heins RM (1989) Risk management and insurance. McGraw-Hill, New York
Wu D, Olson DL (2010) Enterprise risk management: coping with model risk in a large bank. J Oper Res Soc 61(2):179–190
Wu D, Dash S-H, Chen (2014) Business intelligence in risk management: some recent progresses. Inf Sci 256:1–7. https://doi.org/10.1016/j.ins.2013.10.008
Xie K, Liu J, Peng H, Chen G, Chen Y (2009) Early-warning management of inner logistics risk in SMEs based on label-card system. Prod Plan Control 20(4):306–319
Yazici M (2011) Combination of discriminant analysis and artificial neural network in the analysis of credit card customers. Eur J Financ Bank Res 4(4):1–10
Zhao L, Jiang Y (2009) A game theoretic optimization model between project risk set and measurement. Int J Inf Technol Decis Mak 8(4):769–786
Zhu X, Jin X, Jia D, Sun N, Wang P (2019) Application of data mining in an intelligent early warning system for rock bursts. Processes 7(2). https://doi.org/10.3390/pr7020055
Acknowledgements
Authors would thank the “Research and Development” department of the Agricultural insurance fund of Iran for the collaboration by giving access to financial and operational data.
Funding
Open access funding provided by Széchenyi István University (SZE).
Author information
Authors and Affiliations
Corresponding author
Additional information
Publisher’s Note
Springer Nature remains neutral with regard to jurisdictional claims in published maps and institutional affiliations.
Rights and permissions
Open Access This article is licensed under a Creative Commons Attribution 4.0 International License, which permits use, sharing, adaptation, distribution and reproduction in any medium or format, as long as you give appropriate credit to the original author(s) and the source, provide a link to the Creative Commons licence, and indicate if changes were made. The images or other third party material in this article are included in the article's Creative Commons licence, unless indicated otherwise in a credit line to the material. If material is not included in the article's Creative Commons licence and your intended use is not permitted by statutory regulation or exceeds the permitted use, you will need to obtain permission directly from the copyright holder. To view a copy of this licence, visit http://creativecommons.org/licenses/by/4.0/.
About this article

Cite this article
Amini, M., Salimi, S., Yousefinejad, F. et al. The implication of business intelligence in risk management: a case study in agricultural insurance. J. of Data, Inf. and Manag. 3, 155–166 (2021). https://doi.org/10.1007/s42488-021-00050-6
Received:
Accepted:
Published:
Issue Date:
DOI: https://doi.org/10.1007/s42488-021-00050-6