
Abstract
The effect of detonator placement on rock fragmentation by blasting was studied in the Kevitsa open-pit mine. Considering rock mass properties, explosives properties, and blast parameters, a comprehensive analysis of 37 production blasts confirms that the middle detonator yields finer fragmentation than the bottom detonator in the full range of investigated sizes. Meanwhile, using the LS-DYNA code, a bench model with a single blasthole was built in a three-dimensional setting. A single detonator placed at two different positions—the middle and bottom—of the explosive column was analyzed in this study. By analyzing principal stress states on the plane through the blasthole axial and vertical to the bench face, the numerical results show that the middle detonator creates a stress concentration area near the bench face characterized by triaxial tension, while the bottom detonator does not. Furthermore, the middle detonator generates a larger stress concentration area with biaxial tension near the bench face than the bottom detonator. Considering that triaxial and biaxial tensions are more favorable to fragmentation than uniaxial tension, it can be concluded from simulation results that these areas with triaxial tension and biaxial tension in the middle detonator are a significant factor contributing to achieving better fragmentation, compared to the bottom detonator. The middle detonator position has replaced the bottom detonator position in the Kevitsa mine.
1 Introduction
Blasting plays an important role in hard rock mines. Fragmentation as one of the most important blasting outcomes influences ore recovery [1] and mill productivity [2]. In 2018, the ore recovery ratio was on average 81% in mining based on the data on global mineral production and ore recovery in mining, which indicates that the mineral loss in mining reached 762 Mt in the same year [1]. Better (finer) rock fragmentation can increase the ore recovery ratio in mining. Rock fragmentation can be improved through adjustments to blast design, such as drill plan, stemming, subdrilling, detonator position, air deck, and delay time [3].
Optimized blasting by changing detonator positions is a feasible method, which was first done with a qualitative analysis by Zhang [4]. It was found that (1) the detonator or primer (including a detonator and explosive) position has a great impact on the stress and energy distributions in the surrounding rock of the blasthole and (2) the detonator position at the middle point of the explosive charge length shows better stress and energy distributions than that at the location near the collar of the hole. Following this analysis, field blasting tests were conducted in the LKAB Malmberget underground mine employing the sublevel caving method. It has been found that the average ore extraction for the middle detonator position was increased by 107% in 40 ring blasts, compared with the extraction in ordinary blasts with a detonator position close to collars of blastholes [4]. Then, 53 more ring blasts were carried out in the same mine, and a similar result for ore extraction was achieved [5]. After those 93 ring blasting tests, the midpoint detonator position was employed in the whole level of an ore body in the Malmberget mine. It has been found that much higher ore extraction and ore recovery were achieved from 148 rings in this production level with the midpoint detonator position, compared with 110 rings in another level where the detonator position was close to the collars of blastholes [6, 7]. In the Ridgeway gold and copper mine using the sublevel caving, it also has been found that midpoint detonator positions yielded a higher ore recovery ratio than toe detonator positions [8]. In addition, the midpoint detonator position also yielded better safety or less brow damage in sublevel caving [9]. Moreover, when two detonators were placed at different locations in each hole and were fired at the same time, the ore recovery ratio in the Malmberget mine increased, too [10]. Even when one blast was split into two sections, the rock fragmentation was improved, the extraction ratio increased, and the final ore recovery increased in the Malmberget mine, partly due to the midpoint detonator position used [11].
In the open-pit mine, the effect of detonator position on blasting outcomes was also investigated. By conducting five full-scale blast tests on the detonator position, Ylitalo et al. found that the midpoint detonator position reduced the amount of boulder number by over 30% and median fragment size by 11–30%, compared with the conventional detonator placement, i.e., 1–2 m above the bottom [12]. The successful blast results were based on a similar stress wave analysis as Zhang did in 2005 and 2016 [4, 13]. In the Dading open-pit mine, Long et al. conducted field tests on the effects of detonator positions on blasting fragmentation, including the top, middle, and bottom positions in bench blasts with seven blastholes for each test [14]. However, they found that the bottom position leads to slightly better blasting outcomes, i.e., lower boulder ratio and higher excavated volume, than the middle position, while the top position results in the poorest outcomes.
Besides field tests, various studies have conducted numerical simulations to analyze rock damage distributions and perform theoretical analysis on wave propagation. These studies have drawn divergent conclusions regarding the impact of detonator position on blasting outcomes. Liu et al. conducted numerical simulations and field blast experiments to investigate the effects of initiation positions on bench floor damage. They found that both top and middle initiations increase fractures at the hole bottom, leading to a smooth floor [15]. By performing numerical simulation and field tests, Gao et al. found that explosion energy for top initiation mainly transmits downwards, which causes proper fragmentation/damage at the bottom and vice versa for bottom initiation [16]. Their numerical simulation did not consider the energy loss from borehole collars. Meanwhile, Gao et al. further studied the effects of initiation position on ground vibrations and energy distributions by numerical simulations, field tests, and theoretical analysis [17, 18]. They concluded that the traditionally used bottom detonator was not always recommended since the blast-induced damage distribution was the worst, and the top detonator could be beneficial to ground vibration control and proper fragmentation at hole bottom. However, due to certain oversimplifications in numerical models and theoretical analysis, results may produce contradictory results from mining production blasts. In addition, these results of field tests cannot be applied in the production blasts as the onsite blast conditions vary.
According to the above description, limited studies were done in production blasts to investigate the effects of detonator position on blasting outcomes. Two underground mines demonstrate that the midpoint detonator position is better than either collar detonator or toe detonator in ore recovery [4, 8], and full-scale blast tests in one open-pit mine show that the midpoint detonator position produces better fragmentation than the bottom detonator [12]. However, all the theoretical analyses are limited to qualitative studies rather than detailed analyses, and there is still a lack of fragmentation data from production blasts in the open-pit mine. Meanwhile, the previous numerical simulations mainly focused on blast-induced damage distributions without analysis of stress distribution and even yielded inconsistent results with real blast practices.
The effect of detonator positions on rock fragmentation in production blasts remains unclear, which is particularly true for bench blasting in open-pit mines. The objective of this paper is to further verify the benefits of utilizing the midpoint detonator in improving fragmentation, i.e., reducing fragment size. To achieve this objective, size distributions of fragments from 37 production blasts in the Kevitsa open-pit mine were characterized. In addition, numerical simulations were conducted to analyze the effects of the detonator placement on stress distribution. By combining field data analysis with numerical simulation, we aimed to gain insights into the relationship between detonator positions and fragmentation outcomes in bench blasts.
2 Production Blasts in Kevitsa Mine
2.1 Basic Information of Kevitsa Mine
Kevitsa mine is an open-pit nickel-copper mine located in the north of Finland and is one of Finland’s biggest mineral discoveries ever. The mine produced 10.287 Mt of ore containing nickel, copper, gold, platinum, and palladium in 2022. The deposit consists of very high-strength rock. The rock properties were obtained from the previous investigation [12]. The average uniaxial compressive strength and the average tensile strength are 212 MPa and 17 MPa, respectively. The density, Young’s modulus, and Poisson’s ratio of the rock are 3.16 g/cm3, 127 GPa, and 0.27, respectively. Two sizes of the drill holes 165 mm and 229 mm in diameter were drilled in a staggered pattern. For 165-mm diameter boreholes, the applied spacing was 4.3 m, 4.7 m, or 4.8 m, and the burden was 3.7 m, 4 m, or 4.2 m. For 229-mm diameter boreholes, the applied spacing was 5.3 m, 5.5 m, 5.9–6.2 m, and the burden was 4.5 m, 4.8 m, 5.1 m, or 5.4 m. Figure 1 shows the photo of the Kevitsa open-pit mine. During the past 3 years, two emulsion explosives from two suppliers were used in the production blasts before and after January 2021. The average density and the velocity of detonation (VOD) of emulsion 1 are 1.22 kg/cm3 and 5500 m/s, and those of emulsion 2 were 1.1 kg/cm3 and 5100 m/s.

Photo of Kevitsa open-pit mine
In Kevitsa, the conventional blast design on the detonator placement consists of one primary detonator located 1–2 m above the blasthole bottom and a backup detonator located close to the top of the emulsion, as shown in Fig. 2a. The backup detonator is initiated with a delay of 25 ms if the primary detonator did not detonate. In the new design, the middle detonator, one primary detonator is placed in the middle of the emulsion column (4.5–5 m above the blasthole bottom), while the backup detonator is located at the bottom of the blasthole, as shown in Fig. 2b.

a, b Schematic of detonator positions
In 2020, Ylitalo et al. conducted five sets of field blasting tests on the midpoint detonator position in the Kevitsa open-pit mine [12]. They found that the blasts with the middle detonator reduced the median size (x50) by 11–30%, x20 by 10–27%, x80 by 8–31%, and boulders (> 1.0 m) by 29–99%, compared with five reference blasts with the bottom detonator.
2.2 Production Blast Results from Kevitsa Open-Pit Mine
To further verify that the middle detonator is the best detonator position, fragmentation results from production blasts in the Boliden Kevitsa open-pit mine are collected. Fragmentation results are achieved by applying Orica’s FRAG Track system [19], of which cameras are installed on operating face shovels to continuously assess fragment sizes on the active dig face of a muckpile by taking one image per ditching bucket. Fragmentation data is computed based on the images captured during loading muckpiles. For each selected blast, more than 1000 images were captured to analyze the fragment size distributions of the whole muckpile.
In blasting practices at the Kevitsa mine, factors such as rock conditions, explosive properties, and blast parameters, which influence rock fragmentation, inevitably vary over time. To compare fragmentation results among production blasts, it is assumed that rock properties and the specific charge are two of the most important factors affecting fragmentation. Thus, selected production blasts are divided into two groups of comparison: the first group includes six production blasts with similar rock conditions and specific charges and the other group consists of 37 comparable production blasts aiming at providing statistical results on the effect of detonator position on fragmentation.
In the first group, six blasts are located more than 150 m below the surface, with elevations varying in the range of 24 m. Thus, it is considered that the blasted rock masses are not weathered and have similar properties. In addition, these six production blasts applying emulsions from the same manufacturer have a similar specific charge. The selected blasts include two types of detonator positions: the primary detonator located at the middle of the charge and the primary detonator located 1–2 m away from the bottom. For three blasts with the middle detonator, the median size (x50) fluctuates in the range of 193–223 mm and is averaged at 205.7 mm. For the other three blasts with the bottom detonator, the average median size (x50) is 221 mm, which is 7.4% larger than that for the blasts with the middle detonator. Similarly, fragment sizes at both 20% and 80% mass passings for the middle detonator are smaller than those for the bottom detonator. In addition, the average percentage of large-size fragments (> 1 m) for the middle detonator is reduced by 55.4% compared to the bottom detonator. On the other hand, the percentage of small fragments (< 2.5 cm) for the middle detonator varies from 6.54 to 7.87%, averaging at 7.01%, while for the bottom detonator, it is in the range of 6.08–6.41% with an average of 6.2%, which indicates a 13% increase in small fragments for the middle detonator compared to the bottom detonator. Due to limitations of image processing for fragment sizes, fragments smaller than 2.5 cm cannot be precisely identified. Herein, fragments smaller than 2.5 cm were considered as fines in blasting.
In Table 1, the blasts with the middle detonator have a similar specific charge varying in the range of 0.99–1.09 kg/m3, while the specific charge for blasts with the bottom detonator is in the range of 1.05–1.25 kg/m3. Despite the fact that specific charges for the middle detonator are smaller than those for the bottom detonator, blasts utilizing the middle detonator produced finer fragmentation. This highlights the contribution of the middle detonator position to fragmentation.
The second group includes 27 production blasts with the bottom detonator and 10 production blasts with the middle detonator. Rock mass close to the surface experienced varying degrees of weathering within a 40 m range. All selected blasts in this group are located 40 m below the surface. Emulsions employed in these selected blasts were supplied by two manufacturers, which may cause variations in emulsion properties. Thus, we only include blasts with a specific charge in a reasonable range from 1.0 to 1.4 kg/m3. Data on small fragments and boulders was not available for seven blasts with the middle detonator, due to a malfunction in rock fragmentation measurement system.
Fragment sizes of the selected blasts, as listed in Tables 1, 2, and 3, are summarized by box-and-whisker plots. Figure 3 shows the distributions of x20, x50, and x80 for the middle and bottom detonator positions. The median of x50 for the middle detonator is 205 mm, while for the bottom detonator, it is 222 mm. In addition, the interquartile range for the middle detonator is approximately 38 mm, and for the bottom detonator, it is 127 mm. The small interquartile range indicates that blasts with the middle detonator position yield stable fragmentation results. Another possible reason is that fewer blasts with the middle detonator may lead to a low-level variation. Similarly, the medians of both x20 and x80 for the middle detonator position are smaller than those for the bottom detonator position, and the corresponding interquartile ranges for the middle detonator position are smaller than those for the bottom detonator position. Accordingly, the blasts with the middle detonator reduced the median of x50 by 7.7%, the median of x20 by 8.8%, and the median of x80 by 10.9%, compared with the blasts with the bottom detonator. These results show that the middle-detonator blasts produce finer fragmentation than the bottom-detonator blasts in the full range of fragment sizes.

Boxplot of fragmentation (x20, x50, and x80) of production blasts with the middle detonator or the bottom detonator
3 Stress Wave Analysis with Numerical Simulation
Understanding the effects of detonator position on stress distribution is essential for optimizing blast design. Numerical simulation on bench blasting was conducted to study the effects of detonator placement on stress distribution. In the previous numerical simulations with the finite element method, several constitutive models with a continuum damage model were applied to simulate rock blasting [20,21,22,23,24], such as the Riedel-Hiermaier-Thoma model (RHT) [25], the Holmquist-Johnson-Cook model (HJC) [26], and the Taylor-Chen-Kuszmaul (TCK) [27, 28]. The initial blast-induced stress wave creates severe damage in the surrounding area. Then, the subsequent traveling stress and reflected stress waves actively interact with the existing damaged part. Compared with HJC and TCK, the RHT has three strength surfaces, i.e., the three-invariant yield strength surface, the three-invariant maximum strength surface, and the two-invariant residual strength surface [29]. The RHT model can better describe elasticity, strain rate hardening up to failure, and post-failure shear resistance of brittle materials under blast and impact loading [30]. Accordingly, the RHT was applied to simulate the dynamic behaviors under blast loading, and a nonlinear transient dynamic finite element code, LS-DYNA, was used.
3.1 Numerical Model
In the Kevitsa open-pit mine, each production blast usually consists of hundreds of boreholes, and the minimum delay between two successively initiated boreholes is 10 ms/m. For the blast pattern of ore, the burden is 4.5 m, and the spacing is 5.3 m, which leads to the minimum delay interval of 53 ms. The bench height is 12 m. The diameter of the borehole is 229 mm. The stemming is 4.5 m, and the subdrilling is 1.5 m. The longitudinal wave velocity of rock cored from the Kevitsa mine is approximately 6800 m/s and the shear wave velocity is about 4000 m/s. Thus, the traveling time of the P wave front between two adjacent boreholes is about 0.8 ms. In addition, the velocity of detonation is approximately 5100 m/s, and the corresponding detonation time in a borehole is about 1.76 ms. For the fully coupled charge, the pressure duration is about eight times longer than the detonation time [7]. The typical duration in the borehole is approximately 14.1 ms. Accordingly, the delay interval (53 ms) is longer than the pressure duration plus the time the stress wave travels between two neighboring boreholes (14.1 ms + 0.8 ms = 14.9 ms), which indicates no stress wave interaction between two neighboring boreholes. Given that the study focuses on stress distribution, a three-dimensional half model with a single borehole was built using hexahedral solid elements, as shown in Fig. 4. For a single detonator placed in the borehole, blasts with two different detonator positions—at the midpoint and at the bottom of the explosive charge length—were simulated. To realize the practical boundary condition, i.e., to provide certain displacement constraints and to have no wave reflection, a large size of geometry model was built, and a non-reflection boundary was applied to four faces: the bottom face, the left face, the right face, and the front face below the bench. In addition, the symmetry boundary was employed in the back face of the model.

Schematic of model
The dimension of the model is 12 m × 16.5 m × 6.5 m, where the element size for rock varies from 3 × 3 × 8 cm3 close to the borehole to 15 × 15 × 8 cm3 near the boundaries, and the element size for stemming is approximately 3 × 3 × 8 cm3. To model rock behaviors under blast loading, the RHT material model was used. The RHT model uses the normalized effective plastic strain as a damage function [25]. The basic parameters of rock are given in the above section. The stemming is modeled by the material type 5 of LS-DYNA (*MAT_SOIL_AND_FOAM). From reviewing the study, the density, Young’s modulus, and Poisson’s ratio of stemming material are 1.8 g/cm3, 172 MPa, and 0.25, respectively [31].
For numerical simulation of the blasting process, it is crucial to characterize the adiabatic expansion of detonation products. After detonator initiation, the detonation wave propagates in the explosive charge and produces detonation products in a state of high pressure and temperature, which imparts a high transient pressure on the wall of the borehole. In detail, the detonation front propagates into the unexploded charge, followed by a chemical reaction zone. At the front of the reaction zone, the pressure is the von Neumann spike, and at the end of the reaction zone, the chemical reaction is completed (for the ideal detonation) and the corresponding pressure is the Champman-Jouguet (CJ) pressure [7, 32]. The von Neumann spike is quite narrow and attenuates rapidly. Accordingly, it is ignored in many cases. For example, the experimental results of Duff and Houston show that the von Neumann spike completely disappeared beyond a depth of 1.25 mm into an aluminum plate in contact with the explosive [33]. The Jones-Wilkins-Lee (JWL) equation of state has been used to calculate the CJ state of condensed phase explosives and the subsequent expansion of the detonation products working on the surrounding materials for several decades [34, 35]. The JWL equation of state is programmed as the material model in most commercial codes, such as LS-DYNA, AUTODYN, and ABAQUS. In addition, LS-DYNA successfully simulated rock blasting in previous studies [36, 37]. The JWL expression is [35]:
Here, P is pressure; A, B, R1, R2, and ω are material constants; and E0 and V are the detonation energy per unit volume and the relative volume, respectively. According to the previous study on parameters for JWL equation [38], A is 191.72 GPa, B is 1.316 GPa, R1 is 4.629, R2 is 0.588, ω is 0.37, E0 is 1.933 kJ/cm3, the density is 1.1 g/cm3, the VOD is 5100 m/s, and CJ pressure is 7.9 GPa.
The emulsion column and the surrounding void space were modeled by the structured arbitrary Lagrangian-Eulerian (S-ALE) formulation with a mesh size of 2 × 2 × 5 cm3. The S-ALE is a recently developed solver, which is dedicated to solving ALE problems using the structured mesh [39]. The S-ALE solver takes advantage of the structured mesh and provides faster computation on ALE problems. Meanwhile, it has robust control of leakage in the fluid-structure interaction (FSI) and can better capture the peak value of impact pressure. Since the rock and the stemming were modeled using the Lagrangian element formulation, a coupling method (*ALE_STRUCTURED_FSI) was applied to model the fluid-structure interaction (FSI) in LS-DYNA. FSI considers the S-ALE elements as master parts and the Lagrangian elements as slave parts. Considering the height of the bench and velocity of detonation, all the models were run for 5 ms. Once the detonation wave front interacts with the blasthole wall, the applied pressure compresses the surrounding rock and enlarges the blasthole wall diameter. Detonation products expand and fill this space. The size of the void medium should be large enough to cover the final expansion to avoid any instability while running the model.
3.2 Explosion Pressure in Simulation
In the finite element method, the mesh size of the model is an important factor for simulation results, especially the size of ALE elements for explosion pressure. Three different sizes of mesh, i.e., 5 cm, 2 cm, and 0.5 cm, were applied to simulate the emulsion explosion. Figure 5 shows the pressure histories of the element located 35 cm away from the detonator position. With decreasing the mesh size, the peak of pressure increases from 3.67 to 4.88 GPa. However, the peak pressure by applying the 0.5-cm mesh size is still smaller than the CJ pressure (7.9 GPa). Accordingly, to obtain precise numerical results, the mesh size should be small enough. In addition, the time step in computations decreases from 3.6 to 0.53 µs with a decrease in mesh size. It is indicated that the variation in the peak pressure from 4.88 GPa to CJ pressure, i.e., 7.9 GPa, would occur within one time step of 0.53 µs. On the other hand, the small mesh size consumes huge computational resources, especially for the three-dimensional FSI-involved model. In previous studies about numerical simulation of field-scale rock blasting, the explosion pressure peak by using the FSI method is in the range of 2–3 GPa [21, 40, 41]. This investigation focuses on the stress distribution in the burden rock. The models with those three meshes produce similar distributions of stress concentration zones. We consider that the 2-cm mesh size model for an explosion is properly applied in this investigation.
Effect of mesh size on pressure in simulation
3.3 Stress Distribution Near the Bench Face
When the detonator is initiated at the middle of the emulsion column, two detonator wave fronts propagate upward and downward, separately. For the bottom detonator, only one detonation wave front propagates upward. The initial stress wave can reach the bench face at approximately 750 µs. The moment at 1250 µs is selected to analyze the effects of detonator position on stress fields, as it gives a good picture of the stress distributions near the bench face. At 1250 µs, the reflected wave from the bench face propagates through the half part of the burden. The principal stress distributions on the cross-section normal to the bench face and across the borehole axis are investigated. For a better visual presentation of stress distribution, the compressive and the tensile stresses are supposed to be avoided in the same color plot. Figure 6 shows six color plots of the principal stresses in tension with one stress scale in the range of 0–10 MPa. The middle detonator produces larger concentration zones of the first and second principal stresses in tension than the bottom detonators, as shown in Fig. 6a, b, d, and e. The main reason is that two detonation wave fronts from the middle detonator lead to stress concentration zones distributed in the burden faster than one detonation wave front by the bottom detonator. Meanwhile, the middle detonator yields the third principal stress in tension near the bench face, while the bottom detonator does not, as shown in Fig. 6c and f. It means that the middle detonator position produces a triaxial tensile area near the bench face. By using dynamic photoelastic analysis for blast tests on polymer plates, Fourney found that the biaxial tensile stress state in the two-dimensional model initiates small cracks from flaws near the free surface in all directions, and the following S wave reinitiates these cracks, which is favorable to forming crack network, i.e., rock fragmentation [42]. Hence, the triaxial tension contributes to forming fragmentation in the three-dimensional case.

a–f Distribution of three principal stresses at 1250 µs
In addition, it is found that two shear stresses, i.e., XY-stress and YZ-stress, near the bench face always have a very low magnitude. It is indicated that one principal stress is in the radial direction, i.e., vertical to the cross-section, and the other two principal stresses are in the cross-section plane. The uniaxial tensile stress tends to produce cracks normal to the stress direction rather than the crack network. It is also important to consider the principal stress directions, which will be given in the next section.
3.4 Directions of the Principal Stresses
Figure 6 shows the concentration zones of the first, second, and third principal stresses distributed within a certain area; however, the directions of these principal stresses are unknown and would not remain constant in the whole concentration area. Simulation results show that the shear stresses in XY and YZ planes on the cross-section were approximately zero, which indicates that the normal stress Y is one of the principal stresses. According to two normal stress components (X and Z stresses) and a shear stress component (ZX stress), the magnitudes and the directions of the principal stresses in the plane can be determined by Eqs. 2 and 3 [43]. For example, the stress state of the element at 1250 µs is \(\boldsymbol T=\begin{bmatrix}-33.4&0&-7.49\\0&13.0&0\\-7.49&0&14.2\end{bmatrix}\) MPa, where the negative sign is compression and the positive sign is tension, as shown in Fig. 7a. The corresponding principal stress tensor is \(\left[\begin{array}{ccc}15.4& 0& 0\\ 0& 13.0& 0\\ 0& 0& -34.6\end{array}\right]\) MPa. When the element rotates counterclockwise by 9°, the directions of the first and the third principal stresses are determined, as shown in Fig. 7b.
Here, θ1 is the angle for the first principal stress, θ3 is the angle for the second principal stress, Txx is the normal stress in the X-axial direction, Tzz is the normal stress in the Z-axial direction, Tzx is the shear stress, σ1 is the first principal stress, and σ3 is the third principal stress.
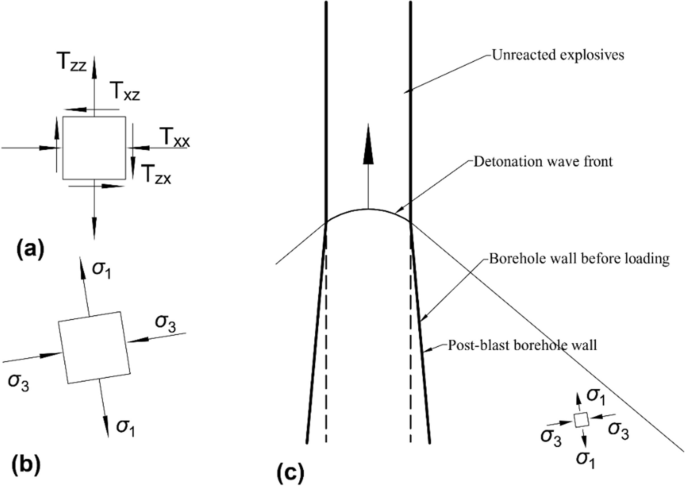
Schematic of directions of principal stresses: a an element with stress components, b the element with the principal stresses, and c directions of principal stresses of the element behind the wave front
Based on the concentration zone of the second principal stress, e.g., the red area in Fig. 6b, stress distribution near the bench face is divided into several main sub-areas. According to the above-mentioned method, the directions of the principal stresses in each sub-area could be determined. Thus, the two principal stresses with two orthogonal directions in the sub-areas are schematically plotted in Fig. 8. Figure 8a shows two principal stresses of several main sub-areas for the middle detonator. The sub-area (1) connecting with the bench face has the triaxial tension with the first principal stress vertical to the cross-section. In addition, the sub-area (2) outside the sub-area (1) has the biaxial tension with the third principal stress of zero. The corresponding first principal stress is also vertical to the cross-section. The sub-area (3) develops the first and the second principal stresses in tension and the third principal stress in compression. The direction of the first principal stress is in the cross-section plane rather than vertical to the plane. The area near the bench face has symmetrical stress states above and below the middle detonator position.

Distributions of two principal stresses near the bench face on the cross-section at 1250 µs
Figure 8b shows two principal stresses of several main sub-areas for the bottom detonator. The sub-area (1) has the biaxial tension with the first principal stress vertical to the cross-section and the second principal stress in the plane. The corresponding third principal stress approximates zero. The principal stress state of the sub-area is quite similar to the sub-area (2) of the middle detonator. Both sub-areas (2) and (3) yield the tensile first principal stress in the plane, the tensile second principal stress vertical to the plane, and the compressive third principal stress.
In this study, via numerical simulations, the principal stress distributions and the corresponding directions in the burden rock were investigated. The principal stress state varies significantly at different locations on the cross-section. Comparing the stress states of the middle detonator with the bottom detonator, several following points can be found:
-
1.
In the cross-section of both the middle detonator and the bottom detonator, there is consistently one principal stress in tension that is oriented vertically to the plane.
-
2.
In most of the sub-areas adjacent to the bench face, the first and second principal stresses are biaxial tension, while the third principal stress is either zero or in compression. Triaxial tension of the principal stresses is present only in a partial area near the bench face of the middle detonator.
-
3.
In the sub-area (1) of the middle detonator, the third principal stress, which is in tension, exhibits a horizontal direction, thereby promoting the cracks paralleling the bench face. On the other hand, the sub-area (1) of the bottom detonator does not produce the tensile principal stress in the horizontal direction.
It is assumed that tensile loading dominates rock fractures in blasting. Numerical simulation results indicate that the middle detonator position, characterized by a large area of multiple axial tension, leads to finer fragmentation than the bottom detonator position. Further details will be provided in the following section.
4 Discussion
4.1 Variations in Blast Parameters from Selected Production Blasts
Factors influencing rock fragmentation by blasting have been discussed for several decades, of which most can be categorized into three groups: explosive and initiator properties, rock characteristics, and energy distribution and efficiency [3]. This case study aims to further demonstrate the advantage of a middle detonator on fragmentation in production blasts, following a previous study on field tests. In the first comparison group of comparison, six fields were blasted within 3 months and were located close to each other. These two conditions indicate that explosive and initiator properties and rock characteristics remain similar among production blasts. In the aspect of energy distribution and efficiency, the specific charge of these six blasts exhibited very low fluctuations, and both sides of the comparison have 165 mm and 229 mm blastholes. Accordingly, the impact of variations in blast parameters, excluding detonator position, on fragmentation was effectively mitigated.
In the second comparison group, 37 selected production blasts were conducted over a period of 1.5 years. All these blasts were conducted on rock mass without weathering, i.e., similar rock properties. Properties of emulsions, such as the density and the VOD, may vary within 1.5 years since emulsions were supplied by two manufacturers. Thus, blasts with excessively small or large specific charges were excluded from the analysis. We only include blasts with a specific charge in a reasonable range from 1.0 to 1.4 kg/m3.
It should be mentioned that the average specific charge of the blasts with the bottom detonator is 1.16 kg/m3, while the average specific charge with the middle detonator is 1.23 kg/m3. If misfires do not occur, a high specific charge, in general, results in a finer fragmentation [3, 7]. This could compromise the above-mentioned conclusion. However, the VOD of the blasts, as listed in Table 2, with the bottom detonator is 5500 m/s, which is larger than that of the middle detonator, i.e., 5100 m/s. A high VOD of explosives could lead to better fragmentation (smaller average fragment size) [7, 44], which is positive in the conclusion. Accordingly, it is considered that the effect of combining two factors on fragmentation can be ignored. Furthermore, as better fragmentation was achieved from the production blasts with the middle detonator, the middle detonator replaced the conventional detonator, the bottom detonator, in the Kevitsa mine.
4.2 Stress Distribution and Rock Fragmentation
In general, the tensile strength of rock is much lower than its compressive strength. The blast-induced compressive stress wave would be reflected as a tensile wave at the free surface, which dominates rock fractures [7]. Accordingly, in bench blasting, the bench face plays a significant role in fragmentation as the reflected tensile wave contributes to the formation of a crack network. In detail, considering the burden and blasthole diameter employed in the Kevitsa mine, most natural flaws in the rock near the bench face cannot be initiated by the compressive P wave front, as the rock lies surrounding the boundary of the fractured zone or outside the fractured zone. According to previous laboratory and field tests, the ratio of the fractured zone size to the charge radius is in the range of 20–50 [45,46,47]. After the P wave reflects at the bench face, the reflected tensile P wave superimposes on the outwardly propagating P wave tail. As the stress intensity factor increases in proportion to the tensile stress magnitude, the superposition leads to the stress intensity factor larger than the fracture toughness of the rock, which initiates flaws near the bench face and even produces multiple branching. This phenomenon has been demonstrated by the blast experiments that the biaxial tension caused by the reflected wave initiates flaws in all directions [42]. Meanwhile, the intense stress field disappears once the reflected wave passes, which leads to most of the crack branches being arrested. Then, the arrival of the S wave and its reflected waves reinitiates some of these branches, driving them toward both the bench face and the blasthole. It has been found that the cracking from spalling near the free surface and fracturing from the blasthole would connect to produce fragmentation rather than just cracking [42]. Numerical simulations on bench blasting in this study focused on the principal stress distributions and the corresponding directions. In Fig. 8, the middle detonator position produces a larger area with biaxial tension than the bottom detonator position and even yields triaxial tension near the bench face. These multiple axial tensile stresses in the middle-detonator blast increase the number of flaws to be initiated, resulting in a dense crack network after the subsequent stress waves, ultimately leading to fine fragmentation.
4.3 Limitation of this Study
The numerical simulation in this study primarily focuses on analyzing wave behavior and stress distributions in intact rock. However, joint/structures of rock masses could influence stress distributions. In the future, numerical simulations in the three-dimensional model considering rock mass structures are supposed to be conducted.
5 Conclusion
Through the case study on the Kevitsa open-pit mine, it has been demonstrated that utilizing the middle detonator position in production blasts successfully improves rock fragmentation, compared with using the bottom detonator position. For example, the blasts with the middle detonator position reduced the median of x50 by 7.7%, the median of x20 by 8.8%, and the median of x80 by 10.9%, compared with the bottom detonator position. Accordingly, the middle detonator position has replaced the bottom detonator position in all production blasts at the Kevitsa mine.
Effects of the detonator position on stress distribution were analyzed by numerical simulation using the three-dimensional bench model. It has been found that the middle detonator position yields a stress concentration area with triaxial tension near the bench face, while the bottom detonator position does not. In addition, the middle detonator position produces a larger stress concentration area with biaxial tension near the bench face, compared to the bottom detonator position. Considering the mechanism of rock fragmentation by blasting that multiple axial tension near the bench face contributes to the formation of a crack network, numerical simulation results are consistent with rock fragmentation of production blasts.
Change history
23 May 2024
A Correction to this paper has been published: https://doi.org/10.1007/s42461-024-01006-1
References
Zhang Z-X, Hou D-F, Aladejare A, Ozoji T, Qiao Y (2021) World mineral loss and possibility to increase ore recovery ratio in mining production. Int J Min Reclam Environ 35:670–691
Smith ML, Prisbrey KA, Barron CL (1993) Blasting design for increased SAG mill productivity. Min Metall Explor 10:188–190
Zhang Z-X, Sanchidrián JA, Ouchterlony F, Luukkanen S (2022) Reduction of fragment size from mining to mineral processing: a review. Rock Mech Rock Eng 56(1):747–778
Zhang ZX (2005) Increasing ore extraction by changing detonator positions in LKAB Malmberget mine. Fragblast 9:29–46
Zhang ZX (2005) Reduction of vibrations and improvement of production blasts in Western Malmberget mine. Research Report no. 05-704. LKAB R&D, 2005 (in Swedish)
Zhang ZX (2008) Impact of rock blasting on mining engineering. In: Proceedings of 5th international conference & exhibition on mass mining. Luleå, Sweden, pp 671–680
Zhang ZX (2016) Rock fracture and blasting: theory and applications. Butterworth-Heinemann (Elsevier), Oxford. https://doi.org/10.1016/C2014-0-01408-6
Brunton ID, Fraser SJ, Hodgkinson JH, Stewart PC (2010) Parameters influencing full scale sublevel caving material recovery at the Ridgeway gold mine. Int J Rock Mech Min Sci 47:647–656
Zhang ZX (2011) Reducing eyebrow break caused by rock blasting in Malmberget mine. Blasting Fragm 5:1–10
Zhang ZX (2014) Effect of double-primer placement on rock fracture and ore recovery. Int J Rock Mech Min Sci 71:208–216
Zhang ZX, Wimmer M (2018) A case study of dividing a single blast into two parts in sublevel caving. Int J Rock Mech Min Sci 104:84–93
Ylitalo RM, Zhang Z-X, Bergström P (2021) Effect of detonator position on rock fragmentation: full-scale field tests at Kevitsa open pit mine. Int J Rock Mech Min Sci 147:104918
Zhang Z-X (2016) Failure of hanging roofs in sublevel caving by shock collision and stress superposition. J Rock Mech Geotech Eng 8:886–895
Long Y, Zhong MS, Xie QM, Li XH, Song KJ, Liao K (2013) Influence of initiation point position on fragmentation by blasting in iron ore. In: Rock fragmentation by blasting: the 10th international symposium on rock fragmentation by blasting. New Delhi, India; 26-29 November 2012. Taylor & Francis Books Ltd, pp 111–116
Liu L, Chen M, Lu W, Hu Y, Leng Z (2015) Effect of the location of the detonation initiation point for bench blasting. Shock Vib 2015:907310
Gao Q, Lu W, Yan P, Hu H, Yang Z, Chen M (2019) Effect of initiation location on distribution and utilization of explosion energy during rock blasting. Bull Eng Geol Environ 78:3433–3447
Gao Q, Lu W, Leng Z, Yang Z, Zhang Y, Hu H (2019) Effect of initiation location within blasthole on blast vibration field and its mechanism. Shock Vib 2019:1–18
Gao Q, Leng Z, Yang R, Wang Y, Chen M, Sun P, Luo S (2020) Mathematical and mechanical analysis of the effect of detonator location and its improvement in bench blasting. Math Probl Eng 2020:6058086
OricaGroup (2019) FRAGTrackTM brochure-automated capture and reporting of fragmentation data. https://www.orica.com/ArticleDocuments/2144/Orica%20FRAGTrack%E2%84%A2%20Brochure.pdf.aspx?Embed=Y
Yi C, Sjöberg J, Johansson D, Petropoulos N (2017) A numerical study of the impact of short delays on rock fragmentation. Int J Rock Mech Min Sci 100:250–254
Saadatmand Hashemi A, Katsabanis P (2020) The effect of stress wave interaction and delay timing on blast-induced rock damage and fragmentation. Rock Mech Rock Eng 53:2327–2346
Liu K, Li Q, Wu C, Li X, Li J (2020) Optimization of spherical cartridge blasting mode in one-step raise excavation using pre-split blasting. Int J Rock Mech Min Sci 126:104182
Wang Z-L, Li Y-C, Shen RF (2007) Numerical simulation of tensile damage and blast crater in brittle rock due to underground explosion. Int J Rock Mech Min Sci 44:730–738
Dehghani H, Babanouri N, Alimohammadnia F, Kalhori M (2020) Blast-induced rock fragmentation in wet holes. Min Metall Explor 37:743–752
Riedel W, Thoma K, Hiermaier S, Schmolinske E (1999) Penetration of reinforced concrete by BETA-B-500 numerical analysis using a new macroscopic concrete model for hydrocodes. In: Proceedings of the 9th international symposium on the effects of munitions with structures. Berlin-Strausberg Germany, pp 315–322
Holqmuist TJ, Johnson GR, Cook W (1993) A computational constitutive model for concrete subjected to large strains, high strain rate, and high pressures. In: 14th international symposium on ballistics. Quebec City, pp 591–600
Taylor LM, Chen EP, Kuszmaul JS (1986) Microcrack-induced damage accumulation in brittle rock under dynamic loading. Comput Methods Appl Mech Eng 55:301–320. https://doi.org/10.1016/0045-7825(86)90057-5
Sanchidrian JA, Pesquero JM, Garbayo E (1992) Damage in rock under explosive loading: implementation in DYNA2D of a TCK model. Int J o/Surface Min Reclam Environ 6:109–114
Kong X, Fang Q, Chen L, Wu H (2018) A new material model for concrete subjected to intense dynamic loadings. Int J Impact Eng 120:60–78
Riedel W, Kawai N, Kondo K (2009) Numerical assessment for impact strength measurements in concrete materials. Int J Impact Eng 36:283–293
Wu W, Thomson R (2007) A study of the interaction between a guardrail post and soil during quasi-static and dynamic loading. Int J Impact Eng 34:883–898
Meyers MA (1994) Dynamic behavior of materials. John Wiley & Sons, New York. https://doi.org/10.1002/9780470172278
Duff RE, Houston E (1955) Measurement of the Chapman-Jouguet pressure and reaction zone length in adetonating high explosive. J Chem Phys 23:1268–1273
Tarver CM (2020) Jones-Wilkins-Lee (JWL) reaction product equations of state for overdriven PETN detonation waves. AIP Conf Proc 2272:030031. https://doi.org/10.1063/12.0000827
Lee EL, Hornig HC, Kury JW (1968) Adiabatic expansion of high explosive detonation products, Lawernce Livermore Report UCRL-50422. Livermore, CA (United States)
Hu Y, Lu W, Chen M, Yan P, Yang J (2014) Comparison of blast-induced damage between presplit and smooth blasting of high rock slope. Rock Mech rock Eng 47:1307–1320
Yin Y, Sun Q, Zou B, Mu Q (2021) Numerical Study on an innovative shaped Charge Approach of Rock Blasting and the timing sequence effect in Microsecond Magnitude. Rock Mech Rock Eng 54:4523–4542
Castedo R, Natale M, López LM, Sanchidrián JA, Santos AP, Navarro J, Segarra P (2018) Estimation of Jones-Wilkins-Lee parameters of emulsion explosives using cylinder tests and their numerical validation. Int J Rock Mech Min Sci 112:290–301
Chen H (2016) LS-DYNA structured ALE (S-ALE) solver. In: Proceedings of the fourteenth international LS-DYNA user conference, Detroit, pp 1–12
Yu Z, Shi X-Z, Zhang Z-X, Gou Y-G, Miao X-H, Kalipi I (2022) Numerical investigation of blast-induced rock movement characteristics in open-pit bench blasting using bonded-particle method. Rock Mech Rock Eng 55(6):3599–3619
Jang H, Handel D, Ko Y, Yang H-S, Miedecke J (2018) Effects of water deck on rock blasting performance. Int J Rock Mech Min Sci 112:77–83
Fourney WL (2015) The role of stress waves and fracture mechanics in fragmentation. Blasting Fragm 9:83–106
Irgens F (2008) Continuum mechanics. Springer Science & Business Media
Michaux S, Djordjevic N (2005) Influence of explosive energy on the strength of the rock fragments and SAG mill throughput. Min Eng 18:439–448
Sun C (2013) Damage zone prediction for rock blasting. Department of Mining Engineering, University of Utah
Ouchterlony F (1997) Prediction of crack lengths in rock after cautious blasting with zero inter-hole delay. Fragblast 1:417–444
Olsson M, Nie S, Bergqvist I, Ouchterlony F (2002) What causes cracks in rock blasting? Fragblast 6:221–233
Funding
Open Access funding provided by University of Oulu (including Oulu University Hospital). This work is financially supported by Boliden Technology and Boliden Kevitsa Mine.
Author information
Authors and Affiliations
Corresponding author
Ethics declarations
Competing Interests
The authors declare no competing interests.
Additional information
Publisher’s Note
Springer Nature remains neutral with regard to jurisdictional claims in published maps and institutional affiliations.
Rights and permissions
Open Access This article is licensed under a Creative Commons Attribution 4.0 International License, which permits use, sharing, adaptation, distribution and reproduction in any medium or format, as long as you give appropriate credit to the original author(s) and the source, provide a link to the Creative Commons licence, and indicate if changes were made. The images or other third party material in this article are included in the article's Creative Commons licence, unless indicated otherwise in a credit line to the material. If material is not included in the article's Creative Commons licence and your intended use is not permitted by statutory regulation or exceeds the permitted use, you will need to obtain permission directly from the copyright holder. To view a copy of this licence, visit http://creativecommons.org/licenses/by/4.0/.
About this article

Cite this article
Chi, L.Y., Ylitalo, R.M., Zhang, ZX. et al. A Case Study of Fragmentation Improvement by Primer Placement in Kevitsa Mine. Mining, Metallurgy & Exploration 41, 1265–1278 (2024). https://doi.org/10.1007/s42461-024-00998-0
Received:
Accepted:
Published:
Issue Date:
DOI: https://doi.org/10.1007/s42461-024-00998-0