
Abstract
The main aim of this review is to describe in detail an advanced technique to detect and estimate the prior unknown parameters of intra-pulse modulated signals and the verification with typical radar signals. The method is approved for detecting parameters successfully, including chirp rate, carrier frequency, and pulse width. The review presents already-done research on detecting and estimating single and multi-component linear frequency modulation (LFM) and binary phase shift keying (BPSK) signals in a strong noise environment and studies the technique on one more case, a mixture of LFM and BPSK signals. Firstly, the accuracy of the revised technique is shown in detecting and estimating parameters of a single and multi-component LFM signal in white noise and a mixture of continuous wave signals and noise, or a single BPSK signal in strong white noise. All of them have been done in the existing studies. This method is continuously tested in the second part by detecting a mixture of LFM and BPSK signals and estimating their parameters in intense noise. The tested experimental results demonstrate that the technique can detect single and multi-component real-time LFM signals, single BPSK as well as verification with a mixture of real-time LFM and BPSK signals with \(SNR \ge - 12{\text{ dB}}\) is performed. As a result, the technique outperforms the existing detection methods based on machine learning and artificial intelligence.
Article Highlights
-
This review summarizes previous papers and develops more research results of a detection method for low-power radar signals, especially LFM and BPSK signals.
-
Based on this review, researchers can apply the method to other signals, even communication ones, such as amplitude modulation (AM), frequency modulation (FM), MFSK, or polyphase-coded signals.
-
This review is considered a theoretical background for building a digital receiver in practice, based on the studied method for detecting radar signals, while other regular receivers can not.
1 Introduction
Identifying the intra-pulse modulated signals plays a vital role in electronic warfare, and it is used to estimate the function of radar transmitter systems. However, modern radars use the pulse compression technique to reduce the power spectral density of the transmitted signals. In ordinary operating environments, these signals are transmitted comparably to the noise, or they are called the low probability of intercept (LPI) signals [1,2,3,4] (see Fig. 1). Recently, an urgent issue has arisen requiring the need to accurately detect and estimate parameters of signals in a strong noise environment.

Amplitude spectrum of LFM radar signal (red line) under high noise
Traditional techniques are used to detect and estimate signal parameters (LFM signal chirp rate \(\mu\) and pulse width \(\tau\), carrier frequency \(f_{c}\) and BPSK signal pulse width \(\tau\)) based on feature extractions such as fast fourier transform (FFT) and short-time fourier transform (ST-FT) [5, 6], wavelet transform features [7, 8], cyclo-stationary [9], and winger-ville distribution (WVD) features [10]. These approaches are unable to detect and estimate intra-pulse modulated radar signal parameters with \(SNR \le 0{\text{ dB}}{.}\)
With the development of technology in recent years, new techniques are used to recognize Intra-pulse modulated radar signal s based on machine learning (ML) and artificial intelligence (AI), such as the convolution neural network (CNN) [11], convolution and long short-term memory and deep neural network (CLDN) [12], CCNN and Structed-based machine learning process optimization (TPOT) [13] and Denoising-guided Disentangled Network (DGNet) [14]. These techniques can recognize Intra-pulse modulated radar signal s with \(SNR \ge - 8{\text{ dB}}\)(with a probability of correct recognition \(P_{ce} \ge 90\%\)).
These techniques, however, perform only with a signal database. Thus, their accuracy depends on the total number of samples—the fewer samples, the lower the accuracy, and the more samples, the greater the accuracy. However, it takes a long time to create an exxtensive network. Another word, these techniques focus only on signal recognition, not on signal detection.
Later, a new technique was used to recognize the intra-pulse modulated radar signal based on features from multiple images, as proposed in [15]. The probability of recognition of this method reached 87.7% for \(SNR = - 6{\text{ dB}}{.}\) Another method used to recognize intra-pulse modulated radar signals is Dual-Channel CNN and Feature Fusion [16]. This technique is able to recognize 12 types of intra-pulse modulated radar signals with a recognition probability of 97% for \(SNR = - 6{\text{ dB}}{.}\) The problem with these methods is that the signal parameters or the signal database are needed to be known.
To overcome the above disadvantages, an advanced technique for detecting and estimating parameters of intra-pulse modulated radar signals in a strong interference environment based on cross-correlation function (CCF) will be shown in this review. The main goal of the proposed technique is to increase the range of passive surveillance systems (PSS) on LPI radars. The main challenge is to detect these intra-pulse signals irradiated by the radar sidelobes, with a high side lobe suppression (SLS) antenna, when the intra-pulse modulated radar signal parameters (carrier frequency, chirp rate, and pulse width) are unknown.
This technique focuses only on single, multi-component LFM, BPSK, and a mixture of LFM and BPSK signal detection in interference environments such as white noise and additional CW signals. It does not focus intensely on accurate parameter estimation. In the case of signal detection, the parameters of detected signals are indeed estimated, such as chirp rate, pulse width, and carrier frequency. To provide reliable detection performance of this method, the wide frequency bandwidth has been divided into sub-bandwidth. The maximum value of sub-bandwidth and pulse width of signals are listed in Table 1. The algorithm will be applied to each sub-bandwidth. Since the primary purpose of this technique is to detect intra-pulse modulated signals in the form of LFM or BPSK signals, reference signals set in the form of LFM or BPSK signals should be used.
The structure of this review consists of the following sections. The main principle of this method for analyzing intra-pulse modulated signals in different environments is described in Sect. 2. In Sect. 3, simulation results for typical intra-pulse modulated signals, including LFM [17,18,19], BPSK, and a mixture of LFM and BPSK signals are presented. Based on the simulation results, the functionality of this algorithm is verified in Sect. 4. Finally, main conclusions are summarized in Sect. 5.
2 Overview of the Proposed Approach
Assuming that in a natural operating environment, a radar signal collected by the PSS generally composes of the signal, Gaussian white noise, and interference signal. The signal model can be expressed by the following equation:
where \(x\left( t \right)\) is the received signal, \(s\left( t \right)\) is the transmitted signal from radars, \(n\left( t \right)\) is noise, and \(r\left( t \right)\) is interference.
This review considers two types of intra-pulse modulated radar signals: linear frequency modulation (LFM) and binary phase shift keying (BPSK). In order to detect and estimate the parameters of signals in a strong noise environment, the advanced technique based on a cross-correlation function has been published papers [17, 20].
Figure 2 presents an overview of the technique, mainly composed of two stages: detection or chirp rate estimation for LFM (carrier frequency for BPSK) and pulse width estimation. First, in the detection stage, a reference signal set \({\mathbf{s}}_{{{\mathbf{ref}}_{{\mathbf{1}}} }} \left( {\mathbf{t}} \right)\) is used, in which signals have the same pulse width \(\tau\) and varying chirp rates \({{\varvec{\upmu}}}_{{{\mathbf{ref}}}}\) for LFM signals or carrier frequency \({\mathbf{f}}_{{{\mathbf{ref}}}}\) for BPSK signals. In the pulse width estimation stage, another reference signal set \({\mathbf{s}}_{{{\mathbf{ref}}_{{\mathbf{2}}} }} \left( {\mathbf{t}} \right)\) are generated with the chirp rates \(\mu\) or carrier frequency \(f_{c}\), estimated in the detection stage, but with different pulse widths \({{\varvec{\uptau}}}_{{{\mathbf{ref}}}}\). The steps of the technique are listed below.
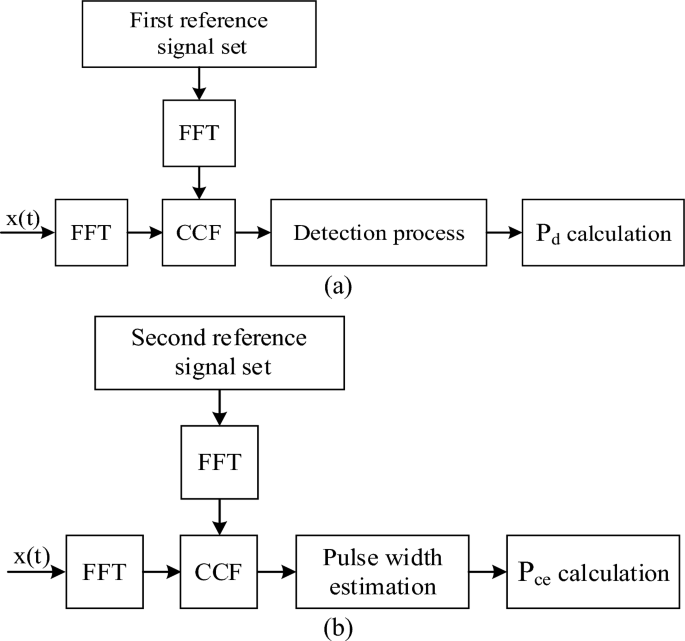
Block diagram of the proposed approach: a detection; b pulse width estimation
Input parameters
-
\({{\varvec{\upmu}}}_{{{\mathbf{ref}}}} , \, {{\varvec{\uptau}}}_{{{\mathbf{ref}}}} , \, {\mathbf{f}}_{{{\mathbf{ref}}}}\) : reference sets
-
\(\rho_{1} , \, \rho_{2}\): threshold values based on constant false alarm rate (\(P_{fa} = 10^{ - 12}\)) [21,22,23].
Output parameters
-
\(\mu , \, f_{c} , \, \tau\)
-
Step 1 Generating the first reference signal set \({\mathbf{s}}_{{{\mathbf{ref}}_{{\mathbf{1}}} }} \left( {\mathbf{t}} \right)\) and calculating the spectrum \({\mathbf{S}}_{{{\mathbf{ref}}_{{\mathbf{1}}} }} \left( {{\varvec{\upomega}}} \right)\) by FFT. \({\mathbf{s}}_{{{\mathbf{ref}}_{{\mathbf{1}}} }} \left( {\mathbf{t}} \right)\) and \({\mathbf{S}}_{{{\mathbf{ref}}_{{\mathbf{1}}} }} \left( {{\varvec{\upomega}}} \right)\) are defined as follows. N is the number of reference signals.
$$\left\{ \begin{gathered} {\mathbf{s}}_{{{\mathbf{ref}}_{{\mathbf{1}}} }} \left( {\mathbf{t}} \right) = s_{1i} \left( t \right), \, i = 1, \, 2, \, \ldots ,{\text{ N}} \hfill \\ {\mathbf{S}}_{{{\mathbf{ref}}_{{\mathbf{1}}} }} \left( {{\varvec{\upomega}}} \right) = S_{1i} \left( \omega \right), \, i = 1, \, 2, \, \ldots ,{\text{ N}} \hfill \\ \end{gathered} \right.$$(2) -
Step 2 Calculating the spectrum \(X\left( \omega \right)\) of the received signal x(t) by FFT.
-
Step 3 Calculating a CCF matrix \({\mathbf{R}}_{{\mathbf{1}}} \left( {{\varvec{\upupsilon}}} \right)\) between the received signal x(t) and the first reference signal set \({\mathbf{s}}_{{{\mathbf{ref}}_{{\mathbf{1}}} }} \left( {\mathbf{t}} \right)\) by Eq. (3).
$${\mathbf{R}}_{{\mathbf{1}}} \left( {{\varvec{\upupsilon}}} \right) = F^{ - 1} \left\{ {X^{ * } \left( \omega \right) \times {\mathbf{S}}_{{{\mathbf{ref}}_{{\mathbf{1}}} }} \left( {{\varvec{\upomega}}} \right)} \right\}$$(3)where \(X^{ * } \left( \omega \right)\) is the complex conjugate of \(X\left( \omega \right)\) and \(F^{ - 1}\) is the inverse Fourier Transform. On the other hand, \({\mathbf{R}}_{{\mathbf{1}}} \left( {{\varvec{\upupsilon}}} \right)\) can be presented by Eq. (4).
$${\mathbf{R}}_{{\mathbf{1}}} \left( {{\varvec{\upupsilon}}} \right) = \left[ {R_{11} \left( \upsilon \right), \, R_{12} \left( \upsilon \right), \, \ldots {, }R_{1N} \left( \upsilon \right)} \right]$$(4)where \(R_{1i} \left( \upsilon \right)\),\(i = 1, \, 2, \, \ldots , \, N\) is the CCF vectors between the received and ith signal in the first reference signal set.
-
Step 4 Finding maximum vector \(f\left( \mu \right)\) of \({\mathbf{R}}_{{\mathbf{1}}} \left( {{\varvec{\upupsilon}}} \right)\), which can be expressed by (5).
$$f\left( \mu \right) = \max ({\mathbf{R}}_{{\mathbf{1}}} \left( {{\varvec{\upupsilon}}} \right)) = f(\mu_{1} ,\mu_{2} ,...,\mu_{N} )$$(5) -
Step 5 Detection or estimation of chirp rate.
If \(f\left( \mu \right) \ge \rho_{1}\) and \(\mu \in \left[ {0.1, \, 0.9} \right] \, {{\varvec{\upmu}}}_{{{\mathbf{ref}}}}\), \(\mu\) is estimated.
-
Step 6 Generating the second reference signal set \({\mathbf{s}}_{{{\mathbf{ref}}_{{\mathbf{2}}} }} \left( {\mathbf{t}} \right)\) and calculating the spectrum \({\mathbf{S}}_{{{\mathbf{ref}}_{{\mathbf{2}}} }} \left( {{\varvec{\upomega}}} \right)\) by FFT.
$$\left\{ \begin{gathered} {\mathbf{s}}_{{{\mathbf{ref}}_{{\mathbf{2}}} }} \left( {\mathbf{t}} \right) = s_{2i} \left( t \right), \, i = 1, \, 2, \, \ldots ,{\text{ N}} \hfill \\ {\mathbf{S}}_{{{\mathbf{ref}}_{{\mathbf{2}}} }} \left( {{\varvec{\upomega}}} \right) = S_{2i} \left( \omega \right), \, i = 1, \, 2, \, \ldots ,{\text{ N}} \hfill \\ \end{gathered} \right.$$(6) -
Step 7 Computing the CCF between the received signal and the second reference signal set \({\mathbf{R}}_{{\mathbf{2}}} \left( {{\varvec{\upupsilon}}} \right)\) as step 3.
-
Step 8 Finding out the maximum \(f\left( \tau \right)\) of \({\mathbf{R}}_{{\mathbf{2}}} \left( {{\varvec{\upupsilon}}} \right)\) as step 4.
-
Step 9 Estimating \(\tau\). If \(f\left( \tau \right) \ge \rho_{2}\) and \(\tau \in \left[ {0.1,{ 0}{\text{.9}}} \right] \, {{\varvec{\uptau}}}_{{{\mathbf{ref}}}}\), \(\tau\) is estimated.
Note that, an assumption taken here is that the estimated parameters of the unknown signal are within the ranges of reference signal sets. If not, it is necessary to extend the observed range and re-analyze the signal parameters.
2.1 Detection process
The detection process is the critical step in the proposed technique. The main goal of this step is to find out (detect) radar signals. Here LFM signals are picked up as an example. If the signal is detected, its other parameters will be determined. This section describes the main problems involved in the detection process.
2.1.1 False detection
In this part, the authors assumed that the LFM radar signal chirp rate \(\mu\) is out of the reference chirp rate range \(\mu \notin {{\varvec{\upmu}}}_{{{\mathbf{ref}}}}\) (Table 2). The time–frequency characteristic of all the signals is shown in Fig. 3a (red line for the unknown LFM signal, light blue lines for reference signals).

Detection process when signal is NOT in the reference range: a time–frequency characteristic of all the signals; b detection process
Figure 3b shows the maximum CCFs \(f\left( \mu \right)\) depending on the reference chirp rates (blue line) and adaptive threshold value \(\rho_{1}\) (red line). It is clear that the signal is not detected, or its chirp rate \(\mu\) is not estimated. In this example, another way to estimate the chirp rate \(\mu\) of the signal is required, such as Eq. (7).
In this situation, it is possible to see that \(f_{\max } \left( \mu \right) = 38.08{\text{ dB}}\) is at \(\mu = 190 \, \left( {{\text{GHz}}{\text{.s}}^{{ - 1}} } \right)\)(the maximum \({{\varvec{\upmu}}}_{{{\mathbf{ref}}}}\)), so it confirmed that, the estimated chirp rate is not correct. Moreover, even when estimated \(\mu \in {{\varvec{\upmu}}}_{{{\mathbf{ref}}}}\) but exceeds the range of \(\left[ {0.1, \, 0.9} \right]{{\varvec{\upmu}}}_{{{\mathbf{ref}}}}\), it is still neccessary to adjust reference set to get a more precise estimation. By expanding the reference chirp rates by two times, the simulated and the first reference signal set parameters are available in Table 3.
The new reference signal set were generated with the adjusted parameters to detect the signal.
2.1.2 Signal detection
When the received signal belongs to the reference range, the time–frequency characteristic of all the signals is shown in Fig. 4a. Figure 4b shows the maximum of CCFs \(f\left( \mu \right)\), as a function of the reference signal chirp rates, (blue line), and adaptive threshold \(\rho_{1}\) (red line).

Detection process when signal is in the reference range: a time–frequency characteristic of all the signals; b detection process
It also shows that the estimated chirp rate is \(\mu = 200{\text{ GHz}}{\text{.s}}^{ - 1}\) with \(f\left( \mu \right) = 38.24{\text{ dB}}\), also we have \(k = \frac{{\mu_{estimated} }}{{\mu_{{ref_{\max } }} }} = \frac{200}{{380}} = 0.53 \in \left[ {0.1, \, 0.9} \right] \, {{\varvec{\upmu}}}_{{{\mathbf{ref}}}}\). It means the signal is detected in the first stage of this technique.
2.2 Pulse width estimation
The second stage of the technique is the pulse width estimation. This stage is performed only after the signal was detected. It means that the chirp rate \(\mu\) of the received signal is known. This section discusses the main challenges involved in the pulse width estimation process.
2.2.1 False pulse width estimation
Using the same example of the failed detection as above, the pulse width of the received signal is out of the reference pulse width range \(\tau \notin {{\varvec{\uptau}}}_{{{\mathbf{ref}}}}\) (see Fig. 5a, Table 4).

Pulse width estimation when signal is NOT in the reference range: a time–frequency characteristics; b pulse width estimation
Figure 5a shows the time–frequency characteristic of all the signals. Figure 5b shows maximum CCFs \(f\left( \tau \right)\), as a function of \({{\varvec{\uptau}}}_{{{\mathbf{ref}}}}\) (blue line), and the adaptive threshold \(\rho_{2}\) (red line). It is clear that the pulse width \(\tau\) is not estimated. To deal with this issue, another way to estimate the pulse width is required such as Eq. (8).
In the same case as in the detection process, it can be seen that \(f_{\max } \left( \tau \right) = 31.65{\text{ dB}}\) at the value \(\tau = 10 \, \left( {{\mu s}} \right)\)(the maximum value of \({{\varvec{\uptau}}}_{{{\mathbf{ref}}}}\)), it confirmed that the estimated pulse width is not correct. Moreover, even when \(\tau \in {{\varvec{\uptau}}}_{{{\mathbf{ref}}}}\) but exceeds the range of \(\left[ {0.1, \, 0.9} \right]{{\varvec{\uptau}}}_{{{\mathbf{ref}}}}\), it is needed to adjust the second reference signal set to get more precision estimation. By expanding the reference pulse width by two times, the parameters of all signals are described in Table 5.
2.2.2 Pulse width estimation
In this example, the received signal’s pulse width \(\tau\) is within the observed reference pulse widths \(\tau \in {{\varvec{\uptau}}}_{{{\mathbf{ref}}}}\)(see Table 5). The time–frequency characteristic of all the signals is shown in Fig. 6a. Figure 6b shows the maximum CCFs \(f\left( \tau \right)\) depending on \({{\varvec{\uptau}}}_{{{\mathbf{ref}}}}\) (blue line) and the adaptive threshold \(\rho_{2}\) (red line). The figure clearly shows that the estimated pulse width is \(\tau = 15\,\,\,\,\,\,\,\,\,\mu s\) with \(f\left( \tau \right) = 38.38{\text{ dB}}\), also we have \(k = \frac{{\tau_{estimated} }}{{\tau_{{ref_{\max } }} }} = \frac{15}{{20}} = 0.75 \in \left[ {0.1, \, 0.9} \right] \, {{\varvec{\uptau}}}_{{{\mathbf{ref}}}}\), and it confirms that the pulse width is estimated. Based on the above simulation results, it is clear that the technique can detect and estimate the signal parameters without a signal database, unlike the methods described in Sect. 1. In the next section, the proposed method will be subjected to radar signal detection under different conditions: strong noise environment a mixture of CW signal and noise.

Pulse width estimation when signal is in the reference range: a time–frequency characteristics; b pulse width estimation
The performance of the proposed method for detecting and estimating the parameters of LFM signals depending on the number of reference signals (N) is shown in Table 6.
In conclusion, a more significant number of reference signals is, a more precise estimation is, but increases the processing time. In general, the method is helpful for detecting and estimating the parameters of the unknown LFM signal under high noise conditions. As we mentioned above, the algorithm focuses only on signal detection. In other words, we consider whether a signal is a mixture of signal and noise and how fast the detection process is.
We don’t pay much attention to how accurate parameter estimation is, but it still should be good enough. So, for the next simulation and verification, the number of reference signals is constantly set to 100 for all examples.
3 Simulation and experimental results
The section above discussed the basic principles and challenges of the proposed method. In this section, the proposed method’s simulations undergo a single-component and multi-component analysis of the Intra-pulse modulated radar signal s in (1) intense white Gaussian noise and (2) an environment affected by CW signal and noise. For both interference conditions, the proposed technique will be first subjected to a single-component LFM [17, 18], a multi-component LFM signal analysis [19], and then with a single BPSK signal analysis [20, 24]. After that, the tests are done with a mixture of LFM and BPSK signals. All the tests are performed under the condition that \(\mu \in {{\varvec{\upmu}}}_{{{\mathbf{ref}}}}\) and \(\tau \in {{\varvec{\uptau}}}_{{{\mathbf{ref}}}}\).
3.1 Single-component LFM signal
In this section, the proposed method’s analysis with a single-component LFM signal under different conditions: intense white Gaussian noise, a mixture of white noise, and jamming by CW signal will be re-shown.
3.1.1 Single-component LFM signal in a strong white noise
Firstly, the problem of analyzing the LFM signal in a strong white Gaussian noise was solved using the proposed technique. The parameters of simulated signals are available in Tables 2 and 4. The solution was presented in previously work [17]. The simulation and experimental results are shown in Fig. 7, and they confirm that the proposed method was able to detect the LFM signal in white noise environments with \(SNR \ge - 18{\text{ dB}}\) (\(P_{d} = 90.19\%\) red line) and \(SNR \ge - 14{\text{ dB}}\) for estimating its pulse width (\(P_{ce} = 96.35\%\), blue line).

Simulation of probability development
3.1.2 Single-component LFM signal affected by CW signals and noise
In this part, the accuracy of the proposed method is shown by analyzing a single-component LFM signal jammed by CW signals and white Gaussian noise. The solution was presented in previously published work [18]. Figure 8a shows the probability of detection as a function of \(SNR\)(\(P_{d} \left( {SNR} \right)\)). This figure shows that the technique can detect the LFM signal affected by the first CW signal and noise with \(SNR \ge - 11{\text{ dB}}\)(\(P_{d} = 94.25\%\), redline);\(SNR \ge - 8{\text{ dB}}\) (\(P_{d} = 96.73\%\), blue line), the LFM signal is affected by two CW signals (the second and third CW) \(SNR \ge - 7{\text{ dB}}\) (\(P_{d} = 97.65\%\), black line), the LFM signal is affected by all three CW signals and white Gaussian noise. Overall, the simulation results confirmed that the proposed technique is suitable for extracting the LFM signal from the mixture of the CW signals and noise, with the lowest \(SNR \ge - 7{\text{ dB}}\).

Simulation of probability development: a detection; b pulse width estimation
As in the detection process, the probability of correct pulse width estimation of the LFM signal is shown in Fig. 8b. It is clear that the proposed technique is able to estimate the pulse width of the LFM signal affected by the first CW signal and noise with \(SNR \ge - 10{\text{ dB}}\) (\(P_{ce} = 96.00\%\), red line); at \(SNR \ge - 8{\text{ dB}}\) the LFM signal is affected by the second and third CW signal and noise (\(P_{ce} = 91.62\%\), blue line) and at \(SNR \ge - 7{\text{ dB}}\) by the mixture of all three CW signals and noise (\(P_{ce} = 91.67\%\), black line). The simulation results showed that the proposed method is more effective than the abovementioned methods for detecting and estimating signals affected by CW signals and white noise.
3.2 Multi-component LFM signals
This section shows the proposed method's accuracy by analyzing multicomponent crossed LFM signals under different conditions: intense white Gaussian noise affected by CW signals and noise (see Fig. 9). The solution was presented in previously work [19].

Time–frequency characteristics of signals: a whithout CW signal; b with CW signal
3.2.1 Two crossed LFM signals in a strong white noise
Firstly, the proposed method was applied to analyze two crossed LFM signals in a strong white Gaussian noise. Figure 10 clearly shows that the proposed technique provides higher accuracy to analysis of the second signal (blue line), followed by the first signal (red line).

Simulation of probability development: a detection; b pulse width estimation
In addition, to detect two LFM signals, \(SNR \ge - 18{\text{ dB}}\) is required and to estimate its pulse width, \(SNR \ge - 15{\text{ dB}}\) is required. Overall, to detect and estimate the parameters of all the LFM signals in white noise, \(SNR \ge - 15{\text{ dB}}\) is required.
3.2.2 Two crossed LFM signals affected by CW signal and white noise
Besides detecting two LFM signals in white noise conditions, the authors in [19] also took the addition of CW jamming as a condition to study.
The probability of signal detection depending on SNR is shown in Fig. 11a. It is clear that to detect all the LFM signals, the proposed technique requires \(SNR \ge - 14{\text{ dB}}\) (\(P_{d} \ge 90\%\)) and estimating their pulse width \(SNR \ge - 12{\text{ dB}}\) is required. Overall, the proposed technique can detect and estimate of parameters of all the LFM signals, even when affected by jamming, with input \(SNR \ge - 12{\text{ dB}}\)(see Fig. 11b).

Simulation of probability development: a detection; b pulse width estimation
These simulation results confirmed that the proposed technique can determine and estimate the parameters of single-component LFM signals and multi-component LFM signals in a strong white Gaussian noise. Moreover, this technique is effective even when analyzing these signals affected by jamming CW signals and noise. In the following sections, the functionality of this technique will be verified by analyzing a mixture of LFM and BPSK signals.
3.3 Single-component BPSK signals in a strong white noise
In this section, the functionality of this technique is described by analyzing BPSK signals in the form of Barker Codes 7, 11, and 13. Similarly, this issue was discussed and presented in previously published work [20, 24]. The parameters of simulated signals are listed in Table 7.
The simulation results are shown in Fig. 12. In terms of SNR, the proposed technique obtains the highest detection probability and correct pulse width estimation for BPSK with Barker Code 13 (red line, see Fig. 12), followed by Barker Code 11 (blue line) and the lowest detection probability for Barker Code 7 (black line). Overall, the proposed method can detect all the BPSK signals with the input \(SNR \ge - 30{\text{ dB}}\) and to estimate the pulse width of all signalsthe proposed method requires the \(SNR \ge - 21{\text{ dB}}\).

Simulation of probability development: a detection; b pulse width estimation
Overall, the above-described simulations confirmed that the proposed technique helps analyze single-component LFM signals, multicomponent LFM signals, and BPSK signals, all in a strong white Gaussian noise or affected by CW signals jamming. In the next section, the accuracy of the proposed method will be studied by analyzing the received signal, containing LFM and BPSK signals, in a strong white Gaussian noise.
3.4 A mixture of LFM and BPSK signals
This section will study this method’s functionality by analyzing the mixture of LFM and BPSK signals in a strong white Gaussian noise. The parameters of all the signals are listed in Table 8. The time–frequency characteristic of all the signals and the amplitude spectrum of the received signal with \(SNR = - 5{\text{ dB}}\) is shown in Fig. 13. It is clear that the primary method, based on FFT, could not separate the LFM signal from the mixture of LFM and BPSK signals and white Gaussian noise.

Simulation signals: a time–frequency charateristics; b amplitude spectrum
The detection probability \(P_{d}\) for each signal, as a function of \(SNR\), is shown in Fig. 14a. It is clear that the proposed method is more accurate in detecting the BPSK signal (blue line) than in detecting the LFM signal (red line). Also, the proposed method requires \(SNR \ge - 18{\text{ dB}}\) for detecting BPSK signal (\(P_{d} = 94.01\%\)) and \(SNR \ge - 16{\text{ dB}}\)(\(P_{d} = 95.59\%\)) for detecting LFM signal. Overall, to detect all the signals with \(P_{d} \ge 90\%\), the proposed technique requires \(SNR \ge - 16{\text{ dB}}\).

Simulation of probability development: a detection; b pulse width estimation
The same as for the detection probability, each signal’s correct pulse width probability \(P_{ce}\) is a function of \(SNR\), shown in Fig. 14b. This figure shows that the proposed method has better accuracy for estimating the pulse width of the LFM (\(P_{ce} = 93.34\%\) at \(SNR = - 14{\text{ dB}}\), red line), than for the BPSK (\(P_{ce} = 90.65\%\) at \(SNR = - 12{\text{ dB}}\), blue line). Overall, to estimate the pulse width of all the signals, the required \(SNR\) is \(SNR \ge - 12{\text{ dB}}{.}\) The simulation results proved that the proposed method helps detect and estimate single-component and multicomponent Intra-pulse modulated radar signal s, all in a strong white Gaussian noise or affected by jamming CW signals. In the next section, the functionality of the proposed method is tested with real-time Intra-pulse modulated radar signal s in a strong complex environment.
4 Experimental results
In this section, the functionality of the proposed method is verified by analyzing Intra-pulse modulated radar signal s generated by PSG signal vector generator E8267C. A spectrum analyzer and oscilloscope are used as amplitude detectors (see Fig. 15).

The experimental setup
4.1 Test with single-component LFM signal in a strong white noise
Based on the simulation results as shown in the previous section, the accuracy of this technique was tested with a single-component LFM signal in white Gaussian noise with \(SNR = - 14{\text{ dB}}\) [18].
The analysis results of the proposed method are presented in Fig. 16. This figure clearly shows that the detected chirp rate of the received signal is \(\mu = 200{\text{ GHz}}{\text{.s}}^{ - 1}\) with CCF \(f\left( \mu \right) = 8.38{\text{ dB}}\) (see Fig. 16a); also, its estimated pulse width is \(\tau = 15 \, \mu {\text{s}}\) with CCF \(f\left( \tau \right) = 8.46{\text{ dB}}\) (see Fig. 16b). The thresholds are set based on the CFAR block with \(P_{d} = 90\%\) and \(P_{fa} = 10^{ - 12}\).

Analysis results: a chirp rate estimation; b pulse width estimation
The test results confirmed that the proposed method is useful for detecting and estimating the parameters of the LFM signal in an intense white Gaussian noise.
4.2 Test with single-component LFM signal affected by CW signals
This section recalls the test of the functionality of the method tested by analyzing a single LFM signal affected by three CW signals and white noise [18]. Based on the simulation results, the tested LFM signal is generated at \(SNR = - 7{\text{ dB}}\) in the mixture of three CW signals and noise. Figure 17 shows the results of the proposed method. This figure clearly shows that the estimated chirp rate is \(\mu = 190{\text{ GHz}}{\text{.s}}^{ - 1}\) with \(f\left( \mu \right) = 1.09{\text{ dB}}\), and its estimated pulse width is \(\tau = 15.8 \, \mu {\text{s}}\) with CCF \(f\left( \tau \right) = 1.09{\text{ dB}}\). Overall, the tested results confirmed that the proposed method is able to extract the LFM signal even when affected by jamming CW signals and noise. In the next step, the accuracy of the proposed method will be verified by analyzing multicomponent LFM signals.

Analysis results: a chirp rate estimation; b pulse width estimation
4.3 Test with multicomponent LFM signals
The functionality of this method was verified by analyzing multicomponent LFM signals under the conditions: strong white Gaussian noise and jamming CW signals and noise [19].
4.3.1 Two crossed LFM signals in a strong white noise
Firstly, it is necessary to verify the functionality of this method with two crossed LFM signals in a strong white Gaussian noise. Based on the simulation results, the test LFM signal was generated with \(SNR = - 15{\text{ dB}}\) and was approved that it is difficult to detect or estimate parameters of the two LFM signals by using DSA 814 or RTO 1044.
Figure 18 shows that the proposed technique is more effective than the amplitude detector (spectrum analyzer and oscilloscope). In addition, the proposed technique can extract two LFM signals in a strong white Gaussian noise. The estimated chirp rate of these LFM signals are \(\mu_{1} = 105{\text{ GHz}}{\text{.s}}^{ - 1}\) with \(f\left( \mu \right) = - 1.13{\text{ dB}}\) and \(\mu_{2} = 200{\text{ GHz}}{\text{.s}}^{ - 1}\) with \(f\left( \mu \right) = 0.75{\text{ dB}}\). Also, the pulse widths of these signals are \(\tau_{1} = 9.8 \, \mu {\text{s}}\) \((f\left( \tau \right) = - 0.04{\text{ dB)}}\) and \(\tau_{2} = 15.6 \, \mu {\text{s}}\) with \(f\left( \tau \right) = 1.12{\text{ dB}}\). The test results confirmed that the technique is useful for detecting and estimating parameters (separating) of two crossed LFM signals in a strong Gaussian noise.

Analysis results: a chirp rate estimation; b pulse width estimation
4.3.2 Two crossed LFM signals affected by CW signal
This section shows results of the method's functionality by analyzing two crossed LFM signals affected by jamming CW signals and noise. The test signal was generated based on the simulation results [19].
Results of the analyzed generated signal by the proposed method are shown in Fig. 19. This figure clearly shows that the estimated chirp rates of the generated signal are \(\mu_{1} = 95{\text{ GHz}}{\text{.s}}^{ - 1}\) with CCF \(f\left( \mu \right) = 0.43{\text{ dB}}\) and \(\mu_{2} = 200{\text{ GHz}}{\text{.s}}^{ - 1}\) with \(f\left( \mu \right) = 1.90{\text{ dB}}\). Also, the estimated pulse widths of the generated signals are \(\tau_{1} = 10.2 \, \mu {\text{s}}\) with CCF \(f\left( \tau \right) = - 1.78{\text{ dB}}\) and \(\tau_{2} = 15.0 \, \mu {\text{s}}\) with \(f\left( \tau \right) = 0.12{\text{ dB}}\).

Analysis results: a chirp rate estimation; b pulse width estimation
4.4 Test with single BPSK signal in a strong white noise
In this section, the functionality of the proposed method is illustrated by analyzing the single BPSK signal in the form of the Barker Code 7, 11, 13 under high noise conditions. Based on the simulation results, the test signals are generated at \(SNR = - 21{\text{ dB}}\) (see Fig. 20).

Generated Barker-7 BPSK signal: a time domain; b amplitude spectrum
The results of the analyzed generated signals are given in Fig. 21 and Table 9. The results confirmed that the proposed method is useful for detecting and estimating the parameters of single-component BPSK under high noise conditions.

Analysis results: a carrier frequency estimation; b pulse width estimation
Next, we will test the method’s functionality with a single BPSK signal in the form of Barker codes 7, 11, and 13 and a mix of BPSK and LFM signals in intense white noise using the same setup as in [8, 17,18,19,20].
4.5 Test with mixture of LFM and BPSK signals
The last step of this section is to verify the functionality of the proposed method by analyzing a mixture of LFM and BPSK signals. Based on the simulation results, the test signal is generated at \(SNR = - 12{\text{ dB}}\) (see Fig. 22). It is clear that the spectral analyzer can not detect nor estimate the parameters of LFM or BPSK signals.

Generated signal: a time domain; b amplitude spectrum
The estimated parameters of LFM and BPSK signals, using the proposed method, are shown in Fig. 23 and Table 10. The experimental results show that the proposed method is able to detect and estimate the parameters of all the signals in strong white Gaussian noise with \(SNR = - 12{\text{ dB}}\). The proposed method's performance compared to other methods is shown in Table 11. In terms of SNR, the advantage of this method is higher accuracy and does not require a large database such as ML/AI.

Analysis results: a chirp rate of LFM signal; b pulse width of LFM signal; c carrier frequency of BPSK signal; d pulse width of BPSK signal
5 Conclusion
The main aim of this review is to increase the range of the passive surveillance system on radars with intra-pulse modulation, where LFM and BPSK signals are the most frequent. The biggest challenge is to detect such signals that were irradiated only by the sidelobes of a radar antenna without knowing their parameters (chirp rate, pulse width, carrier frequency). The advanced technique for detecting and estimating radar signal parameters in a strong noise environment, based on a cross-correlation function, which was proposed, is revised and verified more in this review. The simulation results showed that the proposed technique can detect and estimate the parameters of single-component signals, multicomponent signals, and a mixture of radar signal s in a strong noise environment.
It is clear that, in terms of the SNR, the proposed method has a lower detection probability for the BPSK signal (\(P_{d} = 94.01\%\) at \(SNR = - 18{\text{ dB}}\)) than for the LFM signal with \(P_{d} = 95.59\%\) at \(SNR = - 16{\text{ dB}}\). On the other hand, this technique provides a higher probability of pulse width estimation for the LFM signal (\(SNR = - 14{\text{ dB}}\)), than for the BPSK signal at \(SNR = - 12{\text{ dB}}\).
Based on the simulation results, an algorithm was verified on generated signals from the PSG EC8267C vector signal generator in the second part of this work. The experimental results confirmed that this method is useful for detecting and estimating parameters of LFM signals in noise at \(SNR \ge - 17{\text{ dB}}\), and of BPSK signals at \(SNR \ge - 21{\text{ dB}}\).
In addition, detecting and estimating single-component LFM signal parameters in a mixture of CW signals and noise required an \(SNR \ge - 7{\text{ dB}}\). Whereas multicomponent LFM signals it required an \(SNR \ge - 14{\text{ dB}}\). This technique also required an \(SNR \ge - 14{\text{ dB}}\) for detecting and estimating LFM signal parameters (chirp rate, pulse width) in a mixture of LFM, BPSK and noise, and an \(SNR \ge - 12{\text{ dB}}\) for detecting and estimating BPSK signal parameters (its carrier frequency, pulse width).
Moreover, the proposed method outperforms the existing methods for analyzing Intra-pulse modulated radar signals. The lowest \(SNR \ge - 17{\text{ dB}}\) for detecting LFM signal, and \(SNR \ge - 21{\text{ dB}}\) for detecting the BPSK signal, while the existing methods based on machine learning and artificial intelligence require an \(SNR \ge - 8{\text{ dB}}\) (see Table 11). The advantages of the proposed methods are: the accuracy of this method does not depend on the size of the sample signals (database), whereas the methods based on ML/AI only perform when using a database; the proposed method is simple to implement into any electronic receivers (based on matched filters) and is able to detect and estimate not only multicomponent LFM signals, also a mixture of LFM and BPSK signals.
References
Nadav L, Eli M (2004) Radar signals. Wiley, New Jersey, Canada
Jonathan YS (2000) Digital signal processing: a computer science perspective. Wiley-Interscience, New Jersey, p 354
Richards AP (2014) Electronic warfare receivers and receiving systems. Artech House, England
Richards GV (2014) ELINT the interception and analysis of radar signals. Artech House, England
Duan Y, Wang J, Su S, Chen Z (2014) Detection of LFM signals in low SNR based on STFT and wavelet denoising. 2014 international conference on audio, language and image processing. ACM, New York, pp 921–925
Zhou R, Liu AJ, Pan XF (2014) An improved parameter estimation algorithm based on FFT for LFM signal. Appl Mech Mater. https://doi.org/10.4028/www.scientific.net/AMM.519-520.1000
Yang Z, Sun I, Guo P, Zhang Y (2017) A method of symbol rate estimation based on wavelet transform for digital modulation signals. DEStech Trans Comput Sci Eng. https://doi.org/10.12783/dtcse/cii2017/17280
Hatoun R, Ghanith A, Pujolle G (2014) Generalized wavelet-based symbol rate estimation for linear single carrier modulation in blind environment. Eur Sci J. https://doi.org/10.19044/esj.2014.v10n15p%25p
Swiercz E, Janczak D, Konopko K (2016) Detection of LFM radar signals and chirp rate estimation based on time-frequency rate distribution. Sensors. https://doi.org/10.3390/s21165415
Zhang W, Sun F, Wang B (2017) Radar signal intra-pulse feature extraction based on improved wavelet transform algorithm. Int J Commun Netw Syst Sci 10:118–127. https://doi.org/10.4236/IJCNS.2017.108B013
Xiaolong C, Qiaowen J, Ningyuan S (2019) LFM signal detection and estimation based on deep convolutional neural network. 2019 Asia-Pacific signal and information processing association annual summit and conference. IEEE, New York, pp 753–758
Shunjun W (2020) Intra-pulse modulation radar signal recognition based on CLDN network. IET Radar Sonar Navig 14:803–810. https://doi.org/10.1049/iet-rsn.2019.0436
Wan J, Yu X, Guo Q (2019) LPI radar waveform recognition based on CNN and TPOT. Symmetry 11:725. https://doi.org/10.3390/sym11050725
Zhang X, Zhang J, Luo T, Huang T, Tang Z, Chen Y, Li J, Luo D (2022) Radar signal intrapulse modulation recognition based on a denoising-guided disentangled network. Remote Sens 14:1252. https://doi.org/10.3390/rs14051252
Ma Z, Huang Z, Lin A, Huang G (2020) LPI radar waveform recognition based on features from multiple images. Sensors 20:526. https://doi.org/10.3390/s20020526
Quan D, Tang Z, Wang X (2022) LPI radar signal recognition based on dual-channel CNN and feature fusion. Symmetry. https://doi.org/10.3390/sym14030570
Duong VM, Vesely J, Hubacek P, Phan NG (2021) Parameter estimation of LFM signal in low signal-to-noise ratio using cross-correlation function. Adv Electric Electron Eng 19(3):222–230. https://doi.org/10.15598/aeee.v19i3.4071
Duong VM, Vesely J, Nguyen TP (2022) Possibility in analyzing real-time LFM signals under complex jamming conditions. 2022 IEEE ninth international conference on communications and electronics. IEEE, New York, pp 289–294
Duong VM, Nguyen TP, Phan NG, Nguyen VH, Nguyen TT (2022) Advanced method for detecting multi-component lfm signals in a complex interference environment. 2022 RIVF international conference on computing and communication technologies (RIVF). IEEE, New York, pp 220–225
Duong VM, Vesely J, Hubacek P, Premysl J, Phan NG (2022) Detection and parameter estimation analysis of binary shift keying signals in high noise environments. Sensors 22(9):3203. https://doi.org/10.3390/s22093203
Mark R (2005) Fundamentals of radar signal processing. McGraw Hill, New York
Dejan I, Milenko A, Bojan Z (2014) A new model of CFAR detector. Frequenz 68(3–4):125–136. https://doi.org/10.1515/freq-2013-0087
Shrivathsa VS (2018) Cell averaging constant false alarm rate detection in radar. Int Res J Eng Technol 05(07):2395–2456
Duong VM, Vesely J, Hubacek P, Phan NG (2021) Detection and parameters estimation of binary phase shift keying signals in low signal-to-noise ratio. International radar symposium, Berlin, pp 1–11
Acknowledgements
The work presented in this review was supported by: The Czech Republic Ministry of Education, Youth and Sports—University of Defence student research program –“Modern Methods of Generation, Direction Control and Signal Processing”. The Czech Republic Ministry of Defence—University of Defence development program “AIROPS—Conduct of Airspace Operations”.
Funding
This study was funded by the project of the Technology Agency of the Czech Republic No. TM02000035—Advanced Signal Classification (NEOCLASSIG) for Radio Exploration Systems.
Author information
Authors and Affiliations
Contributions
MD and JV: Methodology, Software, Validation, Investigation. VMD and JV wrote the main manuscript text JV: Supervi-sion, Project administration. PJ, and PH: Formal analysis, Writing—review and editing, XLT prepared figures All authors reviewed the manuscript. All authors have read and agreed to the published version of the manuscript.
Corresponding author
Ethics declarations
Conflict of interest
The authors declare no conflict of interest.
Additional information
Publisher's Note
Springer Nature remains neutral with regard to jurisdictional claims in published maps and institutional affiliations.
Rights and permissions
Open Access This article is licensed under a Creative Commons Attribution 4.0 International License, which permits use, sharing, adaptation, distribution and reproduction in any medium or format, as long as you give appropriate credit to the original author(s) and the source, provide a link to the Creative Commons licence, and indicate if changes were made. The images or other third party material in this article are included in the article's Creative Commons licence, unless indicated otherwise in a credit line to the material. If material is not included in the article's Creative Commons licence and your intended use is not permitted by statutory regulation or exceeds the permitted use, you will need to obtain permission directly from the copyright holder. To view a copy of this licence, visit http://creativecommons.org/licenses/by/4.0/.
About this article

Cite this article
Duong, V.M., Vesely, J., Hubacek, P. et al. Detection and parameter estimation of intra-pulse modulated radar signals in complex interference environments+. SN Appl. Sci. 5, 184 (2023). https://doi.org/10.1007/s42452-023-05403-x
Received:
Accepted:
Published:
DOI: https://doi.org/10.1007/s42452-023-05403-x