
Abstract
The roots of Morus species are well described in the Pharmacopoeia of the People's Republic of China (ChP) for its traditional use in treating liver fibrosis due to its hepatoprotective property. However, little is known about the hepatoprotective effect of the roots of Morus indica L. (RoMi), and the pharmacological mechanism(s) are uncertain due to its intricacy. Therefore, this study evaluates the hepatoprotective activity of the ethanolic extract of RoMi (eRoMi) against the CCl4-induced in-vivo animal model at different dosages (100 and 200 mg/kg BW) in comparison with silymarin as a positive control. The hepatoprotective activity of eRoMi was evaluated by measuring the levels of serum biomarkers, hepatic antioxidant enzymes and was verified by histological studies. Interestingly, 1,2-bis(trimethylsilyl) benzene, 1,4-phenylenebis (trimethylsilane), 2,4,6-cycloheptatriene-1-one, 3,5-bis-trimethylsilyl and α-amyrin were the active components found in eRoMi as detected by GC–MS. Oral administration of eRoMi (200 mg/kg BW) to rats significantly protected serum biochemical parameters (increased ALT, AST, LDH, bilirubin and GGT as well as depletion of antioxidant enzymes and hepatic GSH) and elevation in hepatic lipid peroxidation as compared to CCl4-treated rats. The hematological indices such as erythrocytes, hemoglobin, monocytes and lymphocytes were also normal in eRoMi-treated rats. The histopathological evaluation indicated a significant restoration of liver structure as compared to silymarin. This study is the first scientific validation for the traditional use of eRoMi to understand its hepatoprotective activity.
1 Introduction
Hepatotoxicity or liver damage is characterized by metabolic dysfunction and histopathological patterns such as neoplasms, vascular lesions, granuloma, steatosis, cholestasis, hepatitis, and zonal necrosis, which represents 5% of all injuries, making it frequent to known injury. As a consequence, there are more than a million casualties reported in a year, which are indirectly due to liver disfigurement or hepatocellular carcinoma [1]. Conventional or synthetic drugs protect us from various external and internal ailments. Unfortunately, the drugs used to treat liver diseases are dis-satisfactory because they do not offer complete protection to the organ and can exert serious long-term side effects [2,3,4,5]. Therefore, it is crucial to understand the role of complementary and alternative medicine (CAM) as an alternative to cure liver damage [6, 7]. CAM is understood to have satisfactory clinical efficacy with low adverse side effects due to its richness in polyphenols [8, 9]. Hence, food rich in plant polyphenols may assist in slimming down the threat of chronic ailments [5, 10,11,12,13,14].
Morus indica L. (commonly known as mulberry) is one of the various Morus species belonging to the family Moraceae. It is evidenced for its traditional uses in the Chinese Pharmacopoeia 1985 [15, 16] and Indian traditional medicinal system (Ayurveda) for its hepatoprotection/anti-hepatotoxicity and various other pharmacological properties. Notably, da Silva Almeida et al. [15] mentioned that the Chinese Pharmacopoeia 1985 had listed the roots and other parts of the mulberry plant as having medicinal properties. Chopra et al. [17] first documented the traditional uses of the crude drug "Sohakuhi", prepared from the root bark of certain species of Morus, followed by Konno et al. [18] in their report as an antitussive, diuretic, expectorant and tonic in oriental medicine. Chatterjee et al. [19] indicated the anti-inflammatory and antipyretic activities of M. indica. The root barks of Morus plants are generally called as Sang-Bai-Pi in Chinese and used for the treatment of hepatotoxicity, inflammatory and respiratory diseases [20].
The leaves of M. indica were identified to protect pancreatic β-cell destruction in streptozotocin (STZ)-induced diabetic male Wistar rats [21]. Natić et al. [22] reported that phenolics in Morus alba L. mainly contain caffeic acid, ferulic acid, flavonol glycosides, flavan-3-ols, p-coumaric acid, and protocatechuic acid. Recent studies showed that novel compounds including polyhydroxylated alkaloids, (2R,3R,4R)-2-hydroxymethyl-3,4-dihydroxypyrrolidine-N-propionamide and 4-O-α-D-galactopyranosyl-calystegine B2, and 3β,6β-dihydroxynortropane have been isolated from the root extracts of M. indica using ion-exchange resins by column chromatography technique [23, 24]. Previously, several studies involving Morus species like Morus alba L., Morus indica L., and Morus nigra were reported to show hepatoprotective activity [25,26,27]. Notably, compounds like 2,5-dihydroxy-4,3′-di(β-D-glucopyranosyloxy)-trans-stilbene and mulberroside A found in Morus plant extracts have been shown to exert hepatoprotective effects, with the latter showing P-glycoprotein inhibitory effects [20, 28].
However, to the best of our knowledge, there is no proper scientific evidence available on the hepatoprotective activity of the roots of M. indica (RoMi). Therefore, the aim of this study was to investigate the hepatoprotective activity of the ethanolic extract of RoMi (eRoMi) in carbon tetrachloride (CCl4)-induced hepatic damage in rats. In addition, the qualitative and quantitative levels of the components of eRoMi were explored using Gas chromatography coupled with mass spectrometry (GC–MS) in this study.
2 Materials and methods
2.1 Chemical and reagents
Acetic acid (CH3COOH), butanol (C4H9OH), bovine serum albumin (BSA), di-potassium hydrogen phosphate (K2HPO4), EDTA, eosin, epinephrine, formalin, hematoxylin, hydrogen peroxide (H2O2), potassium di-hydrogen phosphate (KH2PO4), sodium carbonate (Na2CO3), sodium bicarbonate (NaHCO3), ethanol (C2H5OH), thiobarbituric acid (TBA), tetramethoxypropane, sodium dodecyl sulphate (SDS), Triton-X 100 and pyridine were procured from Merck, Mumbai, India. Bradford reagent, glutathione (GSH) reductase, nicotinamide, epinephrine, reduced GSH and tert-butyl hydroperoxide were bought from Sigma-Aldrich, India. Silymarin was procured from an indigenous pharmacy store, Bangalore, India.
2.2 Collection and preparation of roots of M. indica (RoMi) extract
The roots were collected from the Bishmuri Bashbari area (latitude: 26°33′42.6″N and longitude: 90°16′17.2″E) in the month of April–May, 2017, Kokrajhar, Assam, India. The plant roots were identified and authenticated by Dr. A.A. Mao, B.S.I. Shillong, Meghalaya, India and deposited to B.S.I. herbarium for future reference (V.No: BSI/ERC/Tech/Plant Iden./2015/68/Coll No. 013). The roots were oven-dried at 40 °C for 20 days, powdered and stored in an air-tight container. The 100 g roots were extracted with 1000 ml of 70% ethanol v/v (70:30) under nitrogen, shaken well and stored in the dark at room temperature (RT; 25 °C) for 48 h. The extract was then filtered using Whatman no.42 filter paper. The extracted contents were centrifuged at 10,000 g for 20 min, followed by purging with nitrogen [29]. The extract was concentrated using a Telstar LyoQuest benchtop freeze dryer and stored at 4 °C for further study.
2.3 Gas chromatography coupled with mass spectrometry (GC–MS) analysis
The analysis of eRoMi was performed by PerkinElmer gas chromatography (Clarus 680) coupled with mass spectrometry (Clarus 600 EI) employed with fused silica column and packed with capillary column Elite-5MS (5% biphenyl 95% dimethylpolysiloxane, 30 m × 0.25 mm ID × 250 μm df). The components were separated using Helium as carrier gas at a constant flow of 1 ml/min. The injector temperature was set at 260 °C during the chromatographic run. The extract sample (1 μl) was injected into the instrument with an oven temperature at 60 °C (2 min) with an increasing rate of 10 °C/min until it reached 300 °C, where it was held for 6 min. The mass detector conditions were: transfer line temperature 240 °C; ion source temperature 240 °C; and ionization mode electron impact at 70 eV, a scan time 0.2 s and scan interval of 0.1 s. The fragment sizes from 40 to 600 Da were scanned. The spectrums of the components were compared with the database of the spectrum of known components stored in the GC–MS NIST (2008) library.
2.4 Animals and care
Thirty healthy male Wistar albino rats weighing 210–250 g were used for the experiment. The animals were housed in polypropylene standard cages (46 × 24 × 20 cm) (Tarson, India), with rice husk as bedding material, having six animals per cage in a standard environmental condition (26 ± 3 °C, 65 ± 1% relative humidity, and light control room with a 12-h dark/light cycle). They were allowed to acclimatize for 1–2 weeks and were fed with standard pellet feed (Lipton India Ltd., Bangalore, India) and water ad libitum. The experiments with animals were performed as per the legislation for the protection of animals used for scientific purposes.
2.5 Ethical statement
All the experiments were performed in strict accordance with standard guidelines accepted internationally. The ethical approval was obtained from Maharani Lakshmi Ammanni College Ethical Committee (1368/ac/10/CPCSEA), Bangalore, India for the care and use of laboratory animals.
2.6 Acute toxicity study
OECD guidelines (test 423: Acute oral toxicity-Acute toxic class method; 2002) were followed to study the acute toxicity of the RoMi extract (OECD Library, 2002). All the animals (12 male Wistar albino rats) were kept on fasting overnight prior to the experiment. Decreasing doses beginning with 2000 mg/kg (3 animals of each sex) were tested only when toxicity signs were observed at this limit dose. The followed concentrations were determined as per OECD guidelines. The eRoMi extract was administered orally in an increasing dose of 250, 500, 1000 and 2000 mg/kg body weight (BW). After feeding of various doses of the extract, all the rats were carefully observed for the development of clinical or toxicological symptoms at 30 min and then at 2, 4, 8, 24 and 48 h. Finally, rats were observed for the development of clinical or toxicological symptoms until 14 days.
2.7 Experimental design and drug administration
Thirty male rats were randomly divided into five groups containing six rats each. The treatment of each group is described below. 3 ml/kg of CCl4 was administered orally once on the first day. eRoMi was dissolved in Millipore water and two different concentrations (100 mg/kg and 200 mg/kg) of eRoMi were administered orally every day in the morning with the help of a 16G gavage needle while the control group was maintained on Millipore water. On the final day, before euthanization, groups 2, 3, 4 and 5 were administered with CCl4 [25]. Body weights were monitored throughout the experiment.
Group 1 was administered with Millipore water + dietary supplement served as solvent control (Control).
Group 2 was administered with CCl4 on the first day + dietary supplement served as disease-induced control (CCl4).
Group 3 was administered with CCl4 on the first day + 100 mg/kg BW of eRoMi orally + dietary supplement for 7 days (eRoMi 100).
Group 4 was administered with CCl4 on the first day + 200 mg/kg BW of eRoMi orally + dietary supplement for 7 days (eRoMi 200).
Group 5 was administered with CCl4 on the first day + 25 mg/kg BW of silymarin orally + dietary supplement for 7 days (Silymarin 25; Positive Control).
For silymarin group, Silybon-140 mg, Micro Lab Limited, India was used.
2.8 Preparation of liver tissue samples
On the 8th day, i.e., 24 h after the last treatment, all rats were weighed and euthanized under proper anesthesia using a combination of 0.15 ml/100 g xylazine (30 mg/kg BW) and 0.3 ml/100 g i.p ketamine (300 mg/kg BW) as proposed by Committee for the Purpose of Control and Supervision of Experiments on Animals (CPCSEA). The blood was collected by retro-orbital puncture in an EDTA-containing tube from all the experimental rats. The livers of each rat were removed, weighed and perfused in the ice-cold phosphate buffer of pH 7.0. A portion of the liver was preserved in 10% formaldehyde solution for histopathological evaluation and from the remaining portion, the homogenate was prepared by centrifuging at 1000 × g for 10 min at 4 °C. The supernatant was collected after centrifugation and was used for in-vivo enzymatic assays [8].
2.9 Measurement of serum electrolytes
The blood was allowed to clot for 60 min at RT and then serum was collected by low-speed centrifugation at 120 × g for 5 min. The straw-colored serum was used to study the biochemical parameters in Cobas Auto analyzer for serum electrolyte determination.
2.10 Biochemical assays in blood
The activities of aspartate transaminase (AST), alanine transaminase (ALT), alkaline phosphatase (ALP), gamma-glutamyl transpeptidase, total bilirubin, triglycerides (TG), HDL-cholesterol, LDL-cholesterol and total cholesterol (TC) were estimated using standard AMP diagnostic kits (Graz, Austria). Liver damage was assessed by estimating the enzymatic activities of serum AST, ALT, and ALP, as well as TC, TG, and albumin levels, using the corresponding commercial kits.
2.11 Assessment of in-vivo liver enzymatic assays
2.11.1 Superoxide dismutase (SOD) assay
The SOD activity was determined by the Misra and Fredovich [30, 31] method, modified by Middha et al., [30]. A volume of 880 µl of 0.05 M carbonate buffer (pH 10.2) containing 0.1 mmol EDTA and 20 µl of 30 mmol epinephrine in 0.05% acetic acid was added to the tissue extract of 100 µl, and changes in activity were measured at 480 nm for 4 min. The activity was expressed as the amount of enzyme that inhibits the oxidation of epinephrine by 50%, which is equivalent to one unit and is expressed in terms of units/mg protein.
2.11.2 Catalase (CAT) assay
Catalase activity was determined as described by Khan et al. [32]. The reaction solution of catalase activity contained 1 ml of 59 mmol/L H2O2 (dissolved in 50 mmol phosphate buffer, pH 7.0) and 0.1 ml of hepatic supernatant was added to 1.9 ml deionized water. Changes in the absorbance of the reaction solution at 240 nm were determined every 1 min up to 3 min (using Kinetics spectrometer). One unit of catalase activity was defined as an absorbance change of 0.01 as units/mg/min.
2.11.3 Glutathione peroxidase (GPx) assay
GPx activity was measured as described by Middha et al. [33] at 37 °C. The reaction mixture consisted of 500 μl of phosphate buffer, 100 μl of 0.01 M reduced glutathione (GSH), 100 μl of 1.5 mM NADPH and 100 μl of GR (0.24 U). 100 μl of tissue extract was added to the reaction mixture and incubated at 37 °C for 10 min. 50 μl of 12 mM t-butyl hydroperoxide were added to 450 μl of the tissue reaction mixture and measured at 340 nm for 180 s in a BioSpectrometer (Eppendorf, Model BL 192). The molar absorptivity of 6.22 × 10³ M/cm was used to determine enzyme activity. One unit of activity is equal to µM NADPH oxidized/min/mg protein.
2.11.4 Assays for measurement of reduced glutathione (GSH), oxidized glutathione (GSSG) and ratio of GSH: GSSG
The levels of GSH were estimated using the method of Salbitani et al. [34]. A total of 1 ml of homogenate was precipitated with 1 ml of 4% sulfosalicylic acid. Samples were kept at 4 °C for 1 h and then centrifuged at 1200 × g for 20 min at 4 °C. The total volume of 3 ml assay mixture contained 0.1 ml of a filtered aliquot of the liver homogenate, 2.7 ml of phosphate buffer (0.1 mol; pH 7.4) and 0.2 ml of DTNB (100 mmol). The yellow colour that developed was read immediately at 412 nm on a SmartSpec™ Plus Spectrophotometer (Bio-Rad, Hercules, CA, USA). It was expressed as μmol GSH/mg of the liver.
Oxidized glutathione (GSSG) level was measured by the protocol previously used by Griffith [35]. It was expressed as μmol GSSG/mg of the liver. GSH metabolism was generally calculated as the ratio of total GSH/GSSG.
2.12 Lipid peroxidation
Malondialdehyde (MDA), a marker of lipid peroxidation, was assessed by the method of Ohkawa et al. [37], using 1, 1, 3, 3-tetramethoxypropane as standard. Briefly, 8.1% SDS was added to the tissue homogenate and incubated for 10 min at RT, followed by boiling with 20% acetic acid and 0.6% thiobarbituric acid (TBA) for 1 h in a water bath. After cooling, butanol: pyridine solution (15:1 v/v) was added and the mixture was centrifuged at 600 × g for 5 min. The absorbance of the upper coloured layer was measured at 532 nm and the concentration of MDA was expressed in terms of nmol/mg protein.
2.13 Total protein assay
The total protein assay was done by the method of Lowry et al. [36], taking BSA as standard. In brief, to the supernatant of 100 µl, 500 µl of alkaline copper sulphate was added and allowed to incubate for 10 min at RT. After incubation, 60 µl of diluted Folin-Ciocalteu reagent (1:1) was added and incubated for another 30 min at RT. Following this, absorbance was taken at 660 nm against the reagent blank.
2.14 Histopathological studies
A small portion of the liver was excised and washed with normal saline and processed separately for histopathological observation. Initially, the liver tissues were fixed in 10% buffered neutral formalin for at least 48 h, dehydrated in gradual ethanol (50–100%), cleared in xylene, and embedded in paraffin. The 4 μm sections were prepared using a microtome. Then, the liver sections were dewaxed in xylene, rehydrated in a series of different grades of alcohol and then washed with distilled water for 5 min. The liver sections were stained with basic stain hematoxylin for 40 s and counterstained with acidic stain eosin for 20 s (H-E) dye [30]. The sections were examined microscopically (100X and 400X) using an Olympus microscope for any histopathological changes, including cell necrosis, fatty changes and vacuolation.
2.15 Statistical analysis
Data were expressed as mean ± SE. Comparison between different groups was performed using one-way ANOVA, followed by Tukey’s multiple comparison tests (GraphPad Prism, Windows 5). p < 0.05 was considered to be statistically significant.
3 Results
3.1 Total yield of the extract
The total yield of eRoMi extract isolated from the roots of M. indica was found to be 5.9% w/w.
3.2 GC–MS compound profiling
Figure 1 shows the chromatogram of the GC–MS profile of eRoMi extract run for 35 min, which indicated the presence of 1,2-bis(trimethylsilyl) benzene, 1,4-phenylenebis (trimethylsilane), 2,4,6-cycloheptatriene-1-one, 3,5-bis-trimethylsilyl, and α-amyrin at retention times (RT) of 30.609, 30.674, 31.035 and 31.745, respectively (Table 1, Fig. 1).
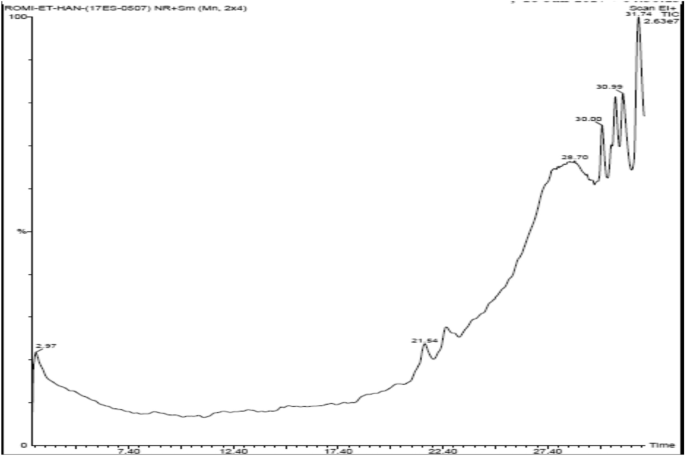
The chromatogram of the GC–MS profile of eRoMi extract run for 35 min (showing the different peaks with retention times)
3.3 Acute toxicity study
No fatality was observed following the oral administration of eRoMi to the investigational animals at 2000 mg/kg BW dose. Therefore, 1/10th (200 mg/kg) of the maximum dose and 1/20th (100 mg/kg) were considered safe for the in-vivo studies. No signs of clinical or toxicological symptoms in experimental animals were observed after 14 days.
3.4 Effect of eRoMi on hematological parameters
The effects of administration of eRoMi on the hematological parameters are shown in Table S-1. Compared with the control group, the disease-induced group that received CCl4 showed a decline in the levels of erythrocytes, hemoglobin, mean corpuscular volume (MCV), mean corpuscular hemoglobin concentration (MCHC), and monocytes, whereas the levels of leukocytes, lymphocytes and mean corpuscular hemoglobin (MCH) were noted to be increased. Results show that there were no statistically significant changes in erythrocyte count, hemoglobin, leukocytes and MCHC values of groups treated with eRoMi when compared with control and Silymarin groups. The extract caused a significant reduction in MCH and lymphocytes by 1.1 and 1.5 folds, respectively (p < 0.05). Monocytes were also found to be increased as compared with that of the control group (p < 0.05).
3.5 Effect of eRoMi on biochemical parameters
3.5.1 Effect of eRoMi on the indices of hepatotoxicity based on liver marker enzymes
Administration of CCl4 markedly increased the levels of serum hepatic enzymes such as ALT, AST and ALP in the disease-induced group as compared to the control group (Table 2). The increase in these enzyme activities was significantly decreased with the treatment of eRoMi; the high concentration group of eRoMi (200 mg/kg) showing better results than the low concentration (100 mg/kg).
3.5.2 Effect of eRoMi on TC, TG, HDL, LDL, and VLDL levels
The administration of CCl4 has increased TC (6.40 ± 0.02 mmol/L), TG (1.78 ± 0.01 mmol/L), LDL (162.00 ± 10.81 mg/dL), and VLDL (29.01 ± 0.87 mg/dL), and decreased HDL (27.11 ± 1.42 mg/dL); whereas in the groups that received silymarin and test extract eRoMi, the levels of TC, TG, LDL and VLDL have significantly decreased with increase in HDL levels (Table S-2). A high concentration of eRoMi showed better results when compared with the low concentration group. The major fold changes were seen in VLDL (0.80 fold) followed by TG (0.77 fold), TC (0.76 fold) and LDL (0.67 fold) after the treatment with the high dose of eRoMi as compared to the CCl4-treated animals. The level of HDL increased with the administration of eRoMi and showed better result at high concentration (34.20 ± 2.83 mg/dL) compared to low concentration (29.12 ± 0.39 mg/dL). These results of high-dose treatment were comparable with the standard drug silymarin, which was effective in reverting biochemical parameters in diseased animals.
3.5.3 Effect of eRoMi on serum urea and creatinine
The serum biochemical assay of the current investigation has been tabulated in Table 2. In the control group, creatinine and urea levels were noted to be 0.68 ± 0.01 mg/dL and 22.75 ± 1.05 mg/dL, respectively. CCl4 administration significantly increased the urea (34.12 ± 1.21 mg/dL) and plasma creatinine (0.79 ± 0.01 mg/dL) levels as compared to the control group. Treatment with CCl4 advanced the creatinine and urea levels by almost 1.2 and 1.5 folds. When the experimental rats were treated with the standard drug silymarin and different doses of eRoMi, it was noticed that in the case of silymarin, the creatinine and urea levels almost clocked back to the normal. Upon treatment with eRoMi, the high dose was found to be more effective in decreasing these creatinine and urea levels than the low dose, being statically significant in both cases.
3.5.4 Effect of eRoMi on total protein and albumin
As shown in Table 2, CCl4 administration decreased the albumin (to 65.6%, p < 0.05) and total protein levels as compared to the control, although the decrease in total protein was not significant. The albumin was decreased. Treatment with eRoMi at a high dose (200 mg/kg) and silymarin significantly increased the albumin to 77.3% and 75.6%, respectively, as compared to the control. There were no significant changes (p < 0.05) in the total protein levels in the treatment groups compared to the control group.
3.5.5 Effect of eRoMi on bilirubin and gamma-glutamyl transpeptidase (GGT)
The administration of CCl4 elevated the levels of serum bilirubin (313.3%) and GGT (262.0%) as compared to the control group (Table S-2). After the treatment of eRoMi, bilirubin was lessened to 251.7% (with 100 mg/kg eRoMi), 215.0% (with 200 mg/kg eRoMi) and 181.7% (with silymarin); whereas GGT was reduced to 199.0% (with 100 mg/kg eRoMi), 197.1% (with 200 mg/kg eRoMi), and silymarin (150.3%) as compared to control.
3.6 Effect of eRoMi on plasma electrolytes levels
The sodium (Na+), potassium (K+) and chloride (Cl−) levels were found to be increased by 8.3%, 16.9%, and 6.8%, respectively, in the CCl4 group animals compared to control group animals (Table 3). After treatment with the test extract eRoMi, the Na+, K+, and Cl− levels were found to be decreased when compared to CCl4-treated animals; however, the changes were not significant (p < 0.05).
3.7 Effect of eRoMi on the parameters of oxidative stress in liver
3.7.1 Effect of eRoMi on antioxidant enzymes SOD, CAT, and GPx
The administration of CCl4 resulted in a significant decrease in activities of antioxidant enzymes such as CAT, SOD and GPx in the liver as compared to the control (Fig. 2a, b and c). The activities of CAT, SOD and GPx were decreased by 26.38%, 3.72% and 62.10%, respectively. The groups treated with eRoMi at two different doses and silymarin significantly increased (p < 0.05) the activities of the enzymes as compared to the CCl4-treated group, and the protective effect of eRoMi treatment at 200 mg/kg was similar to that of silymarin treatment.

Effect of eRoMi on the levels of a Catalase, b Superoxide dismutase, c Glutathione Peroxidase and d GSH and GSSG. Values are mean ± S.E. (n = 6 animals per group). Statistical analysis was done by one-way ANOVA between groups and values were considered significant at p < 0.05. Those which are not sharing the same letters are significantly different
3.7.2 Effect of eRoMi on the activity of GSH, GSSG and GSH metabolism
The administration of CCl4 reduced the GSH level by 27.2% as compared to the control group (Fig. 2d). The GSH level was ameliorated upon treatment with eRoMi at both doses and was comparable to the effect of treatment with silymarin.
The GSH/GSSG ratio was decreased in CCl4-treated rats when compared to control rats (1.372 ± 0.2 for CCl4 versus 0.856 ± 0.1 for control; p ≤ 0.05) (Fig. 3). The alteration in GSH metabolism caused by CCl4 treatment was prevented when experimental rats were supplemented with eRoMi. eRoMi 200 (1.09 ± 0.1) was more effective than the other group except standard drug silymarin 25 (1.17 ± 0.3). Consequently, a significant decrease was noticed in the GSSG level in the eRoMi 200 group, when compared with the CCl4-treated group (Fig. 2d).

Effect of eRoMi on GSH/GSSG ratio (GSH metabolism). Values are mean ± S.E. (n = 6 animals per group). Statistical analysis was done by one-way ANOVA between groups and values were considered significant at p < 0.05. Those which are not sharing the same letters are significantly different
3.7.3 Effect of eRoMi on lipid peroxidation
Lipid peroxidation was accessed by evaluating the level of MDA and was expressed in nmol/mg of protein. Figure 4 shows the effects of eRoMi treatment on the CCl4-induced alteration of MDA level. The MDA content was significantly elevated by 69% in the CCl4-treated group compared with that of the control group (p < 0.05). However, treatment with eRoMi and silymarin significantly reduced MDA level, and eRoMi at high concentration (200 mg/kg BW) markedly relieved the CCl4-induced elevation in the lipid peroxidation (p < 0.05).

Effect of eRoMi on lipid peroxidation (the level of MDA). *Values are mean ± S.E. (n = 6 animals/group). Statistical analysis was done by one-way ANOVA between groups and values were considered significant at p < 0.05. Those which are not sharing the same letters are significantly different
3.7.4 Effect of eRoMi on histopathological changes
Histopathological evaluation of the rat livers (Table S3; Fig. 5) showed that the hepatocytes of a healthy rat (from the control group) had a normal architecture (Fig. 5a), whereas, in contrast, CCl4 induced severe hepatocyte necrosis, inflammation, and hemorrhage (Fig. 5b). After treatment with eRoMi, the severity of CCl4-induced liver intoxication was reduced in a dose-dependent manner (Fig. 5c and 5d), although the treatment with silymarin showed better result (Fig. 5e).

Histopathologic section of liver (400 X) with hematoxylin and eosin staining the cell nucleus and cytoplasm with extracellular matrix with purple blue and pink colours, respectively: a Showing normal arrangement of hepatocytes in the liver lobule. b Showing hepatocyte necrosis, inflammation, biliary cirrhosis, microvesicular steatosis, broad infiltration of Kupffer cells around the central vein and vacuolation in CCl4 treated wistar rats. c Animal treated with CCl4 and 100 mg/kg RoMi showing mild sinusoidal dialatation in centrizonal area, necrosis recovery around the central vein and hepatocytes showing regenerative activity. d Animal treated with CCl4 and 200 mg/kg RoMi showing no centrilobular necrosis, hepatocytes with normal texture around the central vein and proper sinusoid texture. e CCl4 and silymarin (25 mg/kg) treated animals showing normal hepatocytes and proper central vein. (NB: CV: Central vein, BC: Biliary cirrhosis, V: vacuolation, II: Inflammatory infiltration, MS: Microvesicular steatosis, MN: Mild necrosis and RH: Regenerating hepatocyte)
4 Discussion
CCl4 is a classic compound commonly used for xenobiotic-induced hepatic injury of the liver to understand the pathogenesis of hepatic steatosis in the experimental animal models [39, 11]. The liver injury is due to the reactive oxygen species (ROS)-induced oxidative stress that can generate toxic lipid intermediates. Weber et al. [40] understood in their study that CCl4 ingestion activates cytochrome system (i.e., CYP2E1) and forms trichloromethyl radicals (CCl3+). It becomes toxic because of a reactive intermediate generated by its reductive metabolism, and this highly reactive intermediate is known to induce leakage of serum enzymes, lipid peroxidation, depletion of antioxidant capacity and hepatic necrosis around the central vein [25].
Prior studies have reported that herbal and medicinal plants substantially contribute to the treatment of cholestatic disorder or hepatocellular insult and liver injury [41]. In the present study, we show that the ethanolic root extracts of M. indica can significantly prevent CCl4-induced acute liver damage. Among all the detected compounds in eRoMi by GC–MS analysis, α-amyrin is known to be three times more potent in its anti-inflammatory effect than aspirin [38]. 1,2-Bis (trimethylsilyl) benzene, 1,4-phenylenebis (trimethylsilane), 2,4,6-cycloheptatriene-1-one, and 3,5-bis-trimethylsilyl were other novel compounds that were detected for the first time in eRoMi. Serum marker enzymes, such as AST, ALT, ALP, and GGT are recognized as liver marker enzymes that exhibit increased activities when the liver cells are necrotic, during cholestatic disorder or hepatocellular insult [42]. Wills and Asha [43] signified in their study that after liver injures, AST and ALT progresses from the cytoplasm to the circulatory system because of the toxicity mediated transformed permeability of the cellular membrane. Additionally, there are other important indices to evaluate the hepatic function, such as TC, TG, HDL, LDL, VHDL, total protein and albumin levels in serum. Our in-vivo study demonstrated that the CCl4-induced control group had a significant increase in the activities of liver indices suggesting acute cellular damage. Many authors have also reported that the activities of serum enzymes and other indices were significantly elevated after inducing CCl4 in animals [44], 45, 46]. On the other hand, daily administration of eRoMi to CCl4-induced hepatotoxic rats attenuated the increased activity of liver marker enzymes and alleviated the loss of functional integrity of the cell membrane, indicating its hepatoprotective activity. eRoMi at 200 mg/kg dose was able to reduce the levels of these serum enzymes comparable to the standard drug silymarin, which showed a better index, though not significant. Our results are in agreement with the findings from previous studies where the hepatoprotective activities of the leaf extracts of Morus indica and Morus alba L. against CCl4 treatment were reported to decrease the serum levels of AST and ALT in rat and mice models, respectively [25, 26].
Further, the hematological parameters were assessed to check the acute effects of the test extract. Hematological parameters are significant in establishing the body's functional status as a result of exposure to drugs [47]. Treatment of eRoMi caused no significant changes in the levels of major hematological indices such as erythrocyte count, hemoglobin, leukocytes, and MCHC. However, a reduction in MCH was observed, suggesting the possibility of anemia. The lymphocytes and monocytes count were also reduced in the eRoMi-treated groups as compared to the normal group. Although eRoMi had no major significant effect on most of the hematological parameters in rats, it could be concluded that the use of this extract should be with some cautious measures to avoid anemia and other immunological dysfunctions. Specific hematological and immunotoxicological studies are thus warranted in the future to fully understand the effect of eRoMi on all the immune cell types.
Electrolytes are generally described as the ionized or ionizable minerals of a living cell, blood, or other organic matter. Sodium (Na+), potassium (K+), and chloride (Cl−) are important blood electrolytes. These electrolytes carry electric charges in liquid media like blood. They participate in several functions that help in regulating nerve and muscle functions and maintain acid–base balance and water balance [48]. Imbalance in these electrolytes can cause electrolyte abnormalities. A study conducted by Salihu et al. [49] observed that CCl4 causes an imbalance in the major blood electrolytes. The present study shows that CCl4 increases the levels of electrolytes. Upon treatment with eRoMi, a decrease in these levels was observed; however, were not significant, suggesting that there were no electrolyte abnormalities. Blood urea and creatinine are important parameters indicating the health of both the liver and the kidneys. Blood urea is a waste product of protein metabolism, synthesized in the liver and excreted by the kidney [48]. Creatinine is a by-product of muscle metabolism excreted unchanged by the kidneys, making it an important indicator of renal health. The results of the present study showed that the level of blood urea increased in CCl4-intoxicated rats indicating renal damage. Upon treatment with eRoMi, the blood urea level decreased and there was no significant change in creatinine.
Furthermore, the histopathological examination of the liver provided evidence of the effects of investigated components against acute CCl4-induced liver injury, which also substantiated the biochemical analysis. The histology showed that CCl4 administration caused serious oxidative liver damage characterized by severe necrosis, inflammation, hepatocellular degeneration, cytoplasmic vacuolation and loss of cellular boundaries, which are in conformity with the previous studies for the liver injury [40, 50, 51]. Treatment with eRoMi was noteworthy in a dose-dependent manner as it reduced the severity caused due to oxidative damage. This was evidenced by a decrease in necrosis and hemorrhage (Fig. 5). Hence, it indicates the protection provided by the administration of eRoMi. The high dose of eRoMi induced an effect close to normal emergence, recommending that the high dose of 200 mg/kg was more effective than the low dose (100 mg/kg). This was in concordance with the results of serum biochemical markers analysis. The antioxidant enzymes, such as CAT, SOD and GPx are the endogenous enzymes that form an imperative part of the antioxidant defense system. They detoxify the free radicals and thus protect the hepatic cells against oxidant-mediated injury. Treatment with CCl4 alone can deplete the activity of these enzymes. It also depletes the hepatic GSH system, a key component of the overall antioxidant defense system and can also cause lipid peroxidation resulting in liver cirrhosis [32, 52]. The decline in the levels of the antioxidant enzyme activities (CAT, SOD and GPx) and GSH level observed in CCl4-treated rats is a clear indicator of excessive formation of hepatic lipid peroxidation in comparison to the normal group. This fact has also been reported in previous studies [32, 50, 53]. On the contrary, the groups treated with eRoMi at two different doses significantly increased CAT, SOD and GPx activities, increased GSH contents and reduced the MDA content (or the lipid peroxidation level) in the liver. A decrease in ROS production seen in the liver could be the result of counter enzymes production such as SOD, GPx, and GSH in eRoMi-supplemented groups. In addition, a decrease in LPx in biological membranes was reported to be directly linked with increased GPx activity [54]. Therefore, the commencement of cellular antioxidant defense could be one of the foremost mechanisms for the disease-preventing outcome of eRoMi. The preventive effect of eRoMi at 200 mg/kg was similar to that of silymarin treatment. The overall scheme of possible hepatoprotective effects by eRoMi was presented in Fig. 6. Schematic representation indicates the role of CCl4 in the induction of hepatotoxicity and the possible protective role of eRoMi in reducing the hepatotoxicity. Thus, in conclusion, the present study provides scientific evidence in favor of the pharmacological use of the roots of M. indica as an effective alternative in the treatment of liver disorders.

Schematic representation showing the role of CCl4 in the induction of hepatotoxicity and the possible role of the ethanolic extract of the roots of Morus indica L. (eRoMi) showing the hepatoprotective activity
References
Ishibashi H, Nakamura M, Komori A, Migita K, Shimoda S (2009) Liver architecture cell function and disease. Seminars Immunopathol 31:399–409
Cicek T, Gokturk HS, Unler GK (2015) Acute hepatocellular drug induced liver injury probably by alfuzosin. Case Rep Urol. Artcile ID: 101062
Chaudhury A, Duvoor C, Dendi R, Sena V, Kraleti S, Chada A, Ravilla R, Marco A, Shekhawat NS, Montales MT, Kuriakose K (2017) Clinical review of antidiabetic drugs: implications for type 2 diabetes mellitus management. Front Endrocrinol 8:6
Giacometti J, Muhvić D, Pavletić A, Ðudarić L (2016) Cocoa polyphenols exhibit antioxidant anti-inflammatory anticancerogenic and anti-necrotic activity in carbon tetrachloride-intoxicated mice. J Funct Food 23:177–187
Kamala A, Middha SK, Karigar CS (2018) Plants in traditional medicine with special reference to Cyperus rotundus L.: a review. 3 Biotech 8:309
Madrigal-Santillán E, Madrigal-Bujaidar E, Álvarez-González I, Sumaya-Martínez MT, Gutiérrez-Salinas J, Bautista M, Morales-González ÁY, González-Rubio MGL, Aguilar-Faisal JL, Morales-González JA (2014) Review of natural products with hepatoprotective effects. World J. Gastroentero: WJG 20(40):14787
Quan M, Li Q, Zhao P, Tian C (2018) Chemical composition and hepatoprotective effect of free phenolic extract from barley during malting process. Sci Rep 8(1):1–9
Dey SK, Middha SK, Usha T, Brahma BK, Goyal AK (2018) Antidiabetic activity of giant grass Bambusa tulda. Bangladesh J Pharmacol 13(2):134–135
Goyal AK, Middha SK, Usha T (2020) Baccaurea ramiflora Lour.: a comprehensive review from traditional usage to pharmacological evidence. Adv Tradit Med. Doi: 10.1007%2Fs13596-020-00489-9
Goyal AK, Middha SK, Usha T, Sen A (2017) Analysis of toxic antidiabetic and antioxidant potential of Bambusa balcooa Roxb leaf extracts in alloxan-induced diabetic rats. 3 Biotech 7(2):120
Ma T, Sun X, Tian C, Zheng Y, Zheng C, Zhan J (2015) Chemical composition and hepatoprotective effects of polyphenols extracted from the stems and leaves of Sphallerocarpus gracilis. J Funct Food 8:673–683
Middha SK, Usha T, Basistha BC, Goyal AK (2019) Amelioration of antioxidant potential, toxicity, and antihyperglycemic activity of Hippophae salicifolia D. Don leaf extracts in alloxan-induced diabetic rats. 3 Biotech 9:308
Scalbert A, Manach C, Morand C, Rémésy C, Jiménez L (2005) Dietary polyphenols and the prevention of diseases. Crit Rev Food Sci 45(4):287–306
Usha T, Pradhan S, Goyal AK, Dhivya S, Kumar HP, Singh MK, Joshi N, Basistha BC, Murthy KS, Selvaraj S, Middha SK (2017) Molecular simulation-based combinatorial modeling and antioxidant activities of zingiberaceae family rhizomes. Phcog Mag 13(Suppl 3):S715
da Silva Almeida JRG, Souza GR, da Cruz Araújo EC, Silva FS, de Lima JT, de Araújo Ribeiro LA, Nunes XP, Barbosa Filho JM, Júnior LJQ, dos Santos MRV (2012) Medicinal plants and natural compounds from the genus Morus (Moraceae) with hypoglycemic activity: a review. Glucose Tolerance 189–206. IntechOpen
Usha T, Middha SK, Bhattacharya M, Lokesh P, Goyal AK (2014) Rosmarinic Acid a New Polyphenol from Baccaurea ramiflora Lour Leaf: A Probable Compound for Its Anti-Inflammatory Activity. Antioxidants 3(4):830–842
Chopra RN, Chopra IC, Handa KL, Kapur LD (1958) Chopra's indigenous drugs of India, Second Ed., Calcutta UN Dhar and Sons Pvt Ltd
Konno C, Oshima Y, Hikino H (1977) Morusinol isoprenoid flavone from Morus root barks. Planta Med 32(06):118–124
Chatterjee GK, Burman TK, Nagchaudhuri AK, Pal SP (1983) Antiinflammatory and antipyretic activities of Morus indica. Planta Med 48(06):116–119
Wei H, Zhu JJ, Liu XQ, Feng WH, Wang ZM, Yan LH (2016) Review of bioactive compounds from root barks of Morus plants (Sang-Bai-Pi) and their pharmacological effects. Cogent Chem. 2(1): Article ID 1212320
Andallu B, Varadacharyulu N (2003) Antioxidant role of mulberry (Morus indica L cv Anantha) leaves in streptozotocin-diabetic rats. Clin Chim Acta 338(1–2):3–10
Natić MM, Dabić DČ, Papetti A, Akšić MMF, Ognjanov V, Ljubojević M, Tešić ŽL (2015) Analysis and characterisation of phytochemicals in mulberry (Morus alba L.) fruits grown in Vojvodina North Serbia. Food Chem 171:128–136
Asano N, Yamashita T, Yasuda K, Ikeda K, Kizu H, Kameda Y, Kato A, Nash RJ, Lee HS, Ryu KS (2001) Polyhydroxylated alkaloids isolated from mulberry trees (Morus alba L ) and silkworms (Bombyx mori L ). J Agric Food Chem 49(9):4208–4213
Singh R, Bagachi A, Semwal A, Kaur S, Bharadwaj A (2013) Traditional uses phytochemistry and pharmacology of Morus alba Linn: a review. J Med Plant Res 7(9):461–469
Kalantari H, Aghel N, Bayati M (2009) Hepatoprotective effect of Morus alba L in carbon tetrachloride-induced hepatotoxicity in mice. Saudi Pharma J 17(1):90–94
Reddy VP, Urooj A (2017) Evaluation of hepatoprotective activity of Morus indica Linn against toxicity induced by carbon tetrachloride in rats. Int J Pharma Sci Res 8(2):845
Tag HM (2015) Hepatoprotective effect of mulberry (Morus nigra) leaves extract against methotrexate induced hepatotoxicity in male albino rat. BMC Complement Altern Med 25(15):252
Jin YS, Lee MJ, Han W, Heo SI, Sohn SI, Wang MH (2006) Antioxidant effects and hepatoprotective activity of 2 5-dihydroxy-4 3′-di (β-d-glucopyranosyloxy)-trans-stilbene from Morus bombycis Koidzumi roots on CCl4-induced liver damage. Free Rad Res 40:986–992
Abdel-Aal ESM, Choo TM, Dhillon S, Rabalski I (2012) Free and bound phenolic acids and total phenolics in black blue and yellow barley and their contribution to free radical scavenging capacity. Cereal Chem 89(4):198–204
Middha SK, Usha T, Babu D, Misra AK, Lokesh P, Goyal AK (2016) Evaluation of antioxidative analgesic and anti-inflammatory activities of methanolic extract of Myrica nagi leaves-an animal model approach. Symbiosis 70(1–3):179–184
Misra HP, Fridovich I (1972) The role of superoxide anion in the autoxidation of epinephrine and a simple assay for superoxide dismutase. J Biol Chem 247(10):3170-3175
Khan RA, Khan MR, Ahmed M, Sahreen S, Shah NA, Shah MS, Bokhari J, Rashid U, Ahmad B, Jan S (2012) Hepatoprotection with a chloroform extract of Launaea procumbens against CCl 4-induced injuries in rats. BMC Comp Alt Med 12(1):114
Middha SK, Bhattacharjee B, Saini D, Baliga MS, Nagaveni MB, Usha T (2011) Protective role of Trigonella foenum graceum extract against oxidative stress in hyperglycemic rats. Eur Rev Med Pharmacol Sci 15(4):427–435
Salbitani G, Bottone C, Carfagna S (2017) Determination of reduced and total glutathione content in extremophilic microalga Galdieria phlegrea. Bio-Protocol 7:e2372
Griffith OW (1980) Determination of glutathione and glutathione disulfide using glutathione reductase and 2-vinylpyridine. Anal Biochem 106(1):207–212
Lowry OH, Rosebrough NJ, Farr AL, Randall RJ (1951) Protein measurement with the Folin phenol reagent. J Biol Chem 193:265–275
Ohkawa H, Ohisi N, Yagi K (1979) Assay of Lipid peroxidation in animals and tissues by thiobarbituric acid test. Anal Biochem 95:351–358
Raman BV, Samuel LA, Saradhi MP, Rao BN, Krishna NV, Sudhakar M, Radhakrishnan TM (2012) Antibacterial antioxidant activity and GC-MS analysis of Eupatorium odoratum. Asian J Pharma Clinic Res 5(2):99–106
Chen J, Sun H, Sun A, Hualin Q, Wang Y, Tao X (2012) Studies of the protective effect and antioxidant mechanism of blueberry anthocyanins in a CC14-induced liver injury model in mice. Food Agric Immunol 23(4):352–362
Weber LW, Boll M, Stampfl A (2003) Hepatotoxicity and mechanism of action of haloalkanes: carbon tetrachloride as a toxicological model. Crit Rev Toxicol 33(2):105–136
Balaban YH, Aka C, Koca-Caliskan U (2017) Liver immunology and herbal treatment. World J Hepatol 9(17):757–770
Agganis B, Lee D, Sepe T (2018) Liver enzymes: no trivial elevations even if asymptomatic. Clevel Clin J Med 85(8):612–617
Wills PJ, Asha VV (2006) Protective effect of Lygodium flexuosum (L.) Sw. extract against carbon tetrachloride-induced acute liver injury in rats. J Ethnopharmacol 108(3):320–326
Karakus E, Karadeniz A, Simsek N, Can I, Kara A, Yildirim S, Kalkan Y, Kisa F (2011) Protective effect of Panax ginseng against serum biochemical changes and apoptosis in liver of rats treated with carbon tetrachloride (CCl4). J Hazard Matter 195:208–213
Srivastava A, Shivanandappa T (2006) Hepatoprotective effect of the aqueous extract of the roots of Decalepis hamiltonii against ethanol-induced oxidative stress in rats. Hepatol Res 35(4):267–275
Tang XH, Gao J, Chen J, Xu LZ, Tang YH, Zhao XN, Michael L (2008) Mitochondrial modulation is involved in the hepatoprotection of Limonium sinense extract against liver damage in mice. J Ethnopharmacol 20(3):427–431
Ladokun O, Ojezele M, Arojojoye O (2015) Comparative study on the effects of aqueous extracts of viscum album (mistletoe) from three host plants on hematological parameters in albino rats. Afr Health Sci 15(2):606–612
Bakour M, Soulo N, Hammas N, Fatemi HE, Aboulghazi A, Taroq A, Abdellaoui A, Al-Waili N, Lyoussi B (2018) The antioxidant content and protective effect of argan oil and Syzygium aromaticum essential oil in hydrogen peroxide-induced biochemical and histological changes. Int J Mol Sci 19(2):610
Salihu M, Akpabio CJ, Oloyede OB, Mohammed NO (2013) Effect of determined mineral elements in mesocarp of Balanites Aegyptiaca fruit on serum electrolytes of CCl4 treated Rats. IOSR J Pharm Biol Sci 7:86–90
Maheshwari DT, Kumar MY, Verma SK, Singh VK, Singh SN (2011) Antioxidant and hepatoprotective activities of phenolic rich fraction of Seabuckthorn (Hippophae rhamnoides L.) leaves. Food Chem Toxicol 49(9):2422–2428
Vuda M, D’Souza R, Upadhya S, Kumar V, Rao N, Kumar V, Boillat C, Mungli P (2012) Hepatoprotective and antioxidant activity of aqueous extract of Hybanthus enneaspermus against CCl4-induced liver injury in rats. Exp Toxicol Pathol 64(7–8):855–859
Lin HM, Tseng HC, Wang CJ, Lin JJ, Lo CW, Chou FP (2008) Hepatoprotective effects of Solanum nigrum Linn extract against CCl4-iduced oxidative damage in rats. Chem Biol Interact 171(3):283–293
Tung YT, Wu JH, Huang CC, Peng HC, Chen YL, Yang SC, Chang ST (2009) Protective effect of Acacia confusa bark extract and its active compound gallic acid against carbon tetrachloride-induced chronic liver injury in rats. Food Chem Toxicol 47(6):1385–1392
Upreti K, Misro MM (2002) Evaluation of oxidative stress and enzymatic antioxidant activity in brain during pregnancy and lactation in rats. Health Popul Perspect Issues 25(3):105–112
Acknowledgements
HB is obliged to DST for providing Rajiv Gandhi Fellowship, Govt of India. SKM is grateful to the DST-FIST facility (F.No. SR/FST/ 404/2018) under the Government of India, Biotechnology Skill Enhancement Program (BiSEP) under Government of Karnataka and management, Maharani Lakshmi Ammanni College for Women (mLAC), for providing animal facilities.
Author information
Authors and Affiliations
Contributions
HB, PC, and TU contributed to performing the laboratory work and partially wrote the manuscript. TU, HE contributed to the estimation of the chemical composition. HSY, AKG, DB contributed to analysing the data, drafting and language editing of the manuscript. SKM and SD conceived the idea, supervised the laboratory work and contributed to the critical reading of the manuscript. All the authors have read and approved the manuscript for its final submission.
Corresponding author
Ethics declarations
Conflict of interest
The authors declare no conflict of interest.
Ethical statement
All the experiments were performed in strict accordance with standard guidelines accepted internationally, and the ethical approval was obtained from Maharani Lakshmi Ammanni College Ethical Committee (1368/ac/10/CPCSEA), Bangalore, for the care and use of laboratory animals.
Additional information
Publisher's Note
Springer Nature remains neutral with regard to jurisdictional claims in published maps and institutional affiliations.
Supplementary Information
Below is the link to the electronic supplementary material.
Rights and permissions
Open Access This article is licensed under a Creative Commons Attribution 4.0 International License, which permits use, sharing, adaptation, distribution and reproduction in any medium or format, as long as you give appropriate credit to the original author(s) and the source, provide a link to the Creative Commons licence, and indicate if changes were made. The images or other third party material in this article are included in the article's Creative Commons licence, unless indicated otherwise in a credit line to the material. If material is not included in the article's Creative Commons licence and your intended use is not permitted by statutory regulation or exceeds the permitted use, you will need to obtain permission directly from the copyright holder. To view a copy of this licence, visit http://creativecommons.org/licenses/by/4.0/.
About this article

Cite this article
Boro, H., Usha, T., Babu, D. et al. Hepatoprotective activity of the ethanolic extract of Morus indica roots from Indian Bodo tribes. SN Appl. Sci. 4, 49 (2022). https://doi.org/10.1007/s42452-021-04859-z
Received:
Accepted:
Published:
DOI: https://doi.org/10.1007/s42452-021-04859-z