
Abstract
This work aims at describing the behavior of high-strength reinforced concrete (HSRC) beams under short-term ultimate loads with concrete compressive strengths higher than 50 MPa. A plastic approach besides a cross sectional analysis is employed to primarily trace the nonlinear response of nineteen HSRC simply supported beams for which experimental results are available. This proposed theoretical approach is able to acceptably match the experimental data with minor overestimation of flexural moments. Closed-form expressions to evaluate ductility indexes regarding deflections and curvatures as well as plastic rotation capacities are also proposed herein. Predictions of the National Brazilian Regulation for design of concrete structures NBR6118 in terms of ultimate flexural moments are also computed for comparison. A complete assessment of ductility in which plastic rotation capacities are computed for the studied beams is also given. It is found that the flexural ductility of a member could be increased with the use of high strength concrete. The use of a maximum tension steel ratio to guarantee a minimum flexural of ductility is highlighted.
1 Introduction
Design code provisions of reinforced concrete (RC) structures are permanently revised to better exploit material properties and provide ductile designs. High strength concrete (HSC) is used worldwide, primarily due to the gain in strength, stiffness and durability properties, which may lead to an economy in the use of reinforcing bars and size of concrete cross sections in multi-storey buildings. Although concrete ductility can be partially diminished as concrete strength increases, the combined RC member can still possess a good level of ductility when a correct amount of reinforcement is considered. With this in regard, the National Brazilian Regulation NBR6118 (2014) [1] incorporates design requirements for HSRC members with concrete compressive strengths between 50 and 90 MPa, in which an equivalent rectangular stress block for concrete in compression is adopted for flexural design. Indeed, the rectangular stress block is employed in several design codes for which different values of stress factors and ultimate compressive strains are commonly proposed [2].
Furthermore, ductility of RC members, which can be expressed in terms of plastic rotation capacities of cross sections, maximum steel ratios or neutral axis depths, is another issue to be treated here. The technical literature is abundant in this aspect. For instance, in [3] a crack-based assessment damage method is proposed to study the behavior of HSRC beams critical in shear. Therein, hysteretic rules are included in the model besides an experimental campaign. In [4], a two-dimensional lattice model is formulated for HSC, in which cyclic analyses are performed in columns to prove adequacy of the proposed model in relation to experimental data. In [5] an experimental investigation is accomplished to assess the strain rate effect on HSC under dynamic loading, in which a noticeably rate dependency is remarked. In [6] an experimental program is carried out to test the performance of HSRC beams under quasi-static and blast loads. The main conclusion of the study is that the concrete strength does not significantly affect the specimen behavior under blast loads. In [7] is presented a learning machine to predict compressive strength of HSC, which is certainly a crucial parameter to project economy. Compression test on cylindrical specimens are conducted for HSC in [8], where an ultimate strain of 0.003 as specified by the ACI Committee 318 [9] is considered to be conservative. Indeed, experimental data supports compressive strains around 0.003 at peak stress for concrete strengths ranging from 50 to 91.4 MPa. A stress–strain curve for HSC in compression is proposed in [10] based upon a fitting procedure of relevant experimental data from existing sources. The reported minimum and maximum peak strain for normal and high-strength concrete specimens vary from 0.00228 to 0.000337 for concrete strengths between 24.27 and 84 MPa, respectively. Therefore, these studies suggest that a value greater than 0.003 should be used for the ultimate compressive strain of concrete.
In [11], parametric studies beside a regression analysis are performed to propose expressions to predict flexural ductility factors based on ultimate and yielding curvatures for HSRC beams and columns. The proposed expressions are mainly based on steel ratios and material strengths. Bernardo and Lopes [12] carried out an experimental program to study simply supported beams with different tension steel ratios for concrete compressive strengths ranging from 62.9 to 105.2 MPa. In their study, it is concluded that the evolution of neutral axis depth at all load levels is similar to that reported for beams made of normal strengths. In [13] an assessment of HSC beams with varying tension steel ratios is reported, experimental flexural ductility regarding curvature and deflections are compared with those obtained from design codes such as ACI Committee 318 [9], Canadian Standard Association CSA A23.3–04 [14] and New Zealand Concrete Standard NZS 3101 [15] for which more conservative results are obtained. In [16], the India Standard code of practice for plain and reinforced concrete structures is evaluated for nine experimental beams made of HSC, also with the intention of evaluating stress block parameters.
Undoubtedly the aforementioned issues are intrinsically related to moment redistribution in indeterminate structures for which plastic rotation capacities and ductility at critical sections are crucial. Interesting studies about this topic can be found in [17, 18] and [19], among others. Other studies about lightweight-aggregate concrete beams for HSC with compressive strengths between 22 and 63 MPa have also been presented in [20] and [21]. As it may be inferred, the current topic is of interest for the scientific community and practitioners. Although extensive efforts have been made in the research for HSRC, further studies are still needed to verify existing expressions from design codes and proposing new ones. Albeit complex numerical finite element models may be used to trace the nonlinear response of HSRC beams [22], a simple approach is presented herein.
In this context, the aim of this work is to give an accurate prediction and ductility assessment of Bernardo and Lopes HSRC beams [12] for which detailed comprehension is not given. This group of beams constitutes an important dataset since nineteen members with a wide range of concrete strengths are tested. Previous studies have solely advocated to the prediction of ultimate resistant moments according to various design codes [23], while in the current study a complete picture of the problem is given. Another important issue resides in the fact that commonly experimental setups for HSRC beams used in laboratory, consists in testing simply supported beams subjected to two symmetrically points loads. This experimental scheme may be encountered for instance in the HSRC beams tested by Pam et al. [24], Sarkar et al. [25], Bernardo and Lopes [12], Mohammadhassani [13], Rashid and Mansur [26], Ashour [27], Li and Aoude [28], among others. Therefore, closed-form expressions to evaluate ductility indexes in this situation are proposed in this paper. Additionally, some expressions available from literature for estimating ductility factors regarding curvatures are revised with the current experimental data and approach. Furthermore, provisions given by the Brazilian Regulation NBR6118 [1] are verified to assess ultimate resistant flexural moments, stress block parameters and plastic rotation capacities.
The paper is organized as follows. The numerical approach for computation of load–displacement curves for HSRC beams based on truly concrete and steel constitutive laws are presented in Sect. 2. A namely simplified procedure used to provide closed-form expressions for ductility assessment are also proposed in this section. Finally in Sect. 3, the aforementioned procedures are applied to the study of two groups of HSRC beams for which experimental results are available.
2 Numerical approach
In what follows a numerical procedure to compute the ultimate responses for HSRC beams is presented.
2.1 Concrete and steel
Stress–strain constitutive relationship for concrete in compression is expressed by means of Eq. (1), which is obtained based on a parabolic curve defined by three points, the origin point, the point at which the peak stress \({\sigma }_{cp}\) is firstly attained with its corresponding peak strain \({\varepsilon }_{cp}\) (e.g. 0.003) and the crushing point at the ultimate strain \({\varepsilon }_{cu}\) (e.g. 0.0035) as shown in Fig. 1a. The NBR6118 establishes variable values for \({\varepsilon }_{cu}\) between 0.003 to 0.0026 for concrete grades from 50 to 90 MPa, respectively [1]. Meanwhile, other codes such as NZS 3101 [15], ACI Committee 318 [9] and CSA A23.3–04 [14] define constant values of 0.003 and 0.0035, respectively, for this parameter. According to [8] the ultimate strain of 0.003 for HSC is conservative and should be used as the peak strain instead. Indeed, Bernardo and Lopes in their theoretical computations used \({\varepsilon }_{cu}\) = 0.0035 [12].

Stress–strain relationships: a concrete in compression; b concrete in tension
Contribution of concrete in tension is introduced by means of a bilinear strain–stress relationship as depicted in Fig. 1b, following the approach of Bazant and Oh [29] and stated by Eq. (2).
where \({E}_{t}\) and \({E}_{c}\) are given in MPa,
in which \({\varepsilon }_{t}\) is the current tensile strain, \({\sigma }_{t}\) is the current tensile stress, \({\sigma }_{tp}\) is the peak tensile stress, \({E}_{c}\) is the elastic modulus in the first branch and \({E}_{t}\) is the tangent modulus of the descending branch. Otherwise, the stress–strain relationship for reinforcing bars is defined by means of a bilinear curve with an elastic perfect plastic behavior with a yielding stress \({\sigma }_{y}\) and elastic modulus \({E}_{s}\). Here, an average value of \({\sigma }_{y}=\) 500 MPa is adopted for all computations unless stated otherwise. In Fig. 2a is displayed the equilibrium of internal forces in a typical RC cross section employed in the proposed theoretical approach for which tensile and parabolic compression stresses are considered. This approach is general and can be used to trace the complete nonlinear behavior of the cross-section by prescribing incremental curvatures or compressive strains. In Fig. 2b is depicted the current approach used in the NBR at failure state, where \({\alpha }_{c}\) and \(\lambda \) are the stress and depth factors associated to the stress block, respectively. Finally, in Fig. 2c is shown the corresponding stress distributions at various load levels used in this study for the named simplified approach to provide closed-form solutions for the evaluation of ductility indexes, as it will be shown later in Sect. 2.3. The idea behind this approach is to avoid the elaborated computations from Fig. 2a. As it may be observed, the triangular and trapezoidal stress diagrams represent the cases in which concrete in compression is elastic and when this enters to the plastic regime, respectively, based on the procedure presented in [30]. The ultimate stress distribution at nominal failure is then included in the procedure by adopting the rectangular stress block from Fig. 2b.
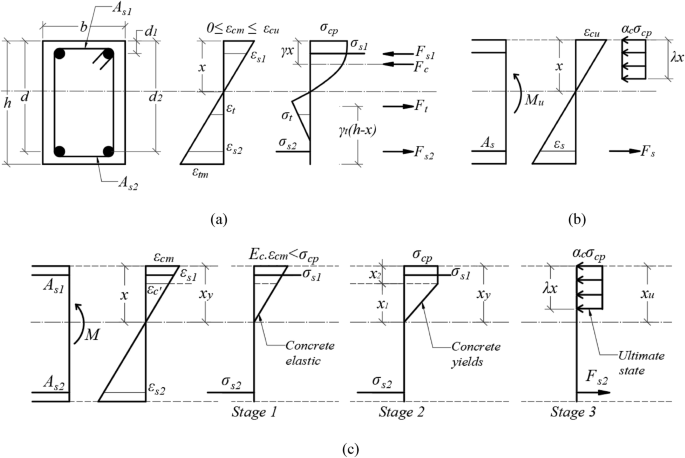
Cross-sectional equilibrium: a numerical approach; b NBR equivalent stress block; c plastic model
2.2 Load–displacement curves
In the sequel the numerical procedure of the theoretical approach, used to trace the load–displacement curves for HSRC beams, is presented. The method is based upon the construction of moment–curvature diagrams at the section level coupled to the principle of virtual work to compute deflections. Comparing to conventional methods, contribution of concrete in tension is considered in this approach. The procedure is described as follows:
For a given cross section as depicted in Fig. 2a, equilibrium of internal forces and strain compatibility at all fibers is established. Current strain, \({\varepsilon }_{cm}\), at the most compressive fiber is prescribed to an increasing value from zero to \({\varepsilon }_{cu}\) = 0.0035. From that value, strains at other fibers, e.g. tensile strain \({\varepsilon }_{tm}\) and steel strain \({\varepsilon }_{si}\) at the i-th steel layer, are computed in the following manner:
and,
where \(h\) is the height of the beam, \(d\) is the effective depth, \({d}_{i}\) is the position of the i-th steel layer measured from the top fiber and \(x\) is the current neutral axis depth. Two additional parameter, namely \({\alpha }_{t}\) and \(\alpha \) as expressed in Eqs. (7) and (8) respectively, are then introduced to compute the internal resistant forces due to concrete in tension and compression. The resulting normal force, which is null in the present case, can be expressed by means of Eq. (9).
in which \(b\) is the beam width, \({A}_{si}\) is the steel area of the i-th layer and \({\sigma }_{si}\) is the associated steel stress. To calculate the resistant flexural moment, two additionally parameters, namely \({\gamma }_{t}\) and \(\gamma \) as stated in Eqs. (10) and (11), respectively, are used to locate concrete resistant forces as sketched in Fig. 2a. With these parameters, the bending moment at each cross section can be determined with the aim of Eq. (12). In this manner, for each prescribed value of \({\varepsilon }_{cm}\) or curvature \(\psi ={\varepsilon }_{cm}/x\), a corresponding resistant moment is computed, and thus a moment–curvature diagram can be traced.
Based on computed curvatures and moments, the deflection at a given location can be evaluated using the principle of virtual work in the following manner.
in which \(L\) is the beam length, \(\psi \) is the curvature due to applied external load, \(\stackrel{-}{M}\) is the bending moment due to a unit force applied at the section in which the deflection is to be known. For the particular case of a simply supported beam submitted to two equal point loads as depicted in Fig. 3a, this expression is particularized to compute the mid-span deflection using Simpson integration rule with eight cross sections, i.e. \({\psi }_{1}\) to \({\psi }_{8}\). The corresponding curvatures are obtained from the moment–curvature diagram shown in Fig. 3b, which is built following Eqs. (5)–(12). The resulting expression is given in Eq. (14) and will be employed for computing the mid-span deflection of Bernardo and Lopes beams [12]. As already mentioned, this beam setup is commonly used in most laboratories to test flexural beams up to failure load. Hence, this theoretical procedure is programmed to automatize computations.

Simply supported beam: a integration scheme along beam axis; b Moment- curvature diagram
2.3 Closed-form expression for ductility assessment
In this section, simple formulas are presented to evaluate ductility indexes regarding deflections and curvatures for the arrangement depicted in Fig. 3. The reasoning behind this idea is based upon the stress distributions displayed in Fig. 2c, in which concrete stresses pass from elastic to an elastic plastic stage until finally achieved its ultimate nominal failure. As it is known, the degree of ductility of a section can be measured by means of its rotation capacity at failure, which can be related to ductility indexes regarding deflections or curvatures. The former is defined as the ratio of the ultimate deflection \({\delta }_{u}\) to the yielding deflection \({\delta }_{y}\) as \({\mu }_{\delta }={\delta }_{u}/{\delta }_{y}\), while the latter is defined as the ratio of the ultimate curvature \({\psi }_{u}\) to the yielding curvature \({\psi }_{y}\) as \({\mu }_{\psi }={\psi }_{u}/{\psi }_{y}\). Here, the yielding quantities are associated to the first yielding of any steel bar in the cross section, while the ultimate state is identified when the most compressive fiber attains its ultimate strain. Both indexes may be evaluated from the numerical procedure explained in the previous section. However an analytical treatment is also possible by integration of Eq. (14). The resulting expressions for flexural ductility indexes are given in Eqs. (15)–(16) in terms of curvatures and by means of Eq. (17) in terms of deflections.
in which \(\rho ={A}_{s}/bd\) and \(n={E}_{s}/{E}_{c}\) are the steel and modular ratio with \({A}_{s}\) being the area of the tensile reinforcement, \(b\) is the section width, \(d\) is the effective depth, \({\alpha }_{c}\) and \(\lambda \) are the stress block parameters from Fig. 2b, and \({E}_{c}\) is the elastic modulus of concrete, which can be computed from Eq. (4). This formula is suitable when the maximum concrete stress have not reached its yielding point as defined in Stage 1 from Fig. 2c, i.e. when \(e<d/{x}_{y}-1\), where \(e = \varepsilon_{sy} /\varepsilon_{{c{\prime }}}\) and \(\varepsilon_{sy}\) and \(\varepsilon_{{c{\prime }}}\) are, respectively, the strains of steel and concrete at their yielding points, i.e.\(\sigma_{cp} = E_{c} \cdot \varepsilon_{{c{\prime }}}\) while \(x_{y}\) represents the neutral axis depth at yielding. Otherwise, when concrete strain enters into the plastic region as established in Stage 2 from Fig. 2c the following equation can be used.
The two above-mentioned equations are general and can be used with any set of stress block parameters \({\alpha }_{c}\) and \(\lambda \) according to any design code, even the NBR6118. These parameters may be also evaluated alternatively from \({\alpha }_{c}\) = \(\alpha /(2\gamma )\) and \(\lambda =2\gamma \) using Eqs. (8) and (11), respectively. Indeed, closed-form expressions for \(\alpha \) and \(\gamma \) are given in the "Appendix" section. With regard to the deflection ductility index, it can be also computed directly from Eq. (17) introducing a dimensionless parameter \(k=b/a\), where \(a\) and \(b\) are beam distances defined in Fig. 3a. The complete development of Eqs. (15)–(17) is given in the "Appendix" section for completeness. For the particular case of Bernardo and Lopes beams, a value of \(k=0.4\) is computed, and the deflection ductility index reduces to \({\mu }_{\delta }\) = 0.31 + 0.70 \({\mu }_{\psi }\). This expression is important because it correlates both indexes.
The plastic rotation capacity, defined as the rotation between adjacent sections of the plastic hinge, may be computed from \({\theta }_{p}=1.2h.\left({\psi }_{u}-{\psi }_{y}\right)\) for the particular case depicted in Fig. 3, in which \(1.2h\) represent the local plastic hinge length of beams with ductile failure according to the NBR6118, in which \(h\) is the beam height, \(d\approx 0.9h\) and \({\psi }_{y}\) is the yielding curvature computed from the "Appendix" section.
3 Numerical study
The previous numerical procedure and closed-form expressions are applied to compute the ultimate response of the HSRC beams tested by Ashour (2000) [27] and primarily to the beams tested by Bernardo and Lopes [12].
3.1 Preliminary verification with HSRC beams tested by Ashour (2000)
Nine simply supported and singly reinforced HSRC beams were tested in [27] using the same testing arrangement as depicted in Fig. 3. Table 1 lists the beam dimensions, concrete cylinder compressive strength and longitudinal reinforcement. The yielding stress of the reinforcing bars is 530 MPa. Shear reinforcements are provided along the beam length with exception of the constant moment zone between concentrated loads. Three flexural reinforcement ratios of 1.18, 1.77 and 2.37% are used.
Table 2 shows the experimental and numerical yielding load P and ultimate load Pu. As it can be seen, the loads predicted by the numerical (or theoretical) approach from Fig. 2a acceptably match the experimental ones. To check the adequacy of closed-form expressions from Eqs. (15)–(17) to evaluate ductility indexes \({\mu }_{\psi }\) and \({\mu }_{\delta }\), they are compared with those obtained from the numerical approach. As it may be observed, the closed-form expressions reasonably approach the numerical approach with less computational effort. This is important because a rapid estimation of these indexes can be made with the proposed expressions.
The Load–deflection curves at mid-span can be seen in Fig. 4. As it may be observed, good agreement is found for all beams. It is important to comment that in the quoted reference, ultimate deflections are associated to the points of maximum flexural moments, disregarding the points of the descending branch.

Load versus mid-span deflection curves
3.2 HSRC beams tested by Bernardo and Lopes (2004)
Nineteen simply supported HSRC beams submitted to two equal point loads as depicted in Fig. 5 were experimentally tested by Bernardo and Lopes [12]. The beams present the same geometry with different tension steel ratios and concrete strengths as displayed in Table 3. In fact, the beams are grouped in six series A, B, C, D, E and F based on increasing concrete strengths and tension steel ratios. All specimens are unreinforced beams, i.e. \(\rho /{\rho }_{b}\le 1\), where \(\rho \) and \({\rho }_{b}\) are the current and balanced steel ratios, so that a ductile failure is enforced. Also, stirrups are added outside the central zone to avoid shear failure. As the compressive concrete strength is obtained from companion cube-shaped specimens of 15 cm × 15 cm, the cylinder strengths is recovered by multiplying cube strengths by a size factor less than one, as the strengths from cube specimens are greater than the cylindrical ones [31]. This is because failure mode of cylindrical samples better represent the true uniaxial behavior of concrete, so that sufficiently large macroscopic homogenized properties can be used in the analysis. As the two bars of 6 mm in diameter in Fig. 5 are placed at the upper part of the beam merely for constructional purposes and since their area are very small, they can be neglected from computations with safety. Research by Evans indicates that cylinder/cube strength ratio increases with concrete strength [32]. The specimen shape factor depends upon concrete mix composition and loading age, which makes it difficult to characterize a single value for all beams. Likewise, the rate of loading at testing which may go for hours in a test, introduces another factor between 0.85 and 1.0 to be applied due to short-term sustained load [2]. Hence, the in-situ peak stress \({\sigma }_{cp}\) in the flexural test needs to be correlated to either the cylinder strength \({\sigma }_{cy}\) or cube strength \({\sigma }_{cu}\). From test results presented by Ibrahim and McGregor for HSC [33], it can be seen that the average ratio of \({\sigma }_{cp}\) to \({\sigma }_{cy}\) is 0.85. For simplicity, the authors recommend a constant ratio of 0.9, and by considering that the cylinder strength \({\sigma }_{cy}\) is 0.8 times the cube strength \({\sigma }_{cu}\), the in-situ peak stress \({\sigma }_{cp}\) is finally computed as 0.9 × 0.8 \({\sigma }_{cu}\) = 0.72 \({\sigma }_{cu}\) [34].

Geometry of simply supported HSRC beams (Units:cm)
In view of the above-mentioned reasons, in Fig. 6 three resulting reduction factors, which correlate directly the in-situ peak stress to the cube strength of 0.7, 0.8 and 0.9 are tested for beams A4 (63.2 MPa) and C2 (83.9 MPa) in order to study their influence on the overall behavior. As it may be observed, a value of 0.7 can be chosen to fit the experimental response for ultimate loads and deflections. Then, the previous value of 0.72 is adequate. Also, it is important to comment that ultimate nominal points after peak loads are defined based on minor loss of loading carrying capacity as stated in [12].

Effect of reduction specimen shape and rate loading factors
Load–deflection curves and neutral axis evolution at mid-span are depicted in Figs. 7 and 8, respectively, for fifteen beams. As a further comparison, in Fig. 7 are also plotted the results obtained with the software SAP 2000 using the concrete constitutive law by CALTRANS in which an elastic- plastic model with plastic hinges concentrated at the beam ends is used. Normally twenty two-node bar elements with one hundred of displacement increments are found to be adequate. As it may be observed, the proposed approach is able to reproduce acceptably the experimental ultimate load and mid-span deflections at all cases, proving that the adopted stress–strain constitutive relationship of Eq. (1) is adequate. Regarding the neutral axis evolution, its position at the beginning of the load (\(M/{M}_{u}\approx 0\) with \({M}_{u}\) being the flexural moment at failure), nearly coincides with the beam mid-height, i.e. \(0.6 d\approx 0.54h\), which is in accordance with the uncracked behavior of the section at this load level. This position remains constant until concrete cracking takes place, and a sudden increase of the neutral axis depth is marked. After that, the neutral axis depth remains constant until yielding of reinforcing bars occurs, in which again abruptly a new expansion of the neutral axis depth takes place. Further loading attains the neutral axis position at failure. The described procedure is consistent with the experimental data, yielding an adequate description at all load levels. However, some discrepancy may be expected at final stages, i.e. \(M/{M}_{u}\approx 1\), as the nominal ultimate strain of 0.0035 can be exceeded during the test.

Load versus mid-span deflection curves

Evolution of neutral axis depth with bending moment
A summary of experimental and numerical results in terms of load level at first yielding Py and associated deflection at mid-span δy, ultimate load at failure Pu and associated deflection at mid-span δu, as well as neutral axis depth x/d at failure are listed in Table 4. In Fig. 9 is displayed the evolution of cracking moment Mcr with the degree of reinforcement \({\lambda }_{1}=({\rho }_{t}-{\rho }_{c})/{\rho }_{b}\), where \({\rho }_{t}\), \({\rho }_{c}\) and \({\rho }_{b}\) are the tension, compression and balanced steel ratios, respectively. As it may be observed, cracking moment is nearly independent of tension longitudinal reinforcement ratio and varies linearly with cube strength as \({M}_{cr}=0.015.{\sigma }_{cu}b{d}^{2}\). From this equation, concrete modulus of rupture can be deduced as \({\sigma }_{r}=0.0657.{{\sigma }_{cy}}^{1.0634}\), indicating that tensile strength to cylinder compressive strength ratio is around 6.6% for HSC.

Cracking moment variation: a with degree of reinforcement b with cube strength
3.2.1 Prediction of Brazilian Code NBR6118:2014
The NBR 6118:2014 adopts an equivalent stress block for flexural design of HSRC beams. The stress block parameters \(\lambda =0.8-({\sigma }_{cy}-50)/400\) and \({\alpha }_{c}=0.85.\left[1-({\sigma }_{cy}-50)/200\right]\) are displayed in Fig. 2b. Both coefficients depend upon the characteristic cylinder compressive strength, \({\sigma }_{cy}\) and they have been applied to predict the ultimate resistant moment Mu_NBR for each beam. The results are listed in Table 5 besides experimental moments Mu_exp and those obtained with the numerical approach Mu_num from Sect. 2.2. As it can be inferred, the mean of the resistant flexural moments predicted by the NBR6118 overestimate the experimental ones in average by 4%. To better match the experimental results with the NBR’s approach, a modified \({{\alpha }_{c}}^{*}\) coefficient is computed in the last column of Table 5. Coefficients \({{\alpha }_{c}}^{*}\) are generally slightly smaller than the original ones and an expression like \({{\alpha }_{c}}^{*}=0.83.\left[1-({\sigma }_{cy}-50)/166\right]\) is proposed here. Also, a similar trend (not shown here) is encountered for the results obtained with the numerical approach. In Table 6 are reported the mean and standard deviation values obtained for the Bernardo and Lopes beams besides other results for HSRC beams from literature.
To verify the prediction of other regulations, the ACI (2014) [9] and FIB (2010) [35] model code formulations, which can be found in [2], are selected here. Table 7 lists the ultimate bending moments predicted according to these design codes for all studied beams. As it can be seen, the obtained bending moment ratios between the experimental moments to the predicted ones are very similar. Indeed, the ACI code yields a mean ratio of 0.94 with a standard deviation of 0.04, whereas the FIB model yields a mean ratio of 0.93 with a standard deviation of 0.039. Both models overestimate the experimental moment following a similar trend as the NBR6118 [1].
3.2.2 Assesment of ductility
Values of ductility indexes regarding curvature and deflection are listed in Table 8 for all studied beams. These results correspond to the numerical approach and closed-form expressions from Sect. 2.2 and 2.3, respectively. As it can be checked, both indexes approach each other as \(\rho /{\rho }_{b}\ge 0.5\) [13] for each serie. In Fig. 10 is shown that curvature ductility index \({\mu }_{\psi }\) decreases with both the increasing of the degree of reinforcement \({\lambda }_{1}\) and flexural strength \({M}_{u}/b{d}^{2}\) computed from Sect. 2.2. Indeed, the fitted equation \({\mu }_{\psi }= 1.23{\left({\lambda }_{1}\right)}^{-1.25}\) is proposed here to match the exponential trend in Fig. 10a, where the expression proposed by Kwan and Ho [13] \({\mu }_{\psi }=\mathrm{10,7}{\left({\lambda }_{1}\right)}^{-\mathrm{1,25}}{\left({\sigma }_{cp}\right)}^{-\mathrm{0,45}}{({\sigma }_{y}/460)}^{-\mathrm{0,25}}\) is also plotted for comparison. Furthermore, in Fig. 10b is shown that ductility of the member increases with concrete strength at a given flexural strength, flexural ductility diminishes with flexural strength and flexural strength increases with concrete strength at a given ductility. In Figs. 11a, b are displayed the evolution of \({\mu }_{\delta }\) with the degree of reinforcement \({\lambda }_{1}\) and neutral axis depth \(x/d\) at failure, respectively, obtained with the present numerical approach. As it may be observed, the following expressions \({\mu }_{\delta }=1.13{\left(\lambda \right)}^{-1.1}\) and \({\mu }_{\delta }=0.55{\left(x/d\right)}^{-1.125}\) are proposed to match the exponential trend. The advantage of proposing simple expressions is to avoid the construction of moment–curvature diagrams. In Fig. 11c is compared the evolution of \({\mu }_{\delta }\) for various approaches from Table 8. As it may be observed the closed-form expression from Eq. (17) by using analytical values for \(\alpha \) and \(\gamma \) from the "Appendix" section, compares well with the exact numerical approach given in Sect. 2.2. Some discrepancies are encountered due to the adopted stress–strain law for concrete in compression in each approach and because Eq. (17) dismiss concrete contribution in tension. Furthermore, it may be useful to group beams with similar tension reinforcement ratio to visualize the effect of concrete compressive strength in the overall response of the beams as depicted in Fig. 11d. For instance, series (A1, B1, D1, F1), (A2, A3, B2, B3, C1, C2), (A4, A5, C3, C4, E1, E2, F2) and (D2, D3) have average steel ratios of \(\rho =\) 1.6%, 2.1%, 2.8% and 3.6%, respectively. As it can be seen, ductility decreases with increasing steel ratio and increases with concrete strength for a given steel ratio.

Variation of curvature ductility index: a with reinforcement degree; b with flexural strength

Variation of deflection ductility index with various parameters
The evolution of plastic rotation capacity \({\theta }_{p}\) with non-dimensional neutral axis depth at failure is displayed in Fig. 12a according to Eq. (18). As it may be observed, a clear tendency to an exponential trend is marked. Also, it is important to highlight that the current value of \({\theta }_{p}\) can be interpreted as the area of a rectangle with dimensions of \(1.2h\) and \(\left({\psi }_{u}-{\psi }_{y}\right)\) in accordance to the moment diagram displayed in Fig. 3a, in which flexural moments between point loads are constant, i.e. a constant distribution of curvatures is admitted at this zone. As already mentioned, \(1.2h\) represents the nominal local plastic hinge length which occurs at the central zone of the beams as established in the experimental report. Nonetheless, the common case in buildings corresponds to a simply supported beam subjected to a single point load at mid-span, representing an interior support of a continuous beam between points of contraflexure, for which moment redistributions are expected at high loads. In this condition, the plastic rotation capacity will correspond to half of the area of the previous rectangle, i.e. a triangular moment diagram with a linear distribution of curvatures is formed instead of a rectangular one. Indeed, plastic rotation capacity curves labeled NBR6118 (50 MPa) and NBR6118 (90 MPa) in Fig. 12b for \({\sigma }_{y}\) = 500 MPa and cylinder strengths of 50 MPa and 90 MPa, respectively, are provided in [36] based on NBR specifications. To compatibilize comparison, it is supposed that the current data corresponds to a fictitious beam under a single concentrated load for which the plastic rotation capacity is \({{\theta }_{p}}^{*}=0.5{\theta }_{p}\). The resulting point is then plotted in Fig. 12b to show the tendency. Apparently, the adopted plastic hinge length in the NBR code seems to be adequate for the present case because the computed points are closer to the curve labeled NBR6118 (90 MPa). Furthermore, it is verified that all points are located at the descending branch of the curve, indicating a nominal ductile failure due to concrete crushing.

Plastic rotation capacity for Bernardo and Lopes beams: a close-form expression; b NBR6118 curves
4 Conclusion
In this work a analytical and numerical approach are proposed to study the overall behavior of high strength reinforced concrete beams. A common setup scheme of a simply supported beam loaded up to failure load under two symmetric point loads is studied here. Primarily experimental results of nineteen HSRC beams are compared with those obtained with the current approach in terms of failure load and evolution of neutral axis depth. Then, after validation of the numerical approach analytical formulas are proposed to evaluate ductility indexes regarding deflections and curvatures, all of which closely match the results from rigorous procedures based on moment–curvature diagrams. In this context, the following conclusions can be drawn for the HSRC beams tested by Bernardo and Lopes [12] from this study.
Ductility index decreases as tension reinforcement ratio augments, suggesting that a maximum steel ratio should be imposed to guaratee a minimum level of ductility. For instance, the beams named D2 and D3 are the most reinforced ones with tension steel ratios of 3.61%. Both beams are almost identical in all aspects; however their experimental deflection ductility indexes are 2.05 and 1.53, respectively. Meanwhile, the theoretical one is close to 1.4, which may be considered small. Hence, steel ratios as high as 3.6% can represent an upper limit. In fact, the maximum prescribed steel ratio for beams in the NBR6118 is 4% in order to guarantee a minimum level of ductility.
The mean of ultimate resistant moments predicted by the NBR6118 for the studied group of beams overestimate the experimental ones in average by 4%, being on the unsafe side. A similar trend has been found for the ACI and FIB model codes. Also, it has been shown that flexural ductility can increase with HSC at a given flexural strength. Also, ductility increases with concrete strength for a given steel ratio. All these findings indicate that the brittle behavior of HSC itself can be counterbalanced with a proper amount of reinforcement in the resulting member.
Proposed formulas for ductility indexes regarding deflections and curvatures are in close agreement with those obtained from more elaborated numerical procedures based on moment–curvature diagrams. These expressions will permit to make a rapid evaluation of these indexes under the studied configuration, which is the most used in laboratory. Preliminary, it has been found that the proposed model based on a constant ultimate compressive strain and peak stress is able to acceptably match the experimental flexural moments and neutral axis depth at all load levels, avoiding in this manner the use of variable parameters as suggested by some codes of practice. However, this issue may depend upon each case and more studies are needed in this respect.
References
NBR6118 (2014) Design of reinforced concrete structures. Brazilian Association of Technical Regulations. Rio de Janeiro, RJ. Brazil
Al-Kamal M (2019) Nominal flexural strength of high-strength concrete beams. Adv Concr Constr 7:1–9
Chiu C, Ferry F, Darwin S (2015) Crack-based damage assessment method for HSRC shear-critical beams and columns. Adv Struct Eng 18:119–135. https://doi.org/10.1260/1369-4332.18.1.119
Kwon M, Cho C, Kim J, Spacone E (2015) Nonlinear lattice-based model for cyclic analysis of reinforced normal and high-strength concrete columns. Adv Struct Eng 18:1017–1027. https://doi.org/10.1260/1369-4332.18.7.1017
Guo Y, Gao G, Jing L, Shim V (2017) Response of high-strength concrete to dynamic compressive loading. Int J Impact Eng. https://doi.org/10.1016/j.ijimpeng.2017.04.015
Li Y, Algassem O, Aoude H (2018) Response of high-strength reinforced concrete beams under shock-tube induced blast loading. Constr Build Mater 189:420–437. https://doi.org/10.1016/j.conbuildmat.2018.09.005
Al-Shamiri A, Kim J, Yuan T, Yoon Y (2019) Modeling the compressive strength of high-strength concrete: an extreme learning approach. Constr Build Mater. https://doi.org/10.1016/j.conbuildmat.2019.02.165
Hsu L, Hsu C (1994) Complete stress-strain behavior of high-strength concrete under compression. Mag Concr Res 46:301–312. https://doi.org/10.1680/macr.1994.46.169.301
ACI Committee 318 (2014) Building Code Requirements for Structural Concrete, (ACI 318-14) and Commentary (318R-14). American Concrete Institute. Farmington Hills, MI, USA.
Tasnimi A (2004) Mathematical model for complete stress-strain curve prediction of normal, light-weight and high-strength concretes. Mag Concr Res 56:23–34. https://doi.org/10.1680/macr.2004.56.1.23
Kwan A, Ho J (2010) Ductility design of high-strength concrete beams and columns. Adv Struct Eng 13:651–664. https://doi.org/10.1260/1369-4332.13.4.651
Bernardo L, Lopes S (2004) Neutral axis depth versus flexural ductility in high-strength concrete beams. J Struct Eng 130:452–459. https://doi.org/10.1061/(ASCE)0733-9445(2004)130:3(452)
Mohammadhassani M, Suhatril M, Shariati M, Ghanbari F (2013) Ductility and strength assessment of HSC beams with varying of tensile reinforcements ratios. Struct Eng Mech 48:833–848
CSA A23.3–04 (2004) Design of Concrete Structures. Canadian Standards Association. Rexdale, Mississauga. ON. Canada
NZS 3101 (2006) Concrete Structures Standard, Part 1-The Design of Concrete Structures and Part 2-Commentary on the Design of Concrete Structures. Standards Association of New Zealand. Wellington, New Zealand
Belsare S (2019) Experimental study of flexural behavior of high strength concrete. J Struct Eng Manag 6:19–23. https://doi.org/10.3759/josem.v6i2.1568
Carmo R, Lopes S (2005) Ductility and linear analysis with moment redistribution in reinforced high-strength concrete beams. Can J Eng 32:194–203
Oehlers D, Haskett M, Mohamed Ali M, Griffith M (2010) Moment redistribution in reinforced concrete beams. Proc Inst Civ Eng: Struct Build 163:165–176
Mostofinejad D, Farahbod F (2007) Parametric study on moment redistribution in continuous RC beams using ductility demand and ductility capacity concept. Iranian J Sci Technol, Trans B, Eng 31:459–471
Bernardo L, Nepomuceno M, Pinto H (2016) Flexural ductility of lightweight-aggregate concrete beams. J Civ Eng Manag 22:622–633. https://doi.org/10.3846/13923730.2014.914094
Carmo R, Costa H, Simões T, Lourenço C, Andrade D (2013) Influence of both concrete strength and transverse confinement on bending behavior of reinforced LWAC beams. Eng Struct 48:329–341. https://doi.org/10.1016/j.engstruct.2012.09.030
Tamayo J, Morsch I, Awruch A (2015) Short-time numerical analysis of steel-concrete composite beams. J Brazilian Soc Mech Sci Eng 37:1097–1109. https://doi.org/10.1007/s40430-014-0237-9
Tabassum J (2007) Analysis of current methods of flexural design for high strength concrete beams. Dissertation, RMIT University
Pam H, Kwan A, Islam M (2001) Flexural strength and ductility of reinforced high-strength concrete beams. Struct Build 146:381–389
Sarkar S, Adwan O, Munday J (1997) High strength concrete: an investigation of the flexural behavior of high strength RC beams. Struct Eng 75:115–121
Rashid M, Mansur M (2005) Reinforced high-strength concrete beams in flexure. ACI Struct J 102:462–471
Ashour S (2000) Effect of compressive strength and tensile reinforcement ratio on flexural behavior of high-strength concrete beams. Eng Struct 22:413–423
Li Y, Aoude H (2019) Blast response of beams built with high-strength concrete and high-strength ASTM A1035 bars. Int J Impact Eng 130:41–67
Bazant Z, Oh B (1984) Deformation of progressively cracking reinforced concrete beams. ACI J 81:268–278. https://doi.org/10.1016/0010-4485(84)90120-9
Alwis W (1990) Trilinear moment-curvature relationship for reinforced concrete beams. ACI Struct J 87:276–283
Yehia S, Abdelfatah A, Mansour D (2020) Effect of aggregate type and specimen configuration on concrete compressive strength. Crystals 10:1–26. https://doi.org/10.3390/cryst10070625
Evans R (1943) The plastic theories for ultimate strengths of reinforced-concrete beams. J Inst Civ Eng 21:98–121. https://doi.org/10.1680/ijoti.1943.13969
Ibrahim H, MacGregor J (1997) Modification of the ACI rectangular stress block for high-strength concrete. ACI Struct J 94:40–48
Ho J, Kwan A, Pam H (2002) Ultimate concrete strain and equivalent rectangular stress block for design of high strength concrete. Struct Eng 80:26–32
FIB Model Code (2010) Fédération Internationale du Béton. Lausanne, Switzerland
ABNT NBR6118:2014 (2015) Comments and examples of application. Brazilian Institute of Concrete. São Paulo, SP. Brazil.
Author information
Authors and Affiliations
Corresponding author
Ethics declarations
Conflict of interest
On behalf of all authors, the corresponding author states that there is no conflict of interest.
Additional information
Publisher's Note
Springer Nature remains neutral with regard to jurisdictional claims in published maps and institutional affiliations.
Appendix
Appendix
Here is presented the deduction of the closed-form expressions for ductility indexes regarding deflections and curvatures presented in Sect. 2.3. From Stage 1 in Fig. 2c in which concrete is linear elastic, the linearity of strain distribution with \({\varepsilon }_{sy}\) = \({\varepsilon }_{s2}\) is invoked as,
in which \(x = x_{y}\) is the neutral axis depth. Equilibrium of axial forces is applied.
The following equation is obtained by combining previous equations,
With the nonnegative solution,
The curvature is then obtained as,
Finally, the theoretical yielding moment \(M_{y}\) is given by,
For the other case in which concrete enters into the plastic part as sketched in Stage 2 from Fig. 2c. By geometry,
By strain compatibility,
And equilibrium of axial forces with \(\sigma_{cp} = E_{c} \cdot \varepsilon_{c^{\prime}}\)
The solution is,
The curvature is obtained with \(x_{y} = d - e \cdot x_{1}\) with \(e = \varepsilon_{sy} /\varepsilon_{c^{\prime}}\)
The theoretical yielding moment \(M_{y}\) is given by,
At the end, the yielding deflexion at mid-span is obtained by means of Eq. (14) given by the following expresion,
in which \({\psi }_{y}\) may be computed from Eq. (23) or Eq. (29). Now, regarding the ultimate limit state in which an equivalent rectangular block is used [Stage 3 from Fig. 2c] and by considering equilibrium of axial forces.
The curvature at failure is,
The theoretical ultimate moment \(M_{u}\) is,
The ultimate deflection is given by,
With these expressions at hand is possible to compute ductility indexes \(\mu_{\psi } = \psi_{u} /\psi_{y}\) and \(\mu_{\delta } = \delta_{u} /\delta_{y}\) as given from Eqs. (15)–(17). Also, the plastic rotation capacity can be computed from Eq. (18). Additionally, the stress parameters from analytical evaluation of Eqs. (8) and (11) in conjunction with Eq. (1) are given by,
with,
This means that the current expressions are general and can be used with any value of \(\varepsilon_{cu}\) and \(\varepsilon_{cp}\).
Rights and permissions
Open Access This article is licensed under a Creative Commons Attribution 4.0 International License, which permits use, sharing, adaptation, distribution and reproduction in any medium or format, as long as you give appropriate credit to the original author(s) and the source, provide a link to the Creative Commons licence, and indicate if changes were made. The images or other third party material in this article are included in the article's Creative Commons licence, unless indicated otherwise in a credit line to the material. If material is not included in the article's Creative Commons licence and your intended use is not permitted by statutory regulation or exceeds the permitted use, you will need to obtain permission directly from the copyright holder. To view a copy of this licence, visit http://creativecommons.org/licenses/by/4.0/.
About this article

Cite this article
Tamayo, J.L.P., Garcia, G.O. Reassessment of the flexural behavior of high-strength reinforced concrete beams under short-term loads. SN Appl. Sci. 3, 204 (2021). https://doi.org/10.1007/s42452-021-04190-7
Received:
Accepted:
Published:
DOI: https://doi.org/10.1007/s42452-021-04190-7