
Abstract
This study examines spillover effects following Volkswagen’s admission of emissions cheating. We first estimate initial operational losses of 8.45% of Volkswagen’s equity market capitalization on the date before the announcement, reputational losses up to five times these losses, and significant negative shocks to its stocks and bonds. Analyzing spillover effects from this shock beyond the usually only measured losses in equity value, we find significant negative net spillover effects to European competitors and suppliers in both stock and bond markets. Studying the economic effects in more detail, we show that Volkswagen’s total losses of 27.4 billion euros in terms of changes in equity market values over the first five event days are almost entirely composed of abnormal losses. Furthermore, competitors (suppliers) overall suffered 18.3 (12.6) billion euros of abnormal losses during this time, with 60% (69%) of the firms exhibiting negative changes, especially European competitors and suppliers connected to Volkswagen. These figures are further increased by negative bond market value changes. Overall, our results strongly emphasize that neglecting debt holders losses can lead to an underestimation of such events.
1 Introduction
On September 20, 2015, after an accusation by the U.S. Environmental Protection Agency (EPA), Volkswagen admitted in a public statement to illegally installing a so-called defeat device in certain diesel cars. This device disengages the car’s emission control system except when it detects that an emission control test is being carried out, and only then re-activates all emission controls. Designed to circumvent emission regulations, the device turned off the emission control system under real-world driving conditions to improve performance, resulting in these cars emitting up to 40 times more pollution than allowed. This event became known as the “Volkswagen emissions scandal”. Only in the years since the scandal first broke, it has become clear that a large part of the global automotive industry may be involved in (illegal) breaching of emission standards, probably making this one of the severest cases of economic fraud ever.
Announcements of operational loss events tend to cause significant losses in the market value of that firm’s equity, which potentially spill over to non-event firms (e.g., Hertzel et al. 2008; Cummins et al. 2012). Such operational loss events include corporate fraud as in the case of Volkswagen’s emissions cheating (e.g., Karpoff and Lott 1993; Cummins et al. 2012; Goldman et al. 2012; and Eckert et al. 2019). To illustrate stock market reactions following to the scandal, Fig. 1 shows the price development of Volkswagen, the “MSCI World Automobiles Index” and the “MSCI Europe Automobiles Index” which both comprise Volkswagen’s preference shares. For the sake of comparability, all three time series of prices are normalized to a value of 100 based on September 18, i.e. the day prior to Volkswagen’s admission. As expected, Volkswagen’s (preference) shares suffer heavy losses after the announcement. The development of the global automotive index indicates, that these losses seem to spill over to car manufacturers world-wide. European firms in particular appear to be driving the global losses, as evidenced by the development of the European automotive index. Given that Volkswagen is an European firm, we later analyze in more detail whether spillovers are related to geographical proximity.Footnote 1
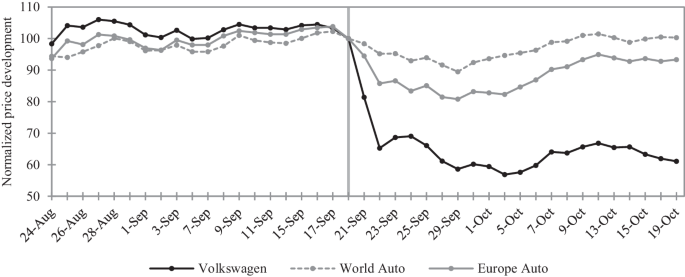
Stock market reactions for Volkswagen and the automotive industry to the emissions scandal. This figure shows closing prices for Volkswagen’s preference shares as well as indexes covering the stocks of global and European car manufacturers. The global auto index is the MSCI World Automobiles Index and the European auto index is the MSCI Europe Automobiles Index. The prices for Volkswagen are download from Eikon. The index prices are download from www.onvista.de. Both indexes report no prices for September 7, 2015. Here, we apply the closing price from the previous trading day September 4, 2015. This figure covers the period from August 24, 2015 (event day –20) to October 19, 2015 (event day 20). The last trading day before Volkswagen’s admission to emissions cheating, i.e. September 18, 2015, is marked by the vertical line. For the sake of comparability, all three time series are normalized to a price value of 100 based on September 18, 2015
Our study contributes to the literature by providing evidence for spillover effects from Volkswagen emissions scandal. We focus on the effects on Volkswagen itself, on Volkswagen’s competitors, and on suppliers to the automotive industry worldwide. When measuring these spillover effects as changes in market value, we employ stock returns and bond returns. Focusing only on stock returns could potentially result in severely underestimating losses in market value, since this would neglect losses faced by debt holders. Most closely related to our work are the studies by Griffin and Lont (2018), Bachmann et al. (2021) and Jacobs and Singhal (2020), which we present in more detail later together with further research on the Volkswagen emissions scandal.
Our empirical findings show that directly after Volkswagen publicly admitted to emissions cheating, Volkswagen’s stocks and bonds both suffered significant market value losses and that stock market value losses reflect significant reputational losses up to five times the actual operational loss, which we estimate to 8.45% of Volkswagen’s equity market capitalization on the date before the announcement. Moreover, we find significant negative net spillover effects specifically for European competitors and suppliers for stocks and bonds, indicating that the Volkswagen emissions scandal was not a shock to the car manufacturing industry in general, but a shock that particularly spilled over to European firms. For the overall sample, we only find significant net spillover effects to bonds of competitors. Economically, Volkswagen’s total losses of 27.4 billion euros in terms of changes in equity market values over the first five event days almost entirely consists of abnormal losses. We further find that competitors (suppliers) suffered 18.3 (12.6) billion euros of abnormal losses during this event window, with 60% (69%) of the firms showing negative changes in equity market values. Again, especially European competitors and the suppliers connected to Volkswagen were most heavily impacted.
Hence, we also extend insights about the contagion effect documented by Hertzel et al. (2008) by identifying geographical proximity as an influencing factor on spillover effects to suppliers. Hertzel et al. (2008) analyze bankruptcy filings, which are not a surprise for suppliers. The emissions scandal, however, was largely unanticipated. Compared with Hertzel et al. (2008), who focus on the event window [−2;2], we find particularly strong negative effects on suppliers in later time windows after the announcement date (e.g., [0;3] or [0;5]). Moreover, our findings, in combination with other previous analyses by Bachmann et al. (2021), provide further insight with respect to the relationship between reputation risk and spillover effects.
Finally, we show that similar firms may also experience (implied) volatility spillovers. Following Merton (1974), equity option-implied volatilities (as a proxy for asset volatility) may trigger a relative shift in firm value from debt holders towards equity holders. This might be one explanation why European competitors show stock returns recovering to pre-event levels in the considered event windows, whereas abnormal bond returns do not.
The remainder of this paper is structured as follows: Sect. 2 elaborates on the chronology and reviews the academic literature on the Volkswagen emissions scandal. In Sect. 3, we derive hypotheses for our empirical analyses. Sect. 4 describes the methodology applied. In Sect. 5, we present the data used and our empirical findings regarding spillover effects to competitors and suppliers worldwide. Sect. 6 adresses robustness considerations and possible extensions to our findings. Sect. 7 concludes.
2 The Volkswagen Emissions Scandal
Sect. 2 provides information about the chronology of the Volkswagen emissions scandal and a review of previous literature in this regard.
2.1 The Chronology of the Volkswagen Emissions Scandal
In May 2014, a study by the Center for Alternative Fuels, Engines & Emissions on behalf of the International Council on Clean Transportation (ICCT) marked the beginning of the Volkswagen emissions scandal. This study documented that two Volkswagen diesel models far exceeded the U.S. emission limits when emissions were measured under real driving conditions. In laboratory tests, however, emission values remained unremarkable. When asked for an explanation by the Environmental Protection Agency (EPA), Volkswagen stated that these discrepancies had already been solved by means of a software patch in a recall of about 500,000 cars. However, following tests could only find a small positive effect from this software patch and none of the other technical reasons suggested by Volkswagen could explain the high emission values (EPA 2015a). Consequently, the California Air Resources Board (CARB) and the EPA threatened not to certify Volkswagen’s 2016 diesel models for sale in the U.S. unless Volkswagen could explain the test results and guarantee that new models would not exhibit the same discrepancies. It was only at this point that Volkswagen admitted to the EPA and the CARB that it had installed a defeat device in its diesel cars (EPA 2015a). This defeat device detects whether a standard laboratory-based test is being conducted to measure emissions and only then activates all emission controls to meet the required emission limits.
On September 18, 2015, the EPA officially addressed a Notice of Violation regarding the Clean Air Act to Volkswagen, alleging that Volkswagen illegally installed defeat devices in approximately 480,000 2.0-liter diesel cars from 2009 to 2015 (EPA 2015a). On September 20, Volkswagen publicly admitted manipulations and apologized in a public statement (VW 2015a). Shortly afterwards, Volkswagen disclosed that the defeat device was installed worldwide in about eleven million cars (VW 2015b).
Only in the following years, the true extent of (potentially illegal) diesel emission regulations gradually unfolded. Most European and non-European car manufacturers were brought into at least some connection with emission regulations issues including some of their suppliers. A more detailed outline of the chronology of the scandal is provided in Appendix A.
The Volkswagen emissions scandal is not the first incident of emission cheating (He and Jin 2017). However, it represents an unprecedented case of emissions cheating that clearly dwarfs any before in terms of scale, economic and financial costs—but also with respect to health-related consequences. Previous cases differed firstly because they involved single manufacturers only. In the case of the Volkswagen scandal, it was eventually revealed that (illegal) emissions manipulation was widespread and being practiced similarly by many car manufacturers. Secondly, all previous cases combined had only led to around 4.3 million vehicles being recalled and to roughly 1.1 billion U.S. dollars in financial penalties. The Volkswagen emissions scandal surpasses these numbers with ease. Until the publication of He and Jin (2017), Volkswagen alone has recalled 11.6 million vehicles and paid 19 billion U.S. dollars in financial penalties. Thirdly, the health-related consequences are likely to be the severest ever caused in the context of emissions cheating as documented by, e.g., Barrett et al. (2015), Chossiére et al. (2017) and Oldenkamp et al. (2016).
In summary, the Volkswagen emissions scandal represents probably one of the greatest cases of (systematic) economic fraud to date, because of the involvement, in some form, of an entire industry, and because the consequences will continue to be far-reaching in terms of costs to the public at all levels. In view, therefore, of its exceptional nature and wide impact, we adopt the style of a case study to focus on the Volkswagen scandal itself and investigate its spillover effects.
2.2 A Review of Previous Literature on the Volkswagen Emissions Scandal
Table 1 provides an overview of previous literature focusing on the Volkswagen emissions scandal.
One strand of the literature reviews press releases, newspapers and litigations to investigate causes of the emissions scandal (Merenda and Irwin 2018; Crête 2016), consequences for Volkswagen (Jung and Sharon 2019; Mansouri 2016), crisis communication management (Painter and Martins 2017) as well as corporate governance and corporate culture (Goel 2015; Crête 2016; Mansouri 2016; Jung and Park 2017; Castille and Fultz 2018).
A second strand of the literature closely related to our work focuses on market value effects from the scandal on Volkswagen itself and spillover effects to other firms. With respect to economic market value effects on Volkswagen itself, articles observe a loss of vehicle sales for Volkswagen (Mansouri 2016; Bachmann et al. 2021), a deterioration in positive public (twitter) sentiment (Bachmann et al. 2021), a decline in stock returns (Mansouri 2016; Bachmann et al. 2021; Jacobs and Singhal 2020) as well as an increasing co-integration of credit default swaps and stocks (Griffin and Lont 2018). In regard to spillover effects to competitors, significantly more negative effects are found for German car manufacturers as measured by vehicle sales in the U.S., stock returns, and public sentiment in Bachmann et al. (2021). Also based on stock returns, Jacobs and Singhal (2020) show that European automakers experience significantly negative effects, while they do not find significant effects for non-European automakers.
With focus on stock returns of suppliers and business customers in the automotive industry, Jacobs and Singhal (2020) further find significantly positive effects on stock returns of non-Volkswagen suppliers, while Volkswagen-suppliers (especially from Europe) experience negative effects. Moreover, they find significantly negative effects of the scandal for European business customers of Volkswagen but no significant effects to non-European or non-Volkswagen business customers.
In summary, to the best of our knowledge there is no work that studies the impact of this event on debt holders, which is investigated in detail in this paper.
3 Hypotheses Development
Operational loss events, including those related to corporate fraud like the emissions scandal, can lead to significant losses in the equity market value of the firm announcing the loss event (e.g., Kang 2008; Gande and Lewis 2009; Gillet et al. 2010). These losses act as the obvious source of potential spillover effects. To test if a shock, as measured by losses in Volkswagen’s stocks and bonds, was a basis for potential spillover effects, we state our first hypothesis as follows:
Null Hypothesis 1: Volkswagen’s public admission of emissions cheating does not lead to a shock to Volkswagen.
Rejecting this hypothesis means that there is a shock to Volkswagen which could act as the basis for possible spillover effects.
If a shock to Volkswagen occurred, we aim to study whether it is a shock only to Volkswagen, or a shock to the entire car manufacturing industry including competitors and suppliers. Hence, we first investigate whether competitors and suppliers are affected by the emissions scandal.
Spillover effects are measured as the sum of two offsetting effects: The competitive effect and the contagion effect (e.g., Lang and Stulz 1992). The competitive effect implies that firms not directly involved in the loss event can benefit from it. For example, due to a deteriorated reputation of the loss-event firm, its customers might rather buy products of non-event firms or talented employees could move from the loss-event firm to non-event firms (e.g., Eckert 2019). Moreover, a potential drop in production efficiency of the loss-event firm might lead to higher marginal costs, lower output and higher prices. This in turn could benefit non-event firms (Lang and Stulz 1992). However, it is also reasonable to assume that firms not involved in the event might suffer a financial loss, described as the contagion effect. Cummins et al. (2012) provide two possible explanations for this. First, such events may increase the scrutiny of activities that triggered such events, possibly also shared by non-event firms. Second, loss events can also tarnish the reputation of a whole industry. King et al. (2002) and Barnett and Hoffman (2008) argue that stakeholders often do not differentiate between individual firms in an industry which Jonsson et al. (2009) summarize as “generalization”.
Spillover effects, therefore, measure the net effect and determine whether the contagion effect dominates the competitive effect (negative spillover) or vice versa (positive spillover). Note that both effects could be large in absolute value, but cancel each other out so that the net spillover is zero. Consequently, any separation of spillover effects into a contagion and a competitive component is not intended by our analyses. Against this background, we will discuss our empirical findings regarding spillover effects solely with regard to net effects.
To examine whether Volkswagen’s competitors or suppliers have suffered a shock due to negative or positive spillover as a result of the Volkswagen emissions scandal, we formulate our second hypothesis as follows:
Null Hypothesis 2: Volkswagen’s public admission of emissions cheating does not lead to positive or negative spillover effects to competitors and suppliers in general.
Rejecting the Null Hypothesis means that the contagion effects dominates the competitive effect (in case of negative spillover effects) or vice versa (in case of positive spillover effects). Otherwise the contagion and competitive effect offset each other.
To further analyze whether the news about Volkswagen is a shock to the entire car manufacturing industry in general or just a shock to Volkswagen that spilled over to specific firms, we investigate whether these effects differ for certain subsamples of competitors and suppliers. The literature on spillover effects demonstrates that the extent of the shock is related to similarities between the event firm and non-event firms, as outlined in Eckert (2019). In this respect, geographical proximity is often used to proxy for such similarities (e.g., Aharony and Swary 1996; Docking et al. 1997; Adams et al. 2015). To test if spillover effects are different for competitors who are more similar to Volkswagen, we distinguish between European (high proximity) and non-European competitors (low proximity). We further subdivide the non-European sample into Japanese, U.S., and other competitors, since effects might apply differently to certain regions grouped together as non-European.
A similar logic might apply to suppliers. Distinguishing between European and non-European suppliers is an approximation, as more detailed figures indicate connections between suppliers and manufacturers, such as sales volumes or order backlog, are hard to obtain or only for a fraction of our supplier sample. Consequently, we distinguish between European and non-European firms and formulate our third hypothesis as follows:
Null Hypothesis 3: Volkswagen’s public admission of emissions cheating does not have different spillover effects to European than to non-European competitors and suppliers.
Rejecting this hypothesis implies that similarities to Volkswagen, as measured by geographical proximity, drove potential spillover effects and that the news about Volkswagen did not lead to a shock to the car maker industry in general but to a shock to Volkswagen that spilled over to other specific firms.
4 Event Study Methodology
To determine abnormal stock returns, we employ a time series-based five-factor model by Fama and French (2015). In contrast to a simple market model, common return variation among the sample firms with respect to industry characteristics can be addressed. In addition, all sample firms share the same event date, i.e. Volkswagen’s public admission of wrongdoing. The different factors thus ensure that their realizations on certain event days do not impact abnormal returns.
Regarding corporate bonds, we follow an approach recommended by Bessembinder et al. (2009) for calculating abnormal bond returns. For each day, we select a corporate bond index that matches the respective bond in our sample in terms of currency, rating, and time-to-maturity. Abnormal bond returns are then calculated as the difference in total returns between the respective bond and its matching index. If firms have more than one bond outstanding, we apply the so-called firm level approach, as recommended by Bessembinder et al. (2009). Here, we value-weight the daily abnormal returns of a firm’s individual bonds by their market values, which results in a single time-series of abnormal bond returns per firm. To study the effects of the emissions scandal, we employ an event study framework like, e.g., Cummins et al. (2012), Knittel and Stango (2014), and Liu et al. (2017). We use September 20, 2015 (Sunday) as the announcement date since it was the first major revelation of Volkswagen’s emissions cheating to the public. The first trading day, i.e. event day zero, for the markets to incorporate this news was September 21, 2015 (Monday). In this section, we refer to abnormal returns in general, since the methodology described applies to stocks and bonds equally. We consider (cumulative) abnormal returns (CARs) during event windows prior to and after the announcement. This is important for capturing possible information leaks and to give sufficient time for the markets to fully respond to the announcement. To measure average CARs over N different firms, we apply an approach similar to Knittel and Stango (2014) or Liu et al. (2017) and form a portfolio that weights equally the abnormal returns of the N different firms on each day t into a single time-series of abnormal portfolio returns. As a result, the portfolio’s CARs match the average CARs over the N firms. We choose equal-weighting to ensure that large firms do not overlay spillover effects for smaller firms. For a few sample firms, abnormal returns cannot be calculated for some days due to, for example, lack of data (see Sect. 5.1). In these cases, we assume abnormal returns of zero which should equate to the abnormal return a potential investor would realize over the respective day.
To test the statistical significance of Volkswagen’s abnormal returns, we follow MacKinlay (1997) and report standard p-values. When testing the significance of our portfolio CARs representing N different firms, we calculate p-values based on the respective portfolio’s time-series of abnormal returns. We always use two-sided tests because spillovers can be positive or negative. To test for significant differences between the abnormal returns of different portfolios, we subtract their abnormal portfolio returns from each other and base the p-values on the resulting time-series of differences.
5 Spillover Effects from the Emissions Scandal
In this section, we describe the data used and present the empirical results.
5.1 Data
To represent the automotive market, we extract the constituents of three worldwide stock indexes provided by Thomson Reuters Datastream. The first index “WORLD-DS Automobiles” contains stocks of car manufacturers, including Volkswagen. The second index “WORLD-DS Auto Parts” covers stocks of suppliers to the automotive industry. The third index “WORLD-DS Auto & Parts” contains stocks of both manufacturers and suppliers and adds a few stocks which are not covered by the first two indexes. Furthermore, we add the stocks of firms named in a study by Statista of ten selected suppliers to Volkswagen (Statista 2016). We remove stocks of competitors which do not directly engage in car manufacturing as well as the stocks of manufacturers of two-wheelers. Because Volkswagen is a European firm, we use stock and bond data in euros.
For all sample firms, we download daily stock data from Thomson Reuters Datastream and perform various common data cleaning procedures. For the firms in our stock sample, we search for corporate bonds issued by them or one of their subsidiaries in Thomson Reuters Eikon. We focus on bonds with executable price quality only. For these bonds, we download total returns which are based on closing bid quotes. Similar to stocks, we also apply various data cleaning procedures to remove potentially unreliable observations.
We apply the U.S., North American, European, Asian, Japanese, or Global factors of the Fama and French (2015) five-factor model, based on the location of a firm’s headquarters.Footnote 2 To calculate abnormal bond returns, we obtain total return indexes of various Bank of America Merrill Lynch (BAML) corporate bond indexes available via Thomson Reuters Datastream.
Table 2 provides an overview of our sample. Competitors and suppliers are represented by 25 and 101 stocks, respectively, with the majority being non-European. The number of firms with bonds is smaller when compared to the number of the firms in our stock sample. Competitors with bonds account for 80% of the equity market valueFootnote 3 of all competitors in our stock sample. The same coverage is lower for suppliers with only 32%.
5.2 Volkswagen
Table 3 presents market reactions for Volkswagen’s stocks and bonds. Fig. 2 illustrates the corresponding CARs. Focusing on stocks (Panel A, Table 3), mostly negative but insignificant abnormal returns prior to the announcement do not point to pre-announcement leaks. For all post-announcement windows, we find significant and negative CARs for both common stock and preference shares. Over the days [0;10] following the announcement, the common stock and preference share accumulated abnormal returns of −42.59% and −52.23%, respectively.

Illustration of abnormal stock and bond returns of Volkswagen. This figure shows Volkswagen’s cumulative abnormal stock returns (Panel A) and bond returns (Panel B). Cumulative values are calculated as the sum of abnormal returns between event day –20 (August 24, 2015) and the respective event day plotted. Shaded areas in Panel B indicate different percentile ranges of the CARs of the individual bonds which enter the calculation of the value-weighted time-series of abnormal bond returns. This figure covers the period from August 24, 2015 (event day –20) to October 19, 2015 (event day 20). The last trading day before Volkswagen’s admission to emissions cheating, i.e. September 18, 2015, is marked by the vertical line
We find a very similar picture for Volkswagen’s bonds, whose abnormal returns are value-weighted into a single time-series. Panel B of Fig. 2 shows that this time-series seems to adequately represent the different bonds as indicated by the different percentile ranges of their individual CARs. Table 3 further shows that abnormal bond returns accumulated to an average of −7.57% over the eleven days [0;10] following Volkswagen’s announcement.
Overall, we can reject Hypothesis 1 for Volkswagen’s stocks and bonds. In both markets, we find significantly negative reactions. This shock served as a basis for potential spillover effects to competitors and suppliers.
To further disentangle these negative market reactions into the actual underlying operational loss and the reputational damage, we follow Gillet et al. (2010) and approximate the operational loss by the provisions for the emission scandal made by Volkswagen on September 22, 2015 which amounted to 7.3 billion U.S. dollars (6.5 billion euros) (see Moneycontrol 2015). Hence, we assume an operational loss of this size with the exceeding abnormal market value loss representing a reputational loss. Based on this, we calculate an operational loss of 8.45% in relation to Volkswagens equity market capitalization on the day prior to the announcement.Footnote 4 Following Gillet et al. (2010), we assume that this loss only affects equity, which also yields the most conservative estimate of reputational losses. Panel B of Table 3 shows significant reputational losses as cumulative abnormal stock returns in excess of this operational loss for event day zero and onward. Our findings are consistent with previous literature investigating fraud events or operational losses in general (e.g., Karpoff and Lott 1993; Karpoff et al. 2008), which finds that market reactions can significantly exceed the size of the underlying operational loss and attributes this to reputational losses. For example, investigating firms “cooking their books”, Karpoff et al. (2008) find resulting reputational losses being over 7.5 times higher than the underlying operational loss. Depending on the event window, our results in Table 3 show that Volkswagen’s reputational losses exceed the operational losses by up to five times.
5.3 Competitors and Suppliers
Table 4 presents our empirical results regarding spillover effects to competitors (Panel A) and suppliers (Panel B) in stock and corporate bond markets. Fig. 3 plots the associated CARs of stock and bond portfolios for all competitors (Panel A) and all suppliers (Panel B) (solid black lines). Over the event windows [0;0] through [0;2], the Toyko Stock Exchange was closed due to holidays which is why Japanese firms re-enter the stock market results (for non-European firms) from event window [0;3] onwards. For the stocks of competitors (Table 4, Panel A), we find positive, but insignificant, CARs prior to Volkswagen’s announcement of emissions cheating. These are more likely related to the publication of positive sales results and the presentation of new cars by especially non-European competitors in early September 2015 (e.g., BMW 2015; Daimler 2015; Nissan 2015; Toyota 2015) than to leaks before Volkswagen’s public admission of wrongdoing. After the public admission, competitors exhibit negative but insignificant CARs which seem to recover after September 28 (event day 5) with Volkswagen’s announcement of its intention to refit affected cars. Starting around October 12 (event day 15), CARs begin to turn positive, which is after Volkswagen announced it would revise its diesel strategy. Hence, investors assume that, on average, advantages and disadvantages for competitors due to Volkswagen’s emissions scandal will rather offset each other.

Illustration of spillover effects to competitors of Volkswagen and to supplier firms. This figure shows mean cumulative abnormal stock returns (first row) and bond returns (second row) of portfolios comprising competitors (Panel A) and suppliers (Panel B) as well as European and non-European firms, respectively. Cumulative values are calculated as the sum of abnormal returns between event day –20 (August 24, 2015) and the respective event day plotted. This figure covers the period from August 24, 2015 (event day –20) to October 19, 2015 (event day 20). The last trading before Volkswagen’s admission to emissions cheating, i.e. September 18, 2015, is marked by the solid vertical line. Due to the Tokyo Stock Exchange being closed from September 21 to September 23, 2015, Japanese firms re-enter the All and non-European stock samples after September 23, 2015, which is marked by the dashed vertical line
We find similar reactions for the bonds of competitors. There are no significant reactions that could point towards pre-event leaks. After the announcement, however, bonds of competitors exhibit significantly negative CARs indicating that negative effects due to the emissions scandal even spilled over into the debt of competitors, i.e. the contagion effect dominated the competitive effect. Our findings might not be entirely comparable to those for stocks because our bond sample comprises fewer firms. When reducing our competitor stock sample down to firms that are also included in our bond samples, we find even stronger negative spillover effects. Firms with bonds have larger equity market values, indicating that contagion effects from the emissions scandal might have been more relevant or competitive effects less relevant for larger firms.
For suppliers (Table 4, Panel B), we find negative but insignificant spillover effects in stock and bond markets. Like for competitors, negative spillover effects are stronger for the stocks of suppliers that are also included in the bond sample.
Overall, our findings suggest that we can reject Hypothesis 2 for Volkswagen’s competitors in bond markets. Capital markets seem to have expected negative future consequences for them. Ex post, these expectations seem to be justified. As listed in the Appendix A, almost all major European and non-European manufacturers (as well as a few suppliers) were brought into at least some connection to irregularities in emission values.
Suppliers in total, however, are not significantly affected which might seem somewhat counterintuitive as losses for manufacturers are likely to spread along the supply chain (Jacobs and Singhal 2020). One reason might be that suppliers often supply parts to multiple industries and only some exclusively produce automobile-specific parts. In addition, negative spillovers could be driven by specific competitors and, thus, only their suppliers are affected (see also the further analysis in Sect. 5.6). Consequently, these few negative spillovers might be sufficiently diversified in our global suppliers sample so that there would be no significant net spillovers.
In contrast to the stocks of competitors and suppliers, which seem to recover (from negative but insignificant effects) to pre-event levels by around event day 15, bond prices of especially competitors appear to remain at lower or higher levels, respectively.
5.4 European and Non-European Firms
Table 5 presents our findings for portfolios of European and non-European competitors, as well as differences in spillover effects between both. Panel A of Fig. 3 plots the respective CARs of stocks and bonds. Focusing on stocks (Table 5, Panel A), we see that after Volkswagen’s public admission, European competitors seem to have suffered significantly negative spillover effects for up to ten days afterwards. In contrast, non-European competitors show insignificant CARs after Volkswagen’s announcement, implying a non-significant net effect of contagion and competitive effect.
When focusing on bonds (Table 5, Panel B), we find similar patterns. Significant and negative spillover can be found for European competitors while non-European competitors are not significantly affected except for the one bond in the category “Other”. In summary, we find significantly more negative spillover (net) effects in bonds for European than non-European competitors.
In summary, our findings lead us to reject Hypothesis 3 with regard to competitors in stock and bond markets, as we find significant different spillover effects to European and non-European competitors. Stock and bond markets appear to have expected overall negative consequences mainly for European car manufacturers.
Extending the study by Bachmann et al. (2021), who link a reputational loss of “German Car Engineering” in the U.S. to the emissions scandal, our findings suggest that there is a European-wide loss of reputation for the car industry. Regarding non-European firms, markets seem to have expected no overall negative effects. In retrospect, however, most non-European car manufacturers were also involved in emission irregularities as described before. One explanation for the European losses might be that stakeholders see European firms as more similar (note that we follow previous literature and use geographical proximity as a proxy for similarity), e.g., with a higher focus on diesel cars, leading to a higher correlation between their corporate reputations (e.g., Eckert 2017).
Table 6 presents our findings for portfolios of European and non-European suppliers as well as differences in spillover effects between both. Panel B of Fig. 3 provides the corresponding CARs graphics for the stocks and bonds. In stock markets (Table 6, Panel A), we find significant and negative spillover (net effect) affecting European suppliers for several event windows, but no significant spillover effects on non-European suppliers (except for the U.S. supplier sample for day zero). Differences in spillover effects between European and non-European firms are significant for day zero and event window [0;1]. Our results hold, even when we only consider the stocks of suppliers that also have bonds.
When focusing on bonds (Table 6, Panel B), we find significant and negative spillover (net) effects for European suppliers in the first three days after the announcement day, where non-European suppliers do not show significant spillover effects except for the one “Other” bond.
We can thus also reject Hypothesis 3 for suppliers in stock and bond markets albeit based on fewer significant spillover net effects. As for competitors, both markets seem to have expected overall negative consequences for mainly European suppliers.
5.5 Implied Volatilities and Equity and Debt Losses
When comparing competitors’ stock market reactions to those in bond markets, we see that cumulative abnormal stock returns recover to pre-event levels, i.e. close to zero, while cumulative abnormal bond returns do not, as documented in Panel A of Fig. 3. In this section, we investigate one possible explanation for this phenomenon. For this purpose, we focus solely on car manufacturers, since supplier firms do not seem to exhibit this relationship (see Fig. 3).
We refer to the credit risk model by Merton (1974), where the market value of equity is captured by the value of a call option on the firm’s assets. The market value of debt is based on a portfolio containing the firm’s (risk-free) debt and a short put option on the firm’s assets. Volatility changes in the expected future returns of the underlying assets could affect equity and debt holders differently, as increases in the (expected future) asset volatility could shift firm value toward equity holders (long call) at the expense of debt holders (short put) on a relative basis, which could be one explanation for our findings. We thus investigate whether market value losses might also be accompanied by changes in asset volatility. We employ (equity) option-implied volatilities as a proxy for the asset volatility expected by (option) market participants following the scandal. Note, that equity volatilites can only serve as a proxy since asset volatilites of firms are unlevered while their equity volatilites are usually levered.
We downloaded equity options from Datastream for the car manufacturers contained in our stock sample as well as index options on broad equity indices. Based on both, we compute abnormal changes in implied volatilities. Fig. 4 displays cumulative abnormal changes in implied volatilities for Volkswagen and its competitors. As soon as Volkswagen admitted to altering emissions testing, implied volatilities for Volkswagen increase dramatically and do not return to pre-event levels. A different pattern can be observed for European competitors. While their cumulative abnormal stock returns revert to pre-event levels (close to zero), cumulative abnormal bond returns and implied volatilities remain affected. Implied volatilities of non-European competitors do not seem to be affected.
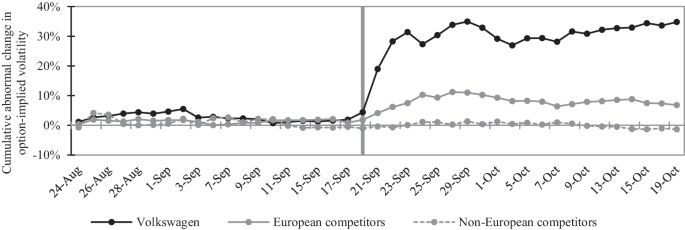
Illustration of abnormal changes in option-implied volatilities of Volkswagen and competitors. This figure shows cumulative abnormal changes in option-implied volatilities of Volkswagen and competitors. Competitors are divided into European and Non-European firms. Cumulative values are calculated as the sum of abnormal changes in option-implied volatilities between event day –20 (August 24, 2015) and the respective event day plotted. This figure covers the period from August 24, 2015 (event day –20) to October 19, 2015 (event day 20). The last trading day before Volkswagen’s admission to emissions cheating, i.e. September 18, 2015, is marked by the solid vertical line. Due to the Tokyo Stock Exchange being closed from September 21 to September 23, 2015, Japanese firms re-enter the analysis after September 23, 2015, which is marked by the dashed vertical line
These results illustrate that events like the emissions scandal might also lead to increases in option-implied volatilities, which—when being used as a proxy for asset volatility—could have triggered a relative shift in market value from debt holders toward equity holders for European competitors. Such a shift might be one reason why we see abnormal stock returns of European competitors returning to pre-event levels while abnormal bond returns remain affected at the same time (see Fig. 3).
5.6 Market Value Losses in Stock and Bond Markets
To gain a more comprehensive view of the economic consequences of the emissions scandal, we now also address spillovers in terms of changes in equity and bond market value, since these are potential losses that are ultimately realized by investors.
Table 7 presents abnormal and total changes in equity (Panel A) and bond (Panel B) market values in million euros for Volkswagen, competitors, and suppliers for the event window [0;5]. Abnormal market value changes are calculated as the changes in market values which correspond to CARs. In each panel, we also report the most and least affected firms based on their abnormal market value changes, as well as the percentages of positively and negatively affected firms.
Focusing on changes in equity market values (Panel A), Volkswagen’s total losses of 27.4 billion euros are almost entirely composed of abnormal losses. As expected (see Table 5), European competitors Daimler, BMW, and Renault suffered the largest individual abnormal losses in equity market values. In contrast, Tesla and Toyota both experienced abnormal market value gains by, among other things, outperforming falling markets. In summary, most competitors (60%) were affected negatively through the emissions scandal.
When looking at equity market value losses of suppliers, European firms do not seem to consistently exhibit the largest individual losses. Our findings suggest that specific connections between suppliers to Volkswagen itself might be relevant for negative spillovers. For example, Continental and Delphi Automotive were actively connected to the emission scandal by supplying parts which were reported to be involved in Volkswagen’s emissions cheating. The Japanese firm Denso, who is one of the largest suppliers of auto parts worldwide, had been awarded the Volkswagen Group Award for best suppliers in 2010 (Denso 2010). Like competitors, most supplier firms (69%) were negatively affected by Volkswagen’s announcement on emission cheating.
Bond market value losses (Panel B) for Volkswagen of around 1.2 billion euros might seem small when compared to losses in equity market value (Panel A). This is because first, we only apply bonds with executable price quality and second, these executable bonds only cover a fraction of total debt. As an example, our Volkswagen bonds only cover about 7% of Volkswagen’s total debt. A simplified projection of Volkswagen’s total loss in total debt market value would result in an estimated 18.15 billion euros.Footnote 5 Similar to stocks, we find that firms who are known to have close ties to Volkswagen account for the largest losses such as Faurecia and Magna, who had been recognized by Volkswagen’s FAST initiative as strategic partners of special importance in 2015 (Automobilwoche 2015). In addition, Volkswagen was Borgwarner’s main customer over the years 2013 to 2015 as measured by net sales (Borgwarner 2015).
Losses for the bonds in our sample are clearly lower when compared to stocks. Nonetheless, the bond losses remain economically relevant, emphasizing that neglecting debt capital markets can lead to a severe underestimation of spillover effects.
6 Robustness and Outlook
Sect. 6 provides robustness checks and an outlook for future research.
6.1 CDS Markets
To ensure that our results in bond markets are robust, we repeat all analyses on stocks and bonds based on credit default swaps (CDS). There is plenty of academic literature that discusses whether CDS data should be preferred over bond data for the purpose of empirical analyses. In this respect, Augustin et al. (2014 and 2016) provide an extensive basis for such a decision. In our case, we decide to apply bond data for our main analyes since we aim to include market value losses to debt holders into our analyses caused by their bond investments. Overall, our interpretations based on bonds do not change when we employ CDS instead. Detailed results can be found in Appendix B.
6.2 Non-parametric Corrado (1989) Rank Test
An alternative for testing the significance of average CARs is the t-statistic by Kolari and Pynnönen (2010). This cross-sectional test is based on scaled abnormal returns, addresses potential event-induced variance in the cross-section of firms, and corrects for the correlation between the abnormal returns of the different firms. However, the partly small numbers of firms in our cross-sections (see especially Sect. 5.4) can lead to distorted cross-sectional variances which may impact t-statistics. For robustness reasons, we additionally implement the non-parametric Corrado (1989) rank test as specified in Cowan (1992) for multi-day event windows, which is applicable with small sample sizes in event studies. In both cases, our main findings remain similar with slightly fewer significant values. Especially the differences between the European and non-European samples (competitors and suppliers) remain significant in most cases.
6.3 Future Research Avenues
A possible extension of our research findings would be to disentangle spillover effects in more detail. For example, there might be two different economic rationales by which especially European losses might be driven. First, investors might perceive the emissions scandal as a general reputational loss to the European car industry. The scandal made investors incorporate the possibility into their expectations that European car manufacturers (and suppliers) might be involved in illegal activities. Second, the losses to European car manufacturers and suppliers might be specifically related to diesel engines. Only manufacturers of diesel cars (and their suppliers) might be involved in similar deceits. Testing such hypotheses would require a suitable treatment group (European car manufacturers offering diesel cars) and control group (European car manufacturers not offering diesel cars). Unfortunately, both the small number of European car manufacturers in our sample and the fact that all of these manufacturers produce diesel cars does not allow for such analyses.
Throughout our analyses, we describe spillover effects as the sum of economic advantages (competitive effect) and disadvantages (contagion effect) that result from the emissions scandal. Other studies employ a more fundamental approach to spillover effects, such as Acharya et al. (2015) for credit markets. In their study on the GM and Ford Downgrade in 2005, they differentiate between credit and liquidity risk as fundamental channels in debt markets that can lead to co-movement patterns between firms as measured by abnormal returns. Transferred to our case, the news of the emissions scandal could lead to a decrease or increase in credit risk, depending on whether it is good news (competitive effect in our case) or bad news (contagion effect in our case) for the respective sample firm. Liquidity risk, however, should affect all firms similarly. The news of the scandal introduces unexpected uncertainty across all firms, regardless of whether this uncertainty relates to potentially positive or negative consequences. This uncertainty then could cause illiquidity to increase and, thus, lead to contagion effects as empirically shown in Acharya et al. (2015). An extension of our findings regarding credit and liquidity effects would certainly provide valuable new perspective on the impact of the emissions scandal in debt markets.
7 Conclusion
Following Volkswagen’s public admission to emissions cheating, we document significant losses for Volkswagen’s stocks and bonds. These can be considered as a potential source of spillovers to other firms.
When analyzing competitors, we find significant and negative spillover (net) effects only in bond markets. Distinguishing between European and non-European firms, we find negative spillovers in both the stocks and bonds of European firms. On the contrary, non-European firms show insignificant CARs, implying a non-significant net effect of contagion and competitive effect. This indicates that geographical proximity, as an indication for similarities to Volkswagen, is related to spillover effects. Similar relations apply to European and non-European suppliers. Here, geographical proximity might account for major relations between suppliers and car manufacturers, and thus also for connections between European suppliers and Volkswagen.
Overall, our results emphasize that spillover effects were not only limited to stocks but also extended to the debt of firms. Therefore, the total impact on investors due to shocks from operational loss events might be severely underestimated if the focus is confined solely to equity markets. In addition, we provide new insights regarding the contagion effect found by Hertzel et al. (2008), as we find that geographical proximity influences spillover effects to suppliers, and that given the unexpectedness of the event, these effects are particularly negative in (longer) event windows after the announcement date.
Notes
Fig. 1 shows a price drop on the day prior to Volkswagen’s admission for all three indexes. To investigate whether this reaction is related to the emissions scandal or not, we later apply abnormal returns as described in Sect. 4.
We thank Kenneth French for providing these factors online at http://mba.tuck.dartmouth.edu/pages/faculty/ken.french/data_library.html. All factors are converted into euros following Glück et al. (2021).
We measure equity market values as of August 21, 2015, which is the last day of the pre-event period of the event study methodology applied.
The operational loss of 8.45% is applied to both preference shares and common stock, assuming both to be affected proportionally.
The bonds of Volkswagen in our sample only cover about 18.83 billion EUR (~6.77%) of Volkswagen’s total debt, which amounted to 278.06 billion EUR as of June 2015, according to Thomson Reuters Eikon. A very simplified projection of Volkswagen’s loss in debt market value would result in an estimate of 1.23 billion EUR/6.77% = 18.15 billion EUR or 1.28 billion EUR/6.77% = 18.82 billion EUR in terms of abnormal losses.
References
Cited literature
Acharya, V.V., S. Schaefer, and Y. Zhang. 2015. Liquidity risk and correlation risk: a clinical study of the General Motors and Ford downgrade of May 2005. Quarterly Journal of Finance 5:1–51.
Adams, Z., R. Füss, and F. Schindler. 2015. The sources of risk spillovers among U.S. REITs: Financial characteristics and regional proximity. Real Estate Economics 43:67–100.
Aharony, J., and I. Swary. 1996. Additional evidence on the information-based contagion effects of bank failures. Journal of Banking and Finance 20:57–69.
Augustin, P., M.G. Subrahmanyam, D.Y. Tang, and S.Q. Wang. 2014. Credit default swaps: a survey. Foundations and Trends in Finance 9:1–196.
Augustin, P., M.G. Subrahmanyam, D.Y. Tang, and S.Q. Wang. 2016. Credit default swaps: past, present, and future. Annual Review of Financial Economics 8:175–196.
Augustin, P., M. Chernov, and D. Song. 2020. Sovereign credit risk and exchange rates: evidence from CDS quanto spreads. Journal of Financial Economics 137:129–151.
Bachmann, R., Ehrlich, G., Fan, Y., Ruzic, D., Leard, B. 2021. Firms and Collective Reputation: A Study of the Volkswagen Emissions Scandal. Unpublished working paper. University of Notre Dame, Notre Dame, IN.
Barnett, M.L., and A.J. Hoffman. 2008. Beyond corporate reputation: managing reputational interdependence. Corporate Reputation Review 11:1–9.
Barrett, S.R.H., R.L. Speth, S.D. Eastham, I.C. Dedoussi, A. Ashok, R. Malina, and D.W. Keith. 2015. Impact of the Volkswagen emissions control defeat device on US public health. Environmental Research Letters 10:1–10.
Bessembinder, H., K.M. Kahle, W.F. Maxwell, and D. Xu. 2009. Measuring abnormal bond performance. Review of Financial Studies 22:4219–4258.
Castille, C.M., and A. Fultz. 2018. How does collaborative cheating emerge? A case study of the Volkswagen emissions scandal. Proceedings of the 51st Hawaii International Conference on System Sciences, 94–103.
Chossiére, G.P., R. Malina, A. Ashok, I.C. Dedoussi, S.D. Eastham, R.L. Speth, and S.R.H. Barrett. 2017. Public health impacts of excess NOx emission from Volkswagen diesel passenger vehicles in Germany. Environmental Research Letters 12:1–14.
Corrado, C.J. 1989. A nonparametric test for abnormal security-price performance in event studies. Journal of Financial Economics 23:385–395.
Cowan, A.R. 1992. Nonparametric event study tests. Review of Quantitative Finance and Accounting 2:343–358.
Crête, R. 2016. The Volkswagen scandal from the viewpoint of corporate governance. European Journal of Risk Regulation 7:25–31.
Cummins, J.D., R. Wei, and X. Xie. 2012. Financial sector integration and information spillovers: effects of operational risk events on U.S. banks and insurers. Unpublished working paper. Philadelphia: Temple University.
Docking, D.S., M. Hirschey, and E. Jones. 1997. Information and contagion effects of bank loan-loss reserve announcements. Journal of Financial Economics 43:219–239.
Eckert, C. 2017. Corporate reputation and reputation risk. Journal of Risk Finance 18(2):145–158.
Eckert, C. 2019. Risk and risk management of Spillover effects: evidence from the literature. Risk Management and Insurance Review 23(1):75–104.
Eckert, C., N. Gatzert, and A. Pisula. 2019. Spillover effects in the European financial services industry from internal fraud events: comparing three cases of rogue trader scandals. Journal of Risk Finance 20(3):249–266.
Fama, E.F., and K.R. French. 2015. A five-factor asset pricing model. Journal of Financial Economics 116:1–22.
Gande, A., and C.M. Lewis. 2009. Shareholder-initiated class action lawsuits: shareholder wealth effects and industry spillovers. Journal of Financial and Quantitative Analysis 44:823–850.
Gillet, R., G. Hübner, and S. Plunus. 2010. Operational risk and reputation in the financial industry. Journal of Banking and Finance 34:224–235.
Glück, M., B. Hübel, and H. Scholz. 2021. Currency conversion of Fama/French factors: how and why. Journal of Portfolio Management 47(2):157–175.
Goel, A. 2015. Volkswagen: the protagonist in diesel emission scandal. South Asian Academic Research Journals 5(11):32–40.
Goldman, E., U. Peyer, and I. Stefanescu. 2012. Financial misrepresentation and its impact on rivals. Financial Management 41(4):915–945.
Griffin, P.A., and D.H. Lont. 2018. Game changer? The impact of the VW emissions scandal on the interrelation between large automakers’ equity and credit markets. Journal of Contemporary Accounting and Economics 14:179–196.
He, L., and L. Jin. 2017. A historical review of the U.S. vehicle emission compliance program and emission recall cases. White Paper Series, International Council on Clean Transportation (ICCT).
Hertzel, M.G., Z. Li, M.S. Officer, and K.J. Rodgers. 2008. Inter-firm linkages and the wealth effects of financial distress along the supply chain. Journal of Financial Economics 87:374–387.
Jacobs, B.W., and V.R. Singhal. 2020. Shareholder value effects of the Volkswagen emissions scandal on the automotive ecosystem. Production and Operations Management 29(10):2230–2251.
Jonsson, S., H.R. Greve, and T. Fujiwara-Greve. 2009. Undeserved loss: the spread of legitimacy loss to innocent organizations in response to reported corporate deviance. Administrative Science Quarterly 54:195–228.
Jung, J.C., and S.B. Park. 2017. Case study: Volkswagen’s diesel emissions scandal. Thunderbird International Business Review 59(1):127–137.
Jung, J.C., and E. Sharon. 2019. The Volkswagen emissions scandal and its aftermath. Global Business and Organizational Excellence 38(4):6–15.
Kang, E. 2008. Director interlocks and spillover effects of reputational penalties from financial reporting fraud. Academy of Management Journal 51:537–555.
Karpoff, J.M., and J.R. Lott. 1993. The reputational penalty firms bear from committing criminal fraud. Journal of Law and Economics 36(2):757–802.
Karpoff, J.M., D.S. Lee, and G.S. Martin. 2008. The cost to firms of cooking the books. Journal of Financial and Quantitative Analysis 43(3):581–611.
King, A.A., M.J. Lenox, and M.L. Barnett. 2002. Strategic responses to the reputation commons problem. In Organizations, policy and the natural environment: Institutional and strategic perspectives, ed. A.J. Hoffman, M.J. Ventresca, 393–406. Stanford: Stanford University Press.
Knittel, C.R., and V. Stango. 2014. Celebrity endorsements, firm value, and reputation risk: evidence from the Tiger Woods scandal. Management Science 60:21–37.
Kolari, J.W., and S. Pynnönen. 2010. Event study testing with cross-sectional correlation of abnormal returns. Review of Financial Studies 23:3996–4025.
Lang, L.H.P., and R.M. Stulz. 1992. Contagion and competitive intra-industry effects of bankruptcy announcements: an empirical analysis. Journal of Financial Economics 32:45–60.
Liu, L.X., H. Shu, and K.C.J. Wei. 2017. The impacts of political uncertainty on asset prices: evidence from the Bo scandal in China. Journal of Financial Economics 125:286–310.
MacKinlay, A.C. 1997. Event studies in economics and finance. Journal of Economic Literature 35:13–39.
Mansouri, N. 2016. A case study of Volkswagen unethical practice in diesel emission test. International Journal of Science and Engineering Applications 5(4):211–216.
Merenda, M.J., and M. Irwin. 2018. Case study: Volkswagen’s diesel emissions control scandal. Journal of Strategic Innovation and Sustainability 13(1):53–62.
Merton, R.C. 1974. On the pricing of corporate debt: the risk structure of interest rates. Journal of Finance 29(2):449–470.
Oldenkamp, R., R. van Zelm, and M.A.J. Hujibregts. 2016. Valuing the human health damage caused by the fraud of Volkswagen. Environmental Pollution 212:121–127.
Painter, C., and J.T. Martins. 2017. Organisational communication management during the Volkswagen diesel emissions scandal: A hermeneutic study in attribution, crisis management, and information orientation. Knowledge and Process Management 24:204–218.
Thompson, G.J., D.K. Carder, M.C. Besch, A. Thiruvengadam, and H.K. Kappanna. 2014. In-use emissions testing of light-duty diesel vehicles in the United States. Final Report, Center for Alternative Fuels, Engines & Emissions (CAFEE),. Morgantown: West Virginia University.
Web references
Automobilwoche. 2015. 22 deutsche Lieferanten dürfen mitspielen: FAST, die VW-Champions League der Zulieferer. https://www.automobilwoche.de/article/20150810/NACHRICHTEN/150819994/-deutsche-lieferanten-duerfen-mitspielen-fast-die-vw-champions-league-der-zulieferer. Accessed 15 June 2018.
BBC. 2016a. Nissan UK-built Qashqais accused of emission cheat by South Korea. http://www.bbc.com/news/business-36299555. Accessed 15 Feb 2018.
BBC. 2016b. Suzuki admits fuel testing issues but denies cheating. https://www.bbc.com/news/business-36319144. Accessed 15 Feb 2018.
BMW. 2015. Der Neue BMW 7er. http://www.bmw.de/de/topics/faszination-bmw/bmw-news.html. Accessed 14 Feb 2016.
Borgwarner. 2015. Stockholders letter and annual report on form 10‑K. https://www.borgwarner.com/investors/annual-reports. Accessed 27 July 2018.
Bosch. 2017. Bosch reaches settlement agreement for diesel vehicles in the U.S. https://www.bosch-presse.de/pressportal/de/en/bosch-reaches-settlement-agreement-for-diesel-vehicles-in-the-u-s-87936.html. Accessed 13 Feb 2019.
Bosch. 2019. Bosch reaches settlements with 50 U.S. States and Territories as well as with U.S. civil plaintiffs with regard to diesel vehicles. https://www.bosch-presse.de/pressportal/de/en/bosch-reaches-settlements-with-50-u-s-states-and-territories-as-well-as-with-u-s-civil-plaintiffs-with-regard-to-diesel-vehicles-180801.html. Accessed 13 Feb 2019.
CNN. 2016. Mitsubishi: We’ve been cheating on fuel tests for 25 years. http://money.cnn.com/2016/04/26/news/companies/mitsubishi-cheating-fuel-tests-25-years/index.html. Accessed 15 Feb 2018.
CNN. 2017. GM is latest automaker accused of diesel emissions cheating. http://money.cnn.com/2017/05/25/news/companies/gm-emissions-cheating/index.html. Accessed 15 Feb 2018.
Daimler. 2015. Strong growth in unit sales for Mercedes-Benz in Asia. https://media.daimler.com/marsMediaSite/en/instance/ko/Strong-growth-in-unit-sales-for-Mercedes-Benz-in-Asia.xhtml?oid=9920222. Accessed 21 Aug 2019.
Denso. 2010. Volkswagen Group Award for best suppliers 2010. http://www.denso.cz/en/news/94-volkswagen-group-award-2010-for-best-suppliers/. Accessed 14 June 2018.
EPA. 2015a. Notice of violation, Washington, D.C., United States. http://www.epa.gov/sites/production/files/2015-10/documents/vw-nov-caa-09-18-15.pdf. Accessed 14 Feb 2016.
EPA. 2015b. Notice of Violation, Washington, D.C., United States. http://www.epa.gov/sites/production/files/2015-11/documents/vw-nov-2015-11-02.pdf. Accessed 14 Feb 2016.
EPA. 2016. California Air Resources Board rejects VW 2‑liter diesel recall plan and issues Notice of Violation, Washington, D.C., United States. https://www.epa.gov/vw/california-air-resources-board-rejects-vw-2-liter-diesel-recall-plan-and-issues-notice-violation. Accessed 17 Sept 2017.
EPA. 2017. Notice of FCA Violation, Washington, D.C., United States. https://www.epa.gov/sites/production/files/2017-01/documents/fca-caa-nov-2017-01-12.pdf. Accessed 14 Feb 2018.
EPA. 2019. Fiat Chrysler automobiles Clean Air Act civil settlement information sheet. https://www.epa.gov/enforcement/fiat-chrysler-automobiles-clean-air-act-civil-settlement-information-sheet. Accessed 13 Feb 2019.
Focus. 2018. Mercedes-Rückruf für C‑Klasse, G‑Modell, S‑Klasse: Nach 18 Monaten ist die Zulassung Ihres Autos bedroht. https://www.focus.de/auto/news/abgas-skandal/mercedes-diesel-modelle-nach-18-monaten-droht-die-stilllegung-so-laeuft-der-daimler-rueckruf-ab_id_9088626.html. Accessed 27 July 2018.
Frankfurter Allgemeine Zeitung (FAZ). 2017. Täuschungsvorwürfe gegen Renault erhärten sich. http://www.faz.net/aktuell/wirtschaft/unternehmen/abgas-skandal-vorwuerfe-gegen-renault-erhaerten-sich-14926460.html. Accessed 15 Feb 2018.
Guardian. 2015. Four more carmakers join diesel emissions row. https://www.theguardian.com/environment/2015/oct/09/mercedes-honda-mazda-mitsubishi-diesel-emissions-row. Accessed 16 Feb 2018.
Guardian. 2016. Many car brands emit more pollution than Volkswagen, report finds. https://www.theguardian.com/technology/2016/sep/19/many-car-brands-emit-more-pollution-than-volkswagen-report-finds. Accessed 15 Feb 2018.
Handelsblatt. 2017. Staatsanwaltschaft nimmt BMW ins Visier. http://www.handelsblatt.com/unternehmen/industrie/abgasskandal-staatsanwaltschaft-nimmt-bmw-ins-visier/20680924.html. Accessed 15 Feb 2018.
Moneycontrol. 2015. Volkswagen sets aside $ 7.3 billion over emissions scandal. https://www.moneycontrol.com/news/business/companies/volkswagen-sets-aside-36-73-billion-over-emissions-scandal-1508995.html. Accessed 17 Nov 2019.
New York Times. 2017. Supplier’s role shows breadth of VW’s deceit. https://www.nytimes.com/2017/02/01/business/bosch-vw-diesel-settlement.html. Accessed 14 June 2018.
Nissan. 2015. Introducing Nissan new crossover concept. http://www.nissan-global.com/EN/NEWS/2015/_STORY/150908-01-e.html. Accessed 14 Feb 2016.
Reuters. 2018a. Ford sued by truck owners alleging diesel emissions cheating. https://www.reuters.com/article/us-ford-motor-lawsuit/ford-sued-by-truck-owners-alleging-diesel-emissions-cheating-idUSKBN1EZ292. Accessed 15 Feb 2018.
Spiegel online. 2015. Bosch weist Mitschuld von sich. http://www.spiegel.de/wirtschaft/soziales/bosch-weist-mitschuld-an-vw-abgasaffaere-von-sich-a-1054396.html. Accessed 15 June 2018.
Spiegel online. 2016. Die Diesel-Affäre ist für alle da. http://www.spiegel.de/auto/aktuell/mercedes-opel-und-co-deutsche-hersteller-rufen-630-000-autos-zurueck-a-1088748.html. Accessed 14 Feb 2018.
Spiegel online. 2017a. Staatsanwaltschaft ermittelt gegen Daimler-Mitarbeiter. http://www.spiegel.de/wirtschaft/unternehmen/daimler-staatsanwaltschaft-ermittelt-wegen-verdacht-auf-diesel-betrug-a-1140000.html. Accessed 15 Feb 2018.
Statista. 2016. Abhängigkeit ausgewählter Automobilzulieferer von dem Unternehmen Volkswagen. http://de.statista.com/statistik/daten/studie/468699/umfrage/volkswagen-abhaengigkeit-von-zulieferern/. Accessed 14 Feb 2016.
Süddeutsche Zeitung (SZ). 2017a. Auch Peugeot soll zu den Diesel-Betrügern gehören. http://www.sueddeutsche.de/wirtschaft/psa-peugeot-soll-beim-diesel-betrogen-haben-1.3658339. Accessed 15 Feb 2018.
Süddeutsche Zeitung (SZ). 2018a. BMW soll zehn Millionen Euro Bußgeld zahlen. https://www.sueddeutsche.de/wirtschaft/abgasreinigung-bmw-soll-zehn-millionen-euro-bussgeld-zahlen-1.4113929. Accessed 13 Feb 2019.
Süddeutsche Zeitung (SZ). 2018b. Rückruf bei Opel. https://www.sueddeutsche.de/wirtschaft/diesel-rueckruf-bei-opel-1.4177080. Accessed 13 Feb 2019.
Toyota. 2015. Toyota provides annual national dealer meeting highlights. http://pressroom.toyota.com/releases/toyota+2015+ndm+dealer+meeting.htm. Accessed 14 Feb 2016.
VW. 2015a. Statement of Prof. Dr. Martin Winterkorn, CEO of Volkswagen AG, Wolfsburg, Germany. http://www.volkswagenag.com/en/news/2015/9/statement_ceo_of_volkswagen_ag.html. Accessed 13 Feb 2018.
VW. 2015b. Ad hoc: Volkswagen AG has issued the following information, Wolfsburg, Germany. http://www.volkswagenag.com/en/news/2015/9/Ad_hoc_US.html. Accessed 13 Feb 2018.
VW. 2015c. Statement by Prof. Dr. Winterkorn, Wolfsburg, Germany. https://www.volkswagenag.com/en/news/2015/9/Statement.html. Accessed 13 Feb 2018.
VW. 2015d. Statement by the supervisory board of Volkswagen AG, Wolfsburg, Germany. https://www.volkswagenag.com/en/news/2015/9/Erklaerung.html. Accessed 13 Feb 2018.
VW. 2015e. Volkswagen AG announces action plan to update diesel vehicles with EA 189 EU5 Engines, Wolfsburg, Germany. http://www.volkswagenag.com/en/news/2015/9/VW_Aktionsplan.html. Accessed 13 Feb 2018.
VW. 2015f. Statement from the supervisory board of Volkswagen AG, Wolfsburg, Germany. http://www.volkswagenag.com/en/news/2015/10/Erklaerung_AR.html. Accessed 13 Feb 2018.
VW. 2015g. Volkswagen brand board of management takes strategic decisions. Wolfsburg, Germany. http://www.volkswagenag.com/en/news/2015/10/VW_Effizienz.html. Accessed 13 Feb 2018.
VW. 2015h. Technical measures for the EA 189 diesel engines affected presented to the German Federal Motor Transport Authority, Wolfsburg, Germany. http://www.volkswagenag.com/en/news/2015/11/t_KBA.html. Accessed 13 Feb 2018.
Further Reading
Fortune. 2015. It’s official: Tesla’s Model X launch event is the night of September 29. http://fortune.com/2015/09/21/teslas-model-x-launch-event/. Accessed 31 July 2018.
Guardian. 2018. Audi chief arrested in Germany over diesel scandal. https://www.theguardian.com/business/2018/jun/18/audi-chief-arrested-germany-diesel-rupert-stadler. Accessed 7 Nov 2018.
Independent. 2019. Volkswagen says cost of diesel emissions scandal has hit €30bn. https://www.independent.co.uk/news/business/news/volkswagen-profits-diesel-emissions-scandal-cost-results-a8895896.html. Accessed 17 Nov 2019.
Reuters. 2018b. Fiat Chrysler agrees to $800 million U.S. diesel-emissions settlement. https://www.reuters.com/article/us-fiatchrysler-emissions/fiat-chrysler-agrees-to-u-s-diesel-emissions-settlement-worth-nearly-800-million-idUSKCN1P41WV. Accessed 13 Feb 2019.
Spiegel online. 2017b. Ermittler durchsuchen Daimler-Standorte. http://www.spiegel.de/wirtschaft/unternehmen/daimler-razzien-wegen-dieselskandal-a-1148967.html. Accessed 15 Feb 2018.
Süddeutsche Zeitung (SZ). 2017b. VW-Manager in den USA zu sieben Jahren Haft verurteilt. http://www.sueddeutsche.de/wirtschaft/diesel-skandal-vw-manager-in-den-usa-zu-sieben-jahren-haft-verurteilt-1.3780800. Accessed 15 Feb 2018.
Acknowledgements
We are grateful for helpful comments and suggestions from Randy Dumm, Oliver Entrop, James Jones, Tobias Meyll, Michael Pagano, Sascha Raithel, Martin Rohleder, Andrea Schertler, Andreas Walter, and the participants of the 2018 Annual Meeting of the Eastern Finance Association (EFA) in Philadelphia, the 2018 Annual Meeting of the German Association of Business Research (VHB) in Magdeburg and the participants of the 2018 Annual Meeting of the American Risk and Insurance Association (ARIA) in Chicago as well as the editors of the SBUR and two anonymous referees. This research did not receive any specific grant from funding agencies in the public, commercial, or not-for-profit sectors. A former version of this manuscript was entitled “An empirical analysis of spillover effects from the Volkswagen emissions scandal”.
Funding
Open Access funding enabled and organized by Projekt DEAL.
Author information
Authors and Affiliations
Corresponding author
Ethics declarations
Conflict of interest
F. Barth, C. Eckert, N. Gatzert and H. Scholz declare that they have no competing interests.
Additional information
Consent for publication
Only public information included (dates and names of individuals in chronology of VW emission scandal: e.g. date when Martin Winterkorn resigned as CEO, date when Matthias Müller was appointed as the new CEO, date when Hans Dieter Pötsch was appointed chairman of the supervisory board).
Availability of data and material (data transparency)
The underlying data is available from the data sources described in the manuscript and may require a license (e.g. by Thomson Reuters Eikon).
All authors contributed equally.
Appendix
Appendix
1.1 Appendix A
1.1.1 Events and Revelations in Connection to the Volkswagen Emissions Scandal
1.2 Appendix B
1.2.1 Evidence from CDS Markets
For all firms in our stock sample, we look up single-name CDS, referring to them or one of their subsidiaries using Thomson Reuters Eikon. We focus on euro‑, U.S. dollar-, and Japanese yen-denominated CDS based on senior unsecured debt with a maturity of five years. For these CDS, we download daily mid-spreads and credit ratings. We apply similar screening procedures as for the stocks and bonds sample. More detailed explanations are available upon request. We do not account for changes in quanto effects in CDS spreads over time. Quanto effects are relevant if a CDS contract insures against a credit event at, for example, a Eurozone firm but is denoted in USD. Hence, the correlation between the firm’s credit risk and the EUR/USD exchange rate can impact CDS spreads. While a constant quanto effect over time would be eliminated by applying CDS spread changes, possible changes in quanto effects over the course of the emissions scandal would be considered as part of abnormal CDS spread changes (see Augustin et al. 2020).
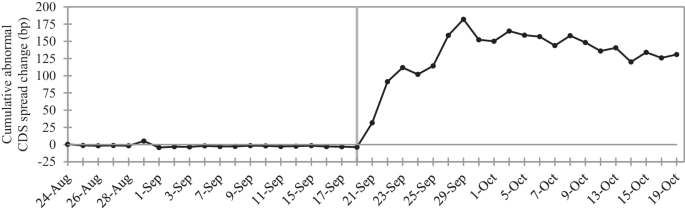
Illustration of abnormal CDS spread changes of Volkswagen. This figure shows Volkswagen’s cumulative CDS spread changes. Cumulative values are calculated as the sum of abnormal spread changes between event day –20 (August 24, 2015) and the respective event day plotted. This figure covers the period from August 24, 2015 (event day –20) to October 19, 2015 (event day 20). The last trading before the Volkswagen’s admission to emissions cheating, i.e. September 18, 2015, is marked by the vertical line

Illustration of spillover effects to competitors of Volkswagen and to supplier firms in CDS markets. This figure shows mean cumulative abnormal CDS spread changes of portfolios comprising competitors (Panel A) and suppliers (Panel B) as well as European and non-European firms, respectively. Cumulative values are calculated as the sum of abnormal spread changes between event day -20 (August 24, 2015) and the respective event day plotted. This figure covers the period from August 24, 2015 (event day –20) to October 19, 2015 (event day 20). The last trading before Volkswagen’s admission to emissions cheating, i.e. September 18, 2015, is marked by the solid vertical line
Rights and permissions
Open Access This article is licensed under a Creative Commons Attribution 4.0 International License, which permits use, sharing, adaptation, distribution and reproduction in any medium or format, as long as you give appropriate credit to the original author(s) and the source, provide a link to the Creative Commons licence, and indicate if changes were made. The images or other third party material in this article are included in the article’s Creative Commons licence, unless indicated otherwise in a credit line to the material. If material is not included in the article’s Creative Commons licence and your intended use is not permitted by statutory regulation or exceeds the permitted use, you will need to obtain permission directly from the copyright holder. To view a copy of this licence, visit http://creativecommons.org/licenses/by/4.0/.
About this article

Cite this article
Barth, F., Eckert, C., Gatzert, N. et al. Spillover Effects from the Volkswagen Emissions Scandal: An Analysis of Stock and Corporate Bond Markets. Schmalenbach J Bus Res 74, 37–76 (2022). https://doi.org/10.1007/s41471-021-00121-9
Received:
Accepted:
Published:
Issue Date:
DOI: https://doi.org/10.1007/s41471-021-00121-9