
Abstract
In recent years, there has been a surge in the prevalence of high- and multidimensional temporal data across various scientific disciplines. These datasets are characterized by their vast size and challenging potential for analysis. Such data typically exhibit serial and cross-dependency and possess high dimensionality, thereby introducing additional complexities to conventional time series analysis methods. To address these challenges, a recent and complementary approach has emerged, known as network-based analysis methods for multivariate time series. In univariate settings, quantile graphs have been employed to capture temporal transition properties and reduce data dimensionality by mapping observations to a smaller set of sample quantiles. To confront the increasingly prominent issue of high dimensionality, we propose an extension of quantile graphs into a multivariate variant, which we term “Multilayer Quantile Graphs”. In this innovative mapping, each time series is transformed into a quantile graph, and inter-layer connections are established to link contemporaneous quantiles of pairwise series. This enables the analysis of dynamic transitions across multiple dimensions. In this study, we demonstrate the effectiveness of this new mapping using synthetic and benchmark multivariate time series datasets. We delve into the resulting network’s topological structures, extract network features, and employ these features for original dataset analysis. Furthermore, we compare our results with a recent method from the literature. The resulting multilayer network offers a significant reduction in the dimensionality of the original data while capturing serial and cross-dimensional transitions. This approach facilitates the characterization and analysis of large multivariate time series datasets through network analysis techniques.
1 Introduction
In recent years, the prevalence of multidimensional data has surged across various research fields thanks to technological advancements that have enabled the generation of vast datasets using advanced sensing technologies. While time series analysis, a well-established field [11, 17], has traditionally focused on the analysis of time-indexed univariate data, the contemporary data landscape now encompasses high-dimensional, multivariate, and panel time series data collected concurrently from numerous sensors. Existing methods for analyzing such data are often constrained, designed for specific domains, and rely on various assumptions, leaving many unresolved challenges and hindering broader applications (see [22] for more details). For instance, the high dimensionality of the data imposes limitations on computational and memory capacities, rendering the application of conventional methods difficult and often impractical.
Efforts to confront the challenges posed by high-dimensional temporal data have emerged within the realms of data mining, machine learning, and network science. Specifically, network science offers a vast array of both elementary and complex topological features for characterizing various properties of network structures [2, 9]. Recent developments have introduced advanced graph structures, known as multilayer networks, which facilitate the modeling of multidimensional data without sacrificing essential properties, including both intra-dimensional and inter-dimensional connections. Multilayer networks are intricate structures capable of establishing internal connections within the same layer/graph and external connections between different layers/graphs. Despite being a relatively recent addition to the field of network science, well-established methods, and methodologies can be readily extended and adapted to this innovative concept [14].
In this study, our primary focus is on a recent multilayer network-based approach for analyzing and representing multivariate time series data. This approach is relatively novel, especially in the context of constructing multilayer networks. Traditional approaches often involve simplifying multivariate time series into single-layer networks, which can lead to the loss of valuable data information crucial for comprehensive analysis. Furthermore, existing methods that map multivariate time series to multilayer networks have raised questions, as indicated in prior research [18, 20]. For instance, the multiplex visibility graphs [12, 15] only establish external connections between the same node across different adjacent layers, potentially overlooking direct external connections between different nodes. Another recent example is the multilayer horizontal visibility graphs [20], which can be computationally intensive and impractical for handling large datasets.
In the realm of univariate time series analysis, quantile graphs [8] have been proven to be effective in mapping transition properties, offering the advantage of reducing data dimensionality. Given these properties and considering the aforementioned challenges, our work introduces a novel method for mapping multivariate time series data. This method extends the concept of quantile graphs to a multivariate context, resulting in what we term the “Multilayer Quantile Graph” (MQG). The process entails establishing cross-dimensional connections between contemporaneous data quantile samples (that is, between data quantiles at the same timestamp) among the univariate components of the time series dataset.
Our primary objective in this study is twofold: first, to introduce a new multivariate mapping method within the taxonomy of time series mappings [20], and second, to advance the representation of multivariate time series data using multilayer time series networks. To accomplish this, we evaluate the proposed mapping approach using a synthetic multivariate time series generated from a selected set of multivariate time series models. We analyze high-level topological properties proposed in [20] through features extracted from the resulting multilayer quantile graphs and use these properties to assess and analyze the mapping method. Additionally, we compare our results with a similar method, the multilayer horizontal visibility graph, which we introduced in our prior work [20]. We also apply the topological features extracted from MQG on several benchmark multivariate time series datasets. We perform a classification mining task to evaluate their efficacy. Figure 1 illustrates the methodology employed in this study.

Schematic diagram of the multilayer network-based approach to multivariate time series reducing and mining
In summary, our contributions in this work can be summarized as follows:
-
A novel concept of a multivariate time series mapping into a multilayer network, capable of capturing characteristics of the underlying time series into the topology of the mapped network;
-
An implementation of the proposed method that is more efficient than a similar method that we previously proposed [20];
-
Empirical experimentation on a diverse set of synthetic and benchmark multivariate time series, showcasing the efficacy and usefulness of our approach.
The remainder of the paper is organized as follows. Section 2 introduces the necessary background and notation to facilitate the understanding of the subsequent sections. Section 3, provides a concise overview of the main existing multivariate time series mapping approaches. Section 4 proposes a novel multivariate time series mapping method. Section 5, details the evaluation methodology and describes the experiments conducted. Lastly, in Sect. 6, we offer our conclusions, provide insights, and outline future research.
2 Preliminaries
To facilitate the comprehension of the paper, we introduce the necessary background and notation on multivariate time series and multilayer networks.
2.1 Multivariate time series
We can think of time series data as collections of observations indexed by time. Formally, we can define a Univariate Time Series (UTS) as a sequence of (scalar) observations time-indexed usually denoted by \(\{{Y}_t\}_{t=1}^{T},\) and a Multivariate Time Series (MTS) as a vector of m observations obtained at each time t, i.e., \(\varvec{Y}_t = [Y_{1,t}, Y_{2,t}, \ldots , Y_{m,t}]^{\prime },\) where \(\prime \) represents the transpose. We denote an MTS by \(\varvec{Y}=\{\varvec{Y}_t\}_{t=1}^{T}\) and the UTS components of the MTS \(\varvec{Y}\) by \(\varvec{Y}^{\alpha }=[Y_{\alpha ,1}, Y_{\alpha ,2}, \ldots , Y_{\alpha , T}]\) with \(\alpha =1, \ldots ,m,\) thus, we can denote an MTS data by its components, \(\varvec{Y}=\{Y^{\alpha }\}_{\alpha =1}^{m}.\)
UTS is ordered in time and usually presents serial correlation as opposed to a random sample. MTS presents not only serial correlation within each UTS component, \(\varvec{Y}^{\alpha },\) but also (contemporaneous and lagged) correlation between the different UTS components, \(\varvec{Y}^{\alpha }\) and \(\varvec{Y}^{\beta }, \alpha \ne \beta .\) Thus, analyzing MTS depends on key dependence measures such as the autocorrelation function (ACF), which measures the linear predictability of a UTS, and the cross-correlation function (CCF), which measures the correlation between any two different UTS components of the MTS. The theory of UTS analysis is mature and solid, and although the methods and statistical models extend naturally to the multivariate case new issues and new concepts inevitably arise [22]. An adequate MTS analysis requires advanced tools, methods, and models for mining information from multiple components that present temporal and cross-sectional correlations and impose high-dimensionality issues.
2.2 Multilayer networks
An alternative time series analysis approach is to map univariate and multivariate time series data to a network representation and use network science methodologies to analyze the original time series. Simply, a network (or graph) is a mathematical structure, \(G=(V, E),\) that represents a set of elements by nodes, V, and the connections between elements by a set of edges, E.

An illustrative example of a a toy multilayer network with five entities \(V= \{1,2,3,4,5\}\) and two elementary layers \(L_1\) and \(L_2\), and b the corresponding supra-adjacency matrix. The solid lines (colored blocks) represent intra-layer edges and the dashed lines (gray blocks) represent inter-layer edges. Source: Modified from [18]
A Multilayer Network (MNet) is a more general and complete definition of a network that can model several types of connections between elements of the same and different systems. Formally, a MNet is defined by \(M = (V_M, E_M, V, \varvec{L})\) [14], where V and \(\varvec{L}\) represent the sets of entities and layers, respectively, and \(V_M\) represents the set of node-layer combinations, \(V_M \subseteq V \times L_1 \times \ldots \times L_m,\) in which a node is present in the corresponding elementary layer \(L_{\alpha } \in \varvec{L}.\) And \(E_M \subseteq V_M \times V_M\) represents the set of edges (pairs of possible combinations of nodes and elementary layers), we call intra-layer edges to the connections between nodes of the same layer, \((v_i^{\alpha }, v_j^{\alpha }),\) and inter-layer edges to the connections between nodes of different layers, \((v_i^{\alpha }, v_j^{\beta })\) with \(\alpha \ne \beta .\) A MNet can be represented by an adjacency tensor of order 4, \(\pmb {\mathcal {A}},\) with tensor element \(\mathcal {A}_{i,j,\alpha ,\beta } = 1\) if \((v_i^{\alpha }, v_j^{\beta }) \in E_M\) and is 0 otherwise [14]. Another representation is flattening \(\pmb {\mathcal {A}}\) into a supra-adjacency matrix, \(\varvec{A}\), where intra-layer edges are associated with diagonal element blocks and inter-layer edges with off-diagonal element blocks [20]. So, we can infer the following types of subgraphs:
-
Intra-layer graphs, \(G^{\alpha }\), formed by the diagonal element blocks, \(\left[ \begin{array}{cc} \varvec{A}^{\alpha } &{} \varvec{0}\\ \varvec{0} &{} \varvec{0} \\ \end{array}\right] \), i.e., intra-layer edges, \(A_{i,j}^{\alpha }\),
-
Inter-layer graphs, \(G^{\alpha ,\beta }\), formed by off-diagonal element blocks, \(\left[ \begin{array}{cc} \varvec{0} &{} \varvec{A}^{\alpha ,\beta } \\ \varvec{A}^{\beta ,\alpha } &{} \varvec{0} \end{array} \right] , \alpha \ne \beta \), i.e., inter-layer edges, \(A_{i,j}^{\alpha ,\beta }\) and \(A_{j,i}^{\beta ,\alpha }\), and no intra-layer edges, \(A_{i,j}^{\alpha } = 0\) and \(A_{i,j}^{\beta } = 0\), and
-
All-layer graphs, \(G^{\alpha , \beta }_{all}\), formed by both on and off-diagonal element blocks, \(\left[ \begin{array}{cc} \varvec{A}^{\alpha } &{} \varvec{A}^{\alpha ,\beta } \\ \varvec{A}^{\beta ,\alpha } &{} \varvec{A}^{\beta } \end{array} \right] , \alpha \ne \beta \), i.e., intra-layer edges, \(A_{i,j}^{\alpha }\) and \(A_{i,j}^{\beta }\), and inter-layer edges, \(A_{i,j}^{\alpha ,\beta }\) and \(A_{j,i}^{\beta ,\alpha }\).
Figure 2 illustrates a simple representation of a multilayer network and the corresponding supra-adjacency matrix.
Network science encompasses a rich array of methodologies, along with a multitude of topological, statistical, spectral, and combinatorial properties, which are instrumental in the analysis and extraction of information from single-layer networks (see [2, 16]). These methodologies and properties can be seamlessly extended to the structure of MNet and their respective subgraphs. Additionally, there are emerging methods specifically tailored for the study of MNet structures [14].
3 Time series mappings
The literature presents a wide range of time series mapping methods for converting both UTS and MTS data into network representations. This innovative framework for time series analysis revolves around a mapping function that can draw inspiration from various concepts, including visibility, transition probability, proximity, time series models, and statistical principles [23]. These mappings can result either in single-layer Footnote 1 or multilayer networks [18]. Until now, the predominant focus has been on strategies for mapping UTS into single-layer networks, while the development of mapping MTS has not been as extensive [18]. In particular, the most commonly employed approach involves techniques that condense MTS data into single-layer networks. In this approach, the node set represents the components of the MTS, denoted as \(Y_{i,t}\), and the edge set is determined by a statistical model or a correlation measure applied to these UTS components. While this method effectively reduces the dimensionality of MTS data into a more compact structure, namely a single-layer network, it comes at the cost of significant data reduction, preserving only the information captured by the models or measures employed within the mapping function [18].
Mapping MTS to a MNet represents a cutting-edge and promising approach aimed at retaining more comprehensive data information. Initial efforts concentrated on leveraging multiplex networks (see more in [12, 15, 18]). Specifically, a multiplex network is a particular type of multilayer network defined by a sequence of m graphs, denoted as \(\{G^{\alpha }\}_{\alpha =1}^m = \{(V^{\alpha }, E^{\alpha })\}_{\alpha =1}^m\), that share the same set of nodes across layers (i.e., \(V^{\alpha } = V^{\beta }\) for all \(\alpha , \beta \)) and the inter-layer edges can only connect the same nodes in adjacent layers (i.e., \((v_i^{\alpha }, v_j^{\beta })\) with \(i = j\) and \(\alpha \ne \beta \)) [4].
Mapping MTS to multiplex networks involves mapping each UTS component onto an individual layer, representing every timestamp (or its corresponding representation) as a unique node, and establishing intra-layer connections based on the fundamental principles of UTS mapping. Additionally, connections between distinct UTS are defined through inter-layer edges that link only contemporaneous nodes across consecutive (adjacent) layers.
In our previous work [20], we introduced a novel mapping approach based on the concept of visibility and the general definition of multilayer networks. It is called Multilayer Horizontal Visibility Graph (MHVG). This method maps MTS data to an MNet structure, incorporating intra-layer edges derived from UTS visibility mapping and inter-layer edges connecting (directly) lagged nodes between pairs of layers using a novel concept known as cross-visibility. The results of this proposed mapping approach were promising, demonstrating the MNet’s capacity to capture complementary information captured by the created connections between different nodes in different layers. However, one drawback of the MHVG mapping method is its computational intensity, especially when applied to large datasets featuring numerous time series components. MHVG has computational complexity \(\mathcal {O}(m^2T^2)\) which is determined by the procedure that tests the cross-horizontal visibility connections between all pairs of time series in an MTS data.
In this work, we introduce a novel mapping approach aimed at mitigating the computational challenge mentioned above. Our primary objective remains to preserve the MNet structure, which encompasses both intra and inter-layer connections. However, we seek to simultaneously reduce data dimensionality and computational complexity. To achieve this goal, we turn to quantile graphs [8]. Building upon the concepts introduced in [20], we extend the QG methodology to fit within an MNet structure, a topic we delve into in the subsequent section.
4 MQG: a novel multivariate time series mapping
A quantile graph (QG) is the result of a UTS mapping technique rooted in the concept of transition probability, which has consistently demonstrated remarkable efficacy in capturing the essential characteristics of UTS data [5, 10, 19]. This method operates by mapping the serial transition probabilities governing the dynamics between UTS data timestamps using a limited set of symbols, typically sample quantiles.
In this section, we introduce an innovative QG algorithm designed to map MTS data into a multilayer quantile graph (MQG). This algorithm entails the establishment of fresh connections among UTS components. These connections are created by extending the concept of transition probability and incorporating sample quantiles from the UTS components. We start by introducing the QG algorithm tailored for UTS data, followed by the unveiling of the MQG algorithm, customized for MTS data.
4.1 Quantile graph
The QG algorithm [18] (see Algorithm 1) starts to assign the UTS observations to bins that are defined by \(\eta \) sample quantiles, \(q_{1}, q_{2},..., q_{\eta }\). Each sample quantile, \(q_{i}\), is mapped to a node \(v_{i}\) of the corresponding graph (a single-layer network) and edges between two nodes \(v_{i}\) and \(v_{j}\) are directed and weighted, \((v_{i}, v_{j}, w_{i,j})\), with \(w_{i,j}\) corresponding to the transition probability between quantile ranges. The adjacency matrix is a Markov transition matrix: \(\sum _{j=1}^\eta w_{i,j} = 1\), for each \(i = 1, \ldots , \eta ,\) and the single-layer network is weighted, directed and contains self-loopsFootnote 2. Figure 3 illustrates this mapping method.

Illustrative example of the quantile graph algorithm for \(\eta = 4\). a illustrates a toy univariate time series with colored regions representing the different \(\eta \) sample quantiles, and b the corresponding network generated by the quantile graph algorithm. The thicker directed lines represent the edges with greater weights accounting for repeated transitions between quantiles. Source: Reproduced from [18]
Typically, the number of quantiles (\(\eta \)) is significantly smaller than the length of the time series (\(\eta \ll T\)). If \(\eta \) is excessively large, the resultant graph may not be connected, resulting in isolated nodesFootnote 3. Conversely, if \(\eta \) is too small, the QG may exhibit a substantial loss of information, characterized by the assignment of high weights to self-loops.
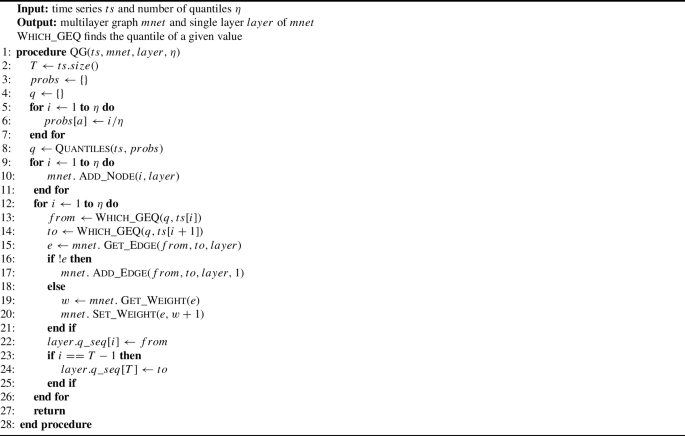
Quantile Graph
4.2 Multilayer quantile graph
The MQG algorithm (see Algorithm 2) builds upon the foundational principles introduced in the preceding QG framework. It starts by mapping all UTS components within MTS data, \(\{\varvec{Y}^{\alpha }\}_{\alpha =1}^m\), to the corresponding QGs. In this step, for each UTS \(\varvec{Y}^{\alpha }\), the temporal quantile sequence associated with the resulting QG is stored, and it is denoted as \( \varvec{Q}_{\alpha } = \{q_i^{\alpha ,1}, q_i^{\alpha ,2}, \ldots , q_i^{\alpha ,T}\}\) with \( i = 1, \ldots , \eta \). Subsequently, for each pair of UTS, denoted as \(\varvec{Y}^{\alpha }\) and \(\varvec{Y}^{\beta }\), the contemporaneous quantiles (\(q_i^{\alpha ,t}\) and \(q_j^{\beta ,t}\) at the same time t) are linked by inter-layer edges representing the cross-dimensions contemporary transitions. For reasons of simplicity, from this point on we will omit the superscript temporal index in the quantile sequence, that is, we will simply denote \( \varvec{Q}_{\alpha } = \{q_i^{\alpha }, q_i^{\alpha }, \ldots , q_i^{\alpha }\}\).
In more detail, the MQG involves the following three steps (see Fig. 4):
- Step 1::
-
each UTS component, \(\varvec{Y}^{\alpha }, \alpha = 1, \ldots , m,\) is mapped to a QG, \(L_{\alpha },\) by applying the Algorithm 1 (top of Fig. 4).
- Step 2::
-
each pair of QGs, \(L_{\alpha }\) and \(L_{\beta }, \alpha ,\beta = 1, \ldots , m\) and \( \alpha \ne \beta ,\) is connected by the corresponding contemporary quantiles, \(q_i^{\alpha }\) and \(q_j^{\beta }, i,j = 1, \ldots , \eta ,\) at the same time \(t = 1, \ldots , T\) (panel (b) of Fig. 4 and Algorithm 3). The quantiles \(q_i^{\alpha }\) and \(q_j^{\beta }\) belong to the temporal sequences \(\varvec{Q}_{\alpha }\) and \(\varvec{Q}_{\beta },\) respectively. The weight \(w_{i,j}^{\alpha ,\beta }\) represents the probability that \(Y_{\alpha ,t}\) and \(Y_{\beta ,t}\) belong to the quantiles \(q_{i}^{\alpha }\) and \(q_{j}^{\beta },\) respectively, at the same time.
- Step 3::
-
an MTS, \(\varvec{Y},\) is mapped into an MQG, M, (panel (c) of Fig. 4). Layer set refers to each QG, \(L_{\alpha } \in \varvec{L}, \alpha =1, \ldots , m,\) and the node-layer set refers to the sample quantiles, \(V_M = \{q_i^{\alpha }\}_{i=1}^{\eta }.\) The directed weighted intra-layer edges, \((q_i^{\alpha }, q_j^{\alpha }, w_{i,j}^{\alpha }) \in E_M,\) of individual QG are established in the corresponding layer, \(L_{\alpha },\) and the bidirectional weighted inter-layer edges, \((q_i^{\alpha }, q_j^{\beta }, w_{i,j}^{\alpha ,\beta }) \in E_M, \alpha \ne \beta ,\) of pairwise QGs are established between dimensions pairwise layers, \(L_{\alpha }\) and \(L_{\beta }.\)
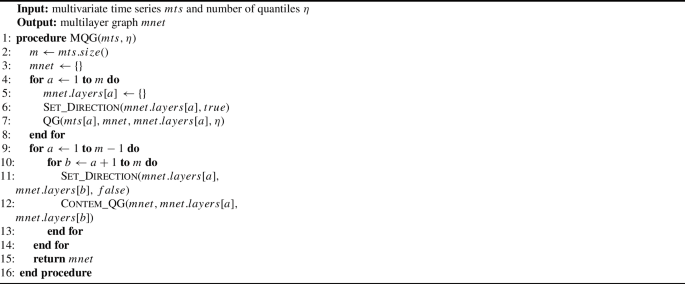
Multilayer Quantile Graph
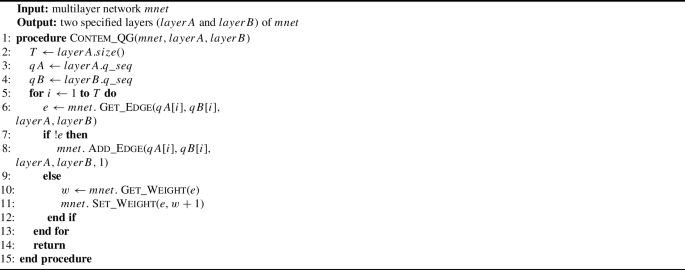
Contemporaneous Quantile Graph
MQG is a directed and weighted MNet. Note that the inter-layer edges are bidirectional, that is, whenever there is a transition from \(q_i^{\alpha }\) to \(q_j^{\beta }\) there is an equivalent transition from \(q_j^{\beta }\) to \(q_i^{\alpha }.\) This symmetry implies that inter-layer edges can also be equivalently represented as undirected edges. To clarify the relationship with the MNet subgraphs described in Sect. 2.2, we can distinguish two key components within the MQG: a) intra-layer graphs, which correspond to individual QGs, and; b) inter-layer graphs, which correspond to bipartite graphs representing contemporaneous transitions. We will refer to these bipartite graphs as contemporaneous quantile graphs.

Schematic diagram of the multilayer quantile graph algorithm for \(\eta =4\): a original time series, b illustration of the intra-layer quantile graphs (colored regions representing the different sample quantiles) and inter-layer contemporaneous edges mapping, c Multilayer quantile graph: black lines represent the intra-layer edges (the QGs), dashed lines the inter-layer edges between nodes contemporaneous quantile nodes, and the thickness of the lines represent the weighted intensities of the edges
4.3 MQG: computational complexity
The computational complexity of the MQG algorithm depends on two variables: T, the time series length, and m, the number of variables. The two for-loops in lines 4 to 8 and lines 9 to 14 of Algorithm 2, determine the algorithm complexity. The first for-loop iterates m times the QG Algorithm 1 (for each time series component), thus it has complexity \(\mathcal {O}(m (\eta T))\). The second for-loop consists of two nested loops iterating the contemporaneous QG Algorithm 3 through pairs of time series components; thus, it has complexity \(\mathcal {O}(m^2T)\). This results in a temporal complexity of \(\mathcal {O}(m^2T)\) for the MQG Algorithm 2 which is determined by proceeding the contemporaneous transitions between all pairs of time series in an MTS.
As typically the variable T is much larger than the variable m, the MQG is more efficient in terms of time complexity than the MHVG algorithm.
Regarding spatial complexity, MQG produces a multilayer network with \(m \times \eta \) nodes, while MHVG produces \(m \times T\) nodes. Given that the number of quantiles \(\eta \) is typically much smaller than the length of the time series T, this means that the underlying network representation will also be much smaller, as the number of possible edges in MQG is \(\mathcal {O}((m \times \eta )^2)\) while in MHVG is \(\mathcal {O}((m \times T)^2)\).
5 Analyzing multivariate times series data via MQG
Analyzing time series data by leveraging features extracted directly and indirectly from the data has emerged as a recent and promising approach in time series data mining [13, 19, 21]. In this section, we will use the topological features introduced in [20]. These features are based on both intra-layer and inter-layer edges, and our goal is to apply them to analyze the proposed MQG method. The aim is to ascertain whether the information conveyed by inter-layer edges complements the insights gained from intra-layer edges, which is the conventional approach in the literature.
We empirically analyze the proposed MQG algorithm by applying it to a rich MTS dataset and employ data mining techniques to analyze this dataset. We first use a set of synthetic data with different MTS correlation properties, both serial and cross-correlation [20]. Then, we use different sets of benchmark datasets with a diverse range of data characteristics and with varying dimensions, including differences in time series length and the number of time series components. Before our evaluation, we begin with some considerations about the adopted methodology’s implementation.
5.1 Implementation details
We start by mapping each MTS data \(\varvec{Y}\) into the corresponding MQG using the Algorithm 2 presented in Sect. 4. We use the formula \(\eta \approx 2T^{1/3}\) defined in [6] to choose the number of quantiles (an input parameter of the MQG algorithm). We also highlight the subgraphs corresponding to intra-, inter-, and all-layer graphs using the corresponding adjacency submatrices of the resulting MQG, as defined in Sect. 2.2. Then, we map each MTS data from a dataset of MTSs to the corresponding MQGs (one MQG for each MTS instance) and extract for each MQG the corresponding topological features. For this, we use the high-dimensional topological features presented in [20] and the methodologies and algorithms described in this work. In short, we compute the following features for each of the resulting MQGs and their subgraphs:
-
Average degree (\(\bar{k}\)): computing the arithmetic mean of the degrees \(k_i\) of all node \(v_i\) in the respective subgraph;
-
Average path length (\(\bar{d}\)): using an algorithm that computes the average shortest path length between all pairs of nodes (of respective subgraphs) using a breadth-first search algorithm;
-
Modularity (Q): computing how good a specific division of the corresponding subgraph into communities is, based on the number of triangles and number of triples;
-
Number of communities (S): using a function that makes use of the known “Louvain” algorithm that finds community structures by multi-level optimization of modularity (Q) feature (see [3] for more details),
-
Average ratio degree (\(\bar{r}\)): computing the arithmetic mean of the ratio degrees \(r_i\) of all node \(v_i\) in the respective subgraph (this is a new topological measure proposed in [20], where in general the ratio degree is defined as the ratio between inter-layer degree and intra-layer degree of a given node in the network);
-
Jensen–Shannon divergence (JSD): computing the similarity between two degree distributions using the known Jensen–Shannon divergence measure.
We calculate the first four measures (\(\bar{k}, \bar{d}, Q\) and S) in the three different possible subgraphs, i.e., intra-, inter-, and all-layer graphs, and the resulting set of features are called intra-features, inter-features and all-features. The last two measures (\(\bar{r}\) and JSD) measure the similarity between different connections in the network and are called relational features [20]. The combination of these feature sets results in a unique vector of features.
We used C++ and its needed set of libraries (such as igraph and standard libraries) to implement the data structure to store an MNet and compute the functions to extract the topological features.
5.2 Synthetic data set: multivariate time series models
We use the six linear and nonlinear bivariate time series models (\(m=2\)) summarized in Table 1 and described in detail in [20]. For each of the six different MTS models, we generate 100 instances of length \(T = 10000\), and the parameters are chosen so that the data exhibits a range of serial and cross-correlation properties as described in Table 1. From here on, we refer to this data set as multivariate data generating processes (MDGP) .Footnote 4
In short, MDGP is a diverse set of MTS models with a specific set of properties related to serial and cross-correlation characteristics, namely: white noise (WN) processes representing the noise effects, vector autoregression (VAR) processes representing smooth linear data, and vector generalized autoregressive conditional heteroskedasticity (VGARCH) processes representing nonlinear data with high or low volatility. Furthermore, these processes are designed to represent different levels of correlation, that is, data with and without serial and cross-correlation and data with weak and strong correlation properties both serial and cross, as well as lagged and contemporaneously. The parameters were chosen in order to control these properties. A detailed description of the MDGP and their properties, as well as computational details, can be seen in [20].
5.2.1 MQG feature space
Particularly, for the MDGP we define \(\eta = 50\) to the number of quantiles parameter, as in [7, 19], which is also a value close to the result of the formula \(\eta \approx 2T^{1/3}\) mentioned above. From the resulting diversified vector of 21 high-dimensional topological features (intra-, inter-, all-layer, and relational features) extracted from the resulting multilayer time series networks, MQGs, we perform a principal component analysis (PCA). The obtained PCA feature space is illustrated in Fig. 5 and shows which MNet topological features capture the different properties of the MDGP.

Bi-plot of the first two PCs of MQG topological feature set for the synthetic bivariate dataset. Different colors represent the different multivariate data generating processes and the arrows represent the contribution of the corresponding feature to the PCs: the larger the size, the sharper the color, and the closer to the red the greater the contribution of the feature. Features grouped are positively correlated, while those placed on opposite quadrants are negatively correlated
The feature space is shown in a bi-plot obtained using a total of 21 features with the two PCs explaining 89.5% of the data variance. We can see a good distribution of the characteristics inherent to each sample model. All topological features contribute to the arrangement of the samples which capture different properties of the MTS models. In particular, we can see that the average degree and the number of communities of intra-layer graphs of MQG try to place the WN models in the third quadrant, while the same features for inter-layer graphs try to place the VGARCH and VAR models weakly correlated in the second quadrant. The communities-based features and the average ratio degree seem to contribute to distinguishing the strong and the weak correlation of heteroskedastic models.
5.2.2 MDGP clustering using MQG features
Additionally, we evaluate the MQG feature set (vector of 21 MNet features) in a case study regarding time series clustering. For this task, we rescale the intended topological feature vector into the [0, 1] interval using Min-Max normalization, the PCs are computed (no need of z-score normalization within PCA), and a clustering algorithm, k-means, is applied to the PC’s corresponding to 100% of variance. The clustering results are assessed using appropriate evaluation metrics: Average Silhouette (AS); Adjusted Rand Index (ARI) and Normalized Mutual Information (NMI). Note that AS does not need ground truth, while ARI and NMI do. The range of values for NMI is [0, 1] and for ARI and AS is [-1, 1].
We start by analyzing the usefulness of the MQG feature set by performing a clustering exercise considering different subsets of the MQG feature set. The results are summarized in Table 2 (columns 2, 4, and 6) and indicate that inter-layer edges contain additional information about the MTS data, leading to better clustering results (together with the intra-layer edges). We can also analyze that relational features achieve good clustering results when considered alone. Sub-graphs with both intra-layer edges and inter-layer edges add information that leads to improvements in the clustering results (compare the last three rows with the first two of columns 2, 4, and 6 of Table 2). The results show that the contemporaneous quantile graphs (the inter-layer edges from MQG) capture different properties from MTS. Note that the results from the set of intra-layer features are good because the MDGP under analysis involves the same statistical process for the two components of time series whose properties inherent to each process are also captured by the QG mapping methods (as we see in [19]).
We also compare the results obtained using the MQG feature set with the results obtained in [20], that is, using the same feature set but for the MHVG mapping method. The columns 3, 5 and 7 of Table 2 summarizes the clustering results obtained in [20]. The two experiments are made in the same computational environment and using the same methods. We can conclude that features from MQGs are more accurate, almost perfect when we look at the evaluation features ARI and NMI, with a mean value of 0.96, and AS with 0.53, when compared to cross-visibility based mapping that obtains 0.63 to ARI, 0.71 to NMI, and 0.45 to AS feature. So, for the MDGP used in this work, the MQG can be sufficient to cluster the different MTS model samples.
5.3 Real data set: classification using MQG features
To conclude our analysis and demonstrate the applicability and practicality of the proposed method, in this section, we present an application in a multivariate time series classification task (supervised learning). We performed this mining task on real-world and benchmark datasets. We selected 19 datasets from the UEA multivariate time series classification archive [1], and these datasets have the same length and have no missing values. Table 3 summarizes the general description of each MTS dataset, including dataset size, time series length, number of dimensions/components UTS, number of classes, and the dataset type. The datasets are diverse and exhibit a variety in terms of dimensionality. The dataset size (including both train and test sets) varies between 27 and 10992, time series length \(T \in [8, 2500]\), the number of UTS components by instance MTS \(m \in [2, 28]\), and the number of classes ranging from 2 to 26.
Following the implementation details described in Sect. 5.1, for each dataset and each instance of the dataset, we create the corresponding MQG and extract the associated topological features. The resulting feature vectors were used to perform the classification task for each different dataset. The datasets have associated a training set and a testing set (see columns 2 and 3 of Table 3). We used the training set with the corresponding MQG feature vectors and the associated ground-truth classes to train the prediction model (i.e., supervised learning), and we used the testing set with the corresponding MQG feature vectors to make predictions of the classes of this testing set. For consistency, we also performed this classification analysis in MDGP, where we split the dataset into the training set using 80% of the dataset size and the testing set using 20% (see last row of Table 3).
We use the random forest ensemble learning method to conduct the training and prediction processes for each dataset. The experiments were performed in R software using the caret package. Results were evaluated using the widely accepted accuracy metric, which computes the ratio of correct predictions to the total number of predictions.
Table 4 presents the accuracy results obtained from the classification analysis carried out for each of the benchmark datasets. The results reflect the different experiments using the proposed feature vectors extracted from MQGs. In general, the most favorable results were achieved when using the entire set of topological features of MQGs, combining all feature subsets. The results indicate that different sets of features capture different data properties, with certain feature sets being more favorable for certain datasets. An interesting task for future work is to add feature selection methods to capture the most representative features of each dataset.
For some datasets the results were good. The characteristics of the dimensions (dataset size, time series length, number of dimensions, or number of classes) of the datasets do not seem to influence these results, except for Handwriting which has a testing set larger than the training set and the number of different classes is also large. However, in general, we consider these results to be very good and promising given the global nature of the features used and, also that we did not use more advanced techniques such as the selection of more representative features and other pre-processing mining techniques, which could improve the results.
6 Conclusion
Methods for mapping multivariate time series into multilayer networks have attracted the attention of researchers in recent times due to their potential. Special interest lies in mappings that generate inter-layer edges thus allowing to capture not only the time dependencies, but also the dependencies between different variables.
In this work, we introduce a multilayer quantile graph as a new multivariate time series mapping method. MQG is based on a transition probability concept extending the traditional concept of quantile graph [8] for the univariate time series data. The procedure consists of two steps. First, create a reduced multilayer network structure that represents a high-dimensional MTS following the QG mapping method available in the literature. The resulting set of layers/graphs characterizes the serial dynamic transitions of each of the time series components. Second, for each pair of time series components in the MTS, introduce weighted inter-layer edges between corresponding layers that capture the contemporaneous (and lagged) dynamic transitions between the different time series dimensions. MQG was designed to reduce the dimensionality of time series data with high dimensionality and be more computationally efficient and feasible than recently proposed mapping methods. The resulting multilayer networks have smaller dimensions than those obtained by other mapping methods such as the MHVG, and allow the effective reduction in the dimensionality of the MTS. To analyze the proposed multivariate time series mapping, MQG, we consider the specific set of multidimensional topological features proposed by [20] for MQGs. These features are based on conventional concepts of node centrality, graph distances, clustering, communities, and similarity measures, and are extracted from all the subgraphs of the resulting multilayer network, that is, intra-layer graphs, inter-layer graphs, and all-layer graphs.
To assess the proposed methodology we use the set of MTS models presented in [20]. The data set consists of 600 synthetic bivariate time series grouped into six different multivariate statistical models. We map the MTS into the MQG and compute the corresponding topological features. The analysis of the set of topological features on the feature space provided by the two principal components shows that different topological features (based on different concepts and different subgraphs of the multilayer network) capture different dynamic properties of the time series models. Furthermore, comparing the feature spaces obtained from MHVG (see [20]) and from MQG, we can say that the latter enhances the capture of cross-correlation properties.
Finally, we performed a clustering analysis of the synthetic time series based on topological features obtained from MQG and MHVG. The results show that despite the dimensionality reduction, the MQG mapping is sufficient to distinguish the characteristics inherent to each statistical model analyzed in this work and that the inter-layer edges add valuable information to intra-layer features, improving the accuracy of results.
To obtain additional results and demonstrate the application of the proposed mapping method, we perform an experimental analysis of a classification problem in several real and benchmark datasets. For each dataset, we mapped the MTS data instances into the corresponding MQG and we extracted the topological feature vectors. The resulting topological features are used to train a prediction model to perform the prediction of classes of the MTS data. Although the results are not optimal for all data sets, we consider the results to be good given the purpose of this paper. For future work, we intend to improve the classification results obtained, adopting advanced feature selection and data pre-processing techniques. Furthermore, we intend to explore the combination of MQG features with MHVG features.
To conclude, the proposed MQG reduces the dimensionality of the original time series data, reducing the amount of data observations to a smaller number of sample quantiles, preserving the dynamic characteristics of the time series (serially) and between time series (crossly), using probability transitions, during the mapping process. The objectives inherent to the design of this mapping method are quite relevant at a multidisciplinary level where the capabilities of the resulting networks are promising. The MQG algorithm presented in this work represents interconnections (cross-transitions) contemporaneously. However, following the idea presented in [7], the MQG algorithm can be extended to represent transitions between quantiles corresponding to lagged timestamps from different layers, expanding its capabilities beyond consecutive quantiles. This version may enrich the obtained results, just as in the univariate case [7]. In our future work, we intend to explore this MQG algorithm version and a more detailed analysis in real-world scenarios.
Data availability
The raw data are available at https://github.com/vanessa-silva/MHVG2MTS.
Notes
Recalling the definition of MNet in Sect. 2.2, a single-layer network, G, is an MNet with \(m=1.\)
A self-loop is an edge that connects a node to itself.
An isolated node is a node that is not connected by an edge to any other node.
MDGP is available at https://github.com/vanessa-silva/MHVG2MTS
References
Bagnall, A.J., Dau, H.A., Lines, J., Flynn, M., Large, J., Bostrom, A., Southam, P., Keogh, E.J.: The UEA multivariate time series classification archive, (2018). CoRR, arXiv:1811.00075
Barabási, A.-L.: Network Science. Cambridge University Press, Cambridge, United Kingdom (2016)
Blondel, V.D., Guillaume, J.-L., Lambiotte, R., Lefebvre, E.: Fast unfolding of communities in large networks. J. Stat. Mech: Theory Exp. 2008(10), P10008 (2008)
Boccaletti, S., Bianconi, G., Criado, R., Del Genio, C.I., Gómez-Gardenes, J., Romance, M., Sendina-Nadal, I., Wang, Z., Zanin, M.: The structure and dynamics of multilayer networks. Phys. Rep. 544(1), 1–122 (2014)
Campanharo, A., Ramos, F.: Distinguishing different dynamics in electroencephalographic time series through a complex network approach. In: Proceeding Series of the Brazilian Society of Computational and Applied Mathematics, 5(1), (2017)
Campanharo, A.S., Doescher, E., Ramos, F.M.: Application of quantile graphs to the automated analysis of EEG signals. Neural Process. Lett. 52, 5–20 (2018)
Campanharo, A.S., Ramos, F.M.: Hurst exponent estimation of self-affine time series using quantile graphs. Phys. A 444, 43–48 (2016)
Campanharo, A.S., Sirer, M.I., Malmgren, R.D., Ramos, F.M., Amaral, L.A.N.: Duality between time series and networks. PLoS One 6(8), e23378 (2011)
Costa, L.D.F., Rodrigues, F.A., Travieso, G., Villas Boas, P.R.: Characterization of complex networks: A survey of measurements. Adv. Phys. 56(1), 167–242 (2007)
de Oliveira Campanharo, A.S.L., Ramos, F.M.: Quantile graphs for the characterization of chaotic dynamics in time series. In: Complex Systems (WCCS), 2015 Third World Conference on, pages 1–4. IEEE (2015)
Douc, R., Moulines, E., Stoffer, D.: Nonlinear Time Series: Theory, 1st edn. Methods and Applications with R Examples. Chapman and Hall/CRC, (2014)
Eroglu, D., Marwan, N., Stebich, M., Kurths, J.: Multiplex recurrence networks. Phys. Rev. E 97(1), 012312 (2018)
Henderson, T., Fulcher, B.D.: An empirical evaluation of time-series feature sets (2021)
Kivelä, M., Arenas, A., Barthelemy, M., Gleeson, J.P., Moreno, Y., Porter, M.A.: Multilayer networks. J. Complex Netw. 2(3), 203–271 (2014)
Lacasa, L., Nicosia, V., Latora, V.: Network structure of multivariate time series. Sci. Rep. 5(1), 15508 (2015)
Peach, R.L., Arnaudon, A., Schmidt, J.A., Palasciano, H.A., Bernier, N.R., Jelfs, K.E., Yaliraki, S.N., Barahona, M.: HCGA: Highly comparative graph analysis for network phenotyping. Patterns 2(4), 100227 (2021)
Shumway, R.H., Stoffer, D.S.: Time Series Analysis and its Applications: with R examples. 1431-875X. Springer, New York, United States, 4 edition (2017)
Silva, V.F., Silva, M.E., Ribeiro, P., Silva, F.: Time series analysis via network science: Concepts and algorithms. WIREs Data Min. Knowl. Discovery 11(3), e1404 (2021)
Silva, V.F., Silva, M.E., Ribeiro, P., Silva, F.: Novel features for time series analysis: a complex networks approach. Data Min. Knowl. Disc. 36, 1062–1101 (2022)
Silva, V.F., Silva, M.E., Ribeiro, P., Silva, F.: MHVG2MTS: Multilayer horizontal visibility graphs for multivariate time series analysis. (2023) arXiv preprint arXiv:2301.02333
Wang, X., Smith, K., Hyndman, R.J.: Characteristic-based clustering for time series data. Data Min. Knowl. Disc. 13(3), 335–364 (2006)
Wei, W.W.: Multivariate Time Series Analysis and Applications. John Wiley & Sons, Hoboken, New Jersey (2019)
Zou, Y., Donner, R.V., Marwan, N., Donges, J.F., Kurths, J.: Complex network approaches to nonlinear time series analysis. Phys. Rep. 787, 1–97 (2019)
Acknowledgements
This work is financed by National Funds through the Portuguese funding agency, FCT—Fundação para a Ciência e a Tecnologia, within project LA/P/0063/2020.
Funding
Open access funding provided by FCT|FCCN (b-on). Not applicable.
Author information
Authors and Affiliations
Contributions
The authors contributed equally to this work.
Corresponding author
Ethics declarations
Conflict of interest
The authors declare that they have no conflict of interest.
Additional information
Publisher's Note
Springer Nature remains neutral with regard to jurisdictional claims in published maps and institutional affiliations.
Rights and permissions
Open Access This article is licensed under a Creative Commons Attribution 4.0 International License, which permits use, sharing, adaptation, distribution and reproduction in any medium or format, as long as you give appropriate credit to the original author(s) and the source, provide a link to the Creative Commons licence, and indicate if changes were made. The images or other third party material in this article are included in the article’s Creative Commons licence, unless indicated otherwise in a credit line to the material. If material is not included in the article’s Creative Commons licence and your intended use is not permitted by statutory regulation or exceeds the permitted use, you will need to obtain permission directly from the copyright holder. To view a copy of this licence, visit http://creativecommons.org/licenses/by/4.0/.
About this article

Cite this article
Silva, V.F., Silva, M.E., Ribeiro, P. et al. Multilayer quantile graph for multivariate time series analysis and dimensionality reduction. Int J Data Sci Anal (2024). https://doi.org/10.1007/s41060-024-00561-6
Received:
Accepted:
Published:
DOI: https://doi.org/10.1007/s41060-024-00561-6