
Abstract
Cryo-electron tomography is an emerging electron microscopy technique for determining three-dimensional structures of cellular architectures near their native state at nanometer resolution, with a shortcoming of lack of specific labels. Fluorescence light microscopy, on the other hand, specifically visualizes target cellular and molecular components with fluorescent labels, but is limited to a resolution of tens to hundreds nanometers. Combining the advantages of the two techniques, we have developed a cryo-correlative light and electron microscopy system. Our system consists a custom-designed cryo-chamber that allows for fluorescence imaging of frozen-hydrated samples, and an algorithm to achieve accurate correlation. With this system and our optimized protocol, high-quality tomograms of neuronal synapses labelled by specific fluorescent tags in cultured hippocampal neurons are obtained at high efficiency.
Introduction
Microscopic imaging techniques are essential research tools to delineate structural and molecular information in biological systems. The use of fluorescence light microscopy (FLM) in the past decades has yielded a wealth of knowledge of cellular structures and functions (Giepmans et al. 2006; Lichtman and Conchello 2005). However, light microscopy (LM) is generally used for studying cellular structures of hundreds nanometers or larger in size due to resolution limitations. For studying finer structures such as vesicles inside neuronal synapses, electron microscopy (EM) has been the primary tool. In particular, the recent advent of cryo-electron tomography (cryo-ET) technique achieves nanometer resolution and is ideally suited for the study of three-dimensional (3D) details of native cellular architectures (Baumeister 2002; Frank 2005; Hoenger and McIntosh 2009; Tao et al. 2018). Nevertheless, the lack of efficient ways for cryo-ET to specifically label cellular targets or proteins makes it challenging to identify specific types of cells and subcellular structures. Correlative light and electron microscopy (CLEM) has been developed to combine the advantages of both FLM and EM techniques (de Boer et al. 2015; Grabenbauer et al. 2005; Kukulski et al. 2012; Sartori et al. 2007; Sun et al. 2018). With such correlative methods, specific structural features or cellular components can be localized by FLM and then examined by EM to reveal high-resolution details in the same sample.
Cryo-correlative light and electron microscopy (cryo-CLEM) (Chang et al. 2014; Hampton et al. 2017; Li et al. 2018a, b; Lucic et al. 2007; Tao et al. 2018), which utilizes cryo-fluorescence light microscopy (cryo-FLM) and cryo-ET to examine vitrified samples, promises better sample preservation and high resolution compared to conventional CLEM methods. Successful implementation of a cryo-CLEM method requires a series of steps, including proper subcellular labeling, frozen-hydrated sample handling, cryo-FLM/cryo-ET imaging, and image correlation. In this paper, we describe an efficient cryo-CLEM system and its use for the study of synapses with fluorescent label in cultured hippocampal neurons. The hardware design of our system includes a cryo-chamber that was built to fit on an inverted light microscope and to maintain a low temperature (around −192 °C) inside by continuous liquid nitrogen cooling. An EM cryo-holder can directly fit into the cryo-chamber through a side-port to position the EM grid above the objective lens of the light microscope. This design allows the EM cryo-holder to be shuttled between light and electron microscopes without repeated sample transfer, thus minimizing ice crystal contamination and grid damage.
For correlation between fluorescence and EM images, most existing cryo-CLEM methods rely on the use of fluorescent beads (100–200 nm) as fiducial markers (Liu et al. 2015; Schorb and Briggs 2014), which may involve complicated procedures such as correction for chromatic aberration (Schorb and Briggs 2014). It is also practically challenging to obtain appropriate distribution of beads on the specific grid areas where sample targets are located. To overcome this problem, we have developed a new geometry-based method for refined correlation. This method uses the patterned carbon holes on Quantifoil EM grids that can be visualized by both bright-field LM and EM as fiducial markers. Based on these carbon holes, accurate correlation between light and electron microscopy was obtained using a custom-developed program. The overall workflow of our cryo-CLEM protocol is summarized in Fig. 1. Using this correlative system, we have identified and characterized the ultrastructural features of excitatory synapses of cultured hippocampal neurons in their native states (Tao et al. 2018).

Flowchart of the cryo-correlative light and electron microscopy
Summarized Procedure
-
(1)
Culture dissociated embryonic rat hippocampal neurons on poly-lysine-coated gold EM finder grids in 35-mm Petri dishes, following a previously described protocol (Tao et al. 2018).
-
(2)
Transfect the cultures with lentivirus encoding PSD95-EGFP constructs for 5–7 days in vitro (DIV).
-
(3)
Plunge freeze the cultures on EM grids at DIV 16 and store the samples in liquid nitrogen until use.
-
(4)
Set up the cryo-light microscope system. Load the EM grid with frozen-hydrated sample onto the Gatan EM cryo-holder, and subsequently insert the cryo-holder into the pre-cooled cryo-chamber.
-
(5)
For each field of view which covers the whole square of interest and its indexes, collect one fluorescent image in EGFP channel, and one bright-field image in the EGFP channel.
-
(6)
Immediately after the LM imaging, directly transfer the EM cryo-holder into a Thermo Fisher FEI Tecnai F20 scope.
-
(7)
In low magnification mode, identify the target grid squares of the sample imaged in the cryo-light microscope by using the indexes of the finder grids. Collect the low magnification EM images of the target gird squares at the magnification of 330×.
-
(8)
Roughly align the low magnification EM image with LM images using Midas program in IMOD package (Kremer et al. 1996).
-
(9)
After rough alignment, pick a set of corresponding holes located on the carbon layer of the grid from both the low magnification EM image and the bright-field LM image using 3dmod in IMOD package. Use these corresponding holes as fiducial markers for fine alignment.
-
(10)
Align the fine aligned LM/EM images to the EM scope mechanical coordinates at 5000× magnification. Convert positions of selected target fluorescent puncta into corresponding EM mechanical coordinates, generating a coordinate file named as “synapse.st2” using a customized software.
-
(11)
Load the file “synapse.st2” into Tecnai User Interface (TUI) software. Collect tilt series on areas with selected fluorescent signals using Thermo Fisher FEI batch tomography software. Align and reconstruct the tilt series using IMOD.
-
(12)
Align the high resolution tomographic slices with the fluorescent images to identify each synapse.
Materials
All animal experiments were approved and conducted according to protocols approved by the Animal Experiments Committee at the University of Science and Technology of China.
Reagents
For primary culture of hippocampal neurons
-
Poly-l-lysine (PLL) (Sigma-Aldrich)
-
Hank’s balanced salt solution (HBSS) (Sigma)
-
Culture water (Sigma)
-
NeuroBasal (NB) medium (Invitrogen)
-
Glutamax (100×) (Invitrogen)
-
B27 (50×) (Invitrogen NALGENE)
-
Fetal bovine serum (FBS) (Hyclone)
-
Bovine calf serum (BCS) (PAA Laboratories)
-
Sodium chloride solution
-
Cytarabine (Ara-C) (Sigma)
-
Trypsin (Sigma)
For plunge-freezing and cryo-CLEM
-
NaCl
-
KCl
-
CaCl2
-
MgCl2
-
HEPES
-
d-glucose
-
Protein A-coated colloidal gold beads (CMC, 15-nm size)
-
Liquid nitrogen
-
Ethane
Equipment
-
Cover glass (Deckglaser, 12 mm)
-
35 mm × 10 mm Petri dish (Corning)
-
Mammalian CO2-charged cell culture incubator (Thermo Scientific, forma 371)
-
Biosafety cabinet (Thermo Scientific, 1300 series class II)
-
Invert light microscope for cell culture (Zeiss, Primovert)
-
Stereoscope (Zeiss, stemi 508)
-
Forceps
-
Gold finder grids (Quantifoil, Au NH2 R2/2 100 mesh)
-
2.5-, 10-, 20-, 200-, 1000-μL pipettes (Eppendorf Research)
-
Pipette tips (KIRGEN)
-
0.65-mL microcentrifuge tubes (Corning)
-
50-mL centrifuge tubes (Corning)
-
Filter paper circles (Whatman)
-
Centrifuge (Eppendorf, 5804R)
-
Plasma cleaner (Gatan, solarus model 950)
-
Plunge freezer (Thermo Fisher, Vitrobot Mark IV)
-
Liquid nitrogen Dewar (Thermo scientific, Biocane 34)
-
High-tilt cryo-specimen holder and holder transfer system (Gatan, model 626)
-
Turbo pumping station (Gatan, model 655) and SmartSet cold stage controller (Gatan, model 900)
-
Cryo-grid storage boxes (Tedpella)
-
200 kV transmission electron microscope (Thermo Fisher, Tecnai F20) equipped with 4 k × 4 k CCD camera (Thermo Fisher, Eagle)
-
Computer (Linux system or Window system with Cygwin installed) with 16 GB or more RAM, 1 T or more storage space, and 2 GTX Geforce 1080Ti graphic cards
-
Cryo-light microscope system (Fig. 2): ① Cryo-chamber (home-built); ② EM cryo-holder (Gatan, Model 626); ③ Halogen lamp; ④ Hg lamp; ⑤ sCMOS camera (Andor, NEO); ⑥ LN2 inflow; ⑦ LN2; ⑧ High-pressure nitrogen gas; ⑨ LN2 overflow; ⑩ N2 inflow;
 LN2;
LN2;
 High-pressure nitrogen gas;
 Temperature monitor;
 Objective lens (Olympus, LUCPLFLN 40× air objective, N.A. = 0.6);
 Inverted light microscopy (Olympus, IX71)
Fig. 2 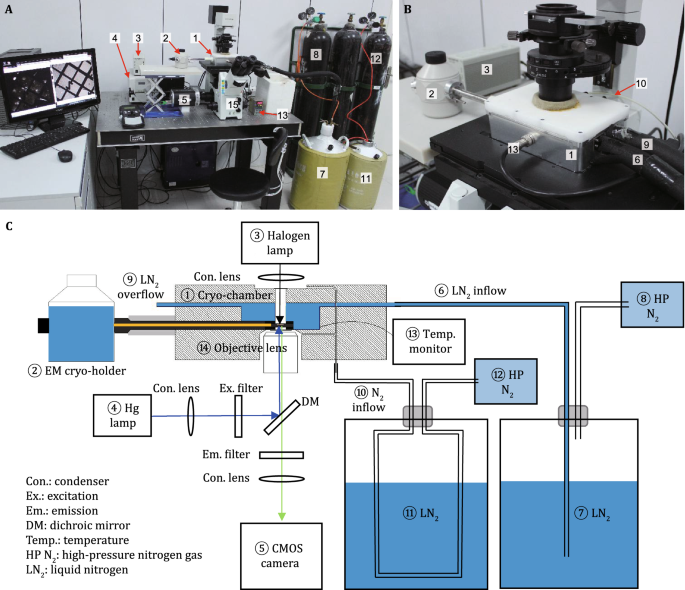
Cryo correlative light and electron microscopy. A, B Home-built cryo-chamber mounted on Olympus IX71 for cryo-light microscopy. C Illustration of the cryo-light microscope design. ① Cryo-chamber; ② EM cryo-holder; ③ Halogen lamp; ④ Hg lamp; ⑤ CMOS camera; ⑥ LN2 inflow; ⑦ LN2; ⑧ High-pressure nitrogen gas; ⑨ LN2 overflow; ⑩ N2 inflow;
 LN2;
LN2;
 High-pressure nitrogen gas;
 Temperature monitor;
 Objective lens;
 Inverted light microscopy. C is adapted from Fig. 1C in Tao et al. (2018)
 LN2;
LN2;
 High-pressure nitrogen gas;
 Temperature monitor;
 Objective lens (Olympus, LUCPLFLN 40× air objective, N.A. = 0.6);
 Inverted light microscopy (Olympus, IX71)
 LN2;
LN2;
 High-pressure nitrogen gas;
 Temperature monitor;
 Objective lens;
 Inverted light microscopy. C is adapted from Fig.
 Software
-
ImageJ/Micro-manager (Edelstein et al. 2014)
-
IMOD (Kremer et al. 1996)
-
Thermo Fisher TEM user interface (TUI), TEM imaging and analysis (TIA), and Xplore 3D
-
Custom developed CLEM programs. These programs are provided at https://github.com/procyontao/clem
Reagent setup
-
NB medium with B27 supplement (NB27 medium, 100 mL): 96 mL NeuroBasal medium, 1 mL Glutamax, 2 mL B27, and 1 mL NaCl
-
NB27 medium with serum supplement (100 mL): 5 mL BCS and 5 mL FBS (heat-inactivated at 56 °C for 30 min), and 90 mL NB27 medium.
-
Extracellular solution (ECS): 150 mmol/L NaCl, 3 mmol/L KCl, 3 mmol/L CaCl2, 2 mmol/L MgCl2, 10 mmol/L HEPES and 5 mmol/L glucose, pH 7.3, osmotic pressure 290 mOsm/kg
-
Gold beads solution: Mix 10 µL 15-nm Protein A-coated colloidal gold beads stock solution with 600 µL ECS. Centrifuge the mixture at a speed of 14,000 r/min (20,817 g) for 15 min. Discard the supernate and dilute the precipitate in 90 µL ECS
Procedure
Primary culture of hippocampal neurons and lentivirus transfection [TIMING] 18 days
-
(1)
Glow-discharge the gold finder EM grids with H2 and O2 for 10 s using plasma cleaner. Sterilize the grids with UV light for 30 min using a biosafety cabinet.
-
(2)
Coat the grids with 1 mg/mL PLL in sodium borate buffer in the 35-mm Petri dishes for 12 h.
-
(3)
Discard PLL solution and wash the grids with HBSS for 12 h. Discard HBSS and wash the grids with ddH2O for 12 h.
[CRITICAL STEP] Do not use grids with broken carbon films, on which cultured neurons are unable to grow well.
[? TROUBLESHOOTING]
-
(4)
Remove hippocampi from embryonic day-18 (E18) rats under the stereoscope and treat them with trypsin for 15 min at 37 °C, followed by washing and gentle trituration.
-
(5)
Plate the dissociated cells on the PLL coated grids in 35-mm Petri dishes with NB27 medium with serum (Fig. 3). The cell density is 40,000–60,000 cells/mL. Place the 35-mm Petri dishes with cultures in the incubator at 37 °C with 5% CO2.
Fig. 3 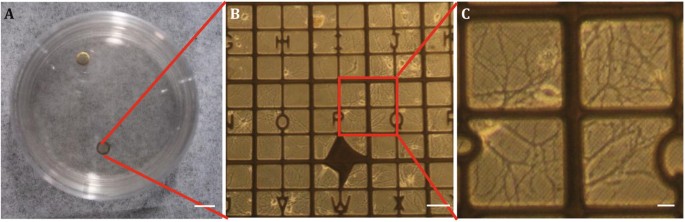
Cultured hippocampal neurons on EM finder grid. Scale bars, 5 mm (A), 100 μm (B), 20 μm (C)
-
(6)
Replace half of the culture medium with NB27 medium in 24 h after plating, and place the 35-mm Petri dishes with cultures back in the incubator.
-
(7)
Replace one-third of the culture medium with fresh NB27 medium twice a week. Treat the cultures with Ara-C at various stages depending on the density of glia cells in order to prevent their overgrowth.
-
(8)
Transfect the cultures with lentivirus encoding PSD95-EGFP constructs for DIV 5–7. Replace half of the culture medium by fresh NB27 medium in 24 h after infection. Keep the culture dishes in the incubator until use.
[CRITICAL STEP] Cell density is the key to the sample thickness after plunge freezing. Check the grids before plunge freezing to make sure it is appropriate for cryo-ET imaging.

Frozen-hydrated sample preparation [TIMING] 1 h
-
(9)
Take the culture dish from the incubator at DIV 16. Replace the culture medium with ECS.
-
(10)
Switch on the power of the plunge freezer. Inject deionized water into the humidifier of the plunge freezer.
-
(11)
Set the parameters of the plunge freezer as follows: humidity 100%, temperature 22 °C, blot time 3.5 s, blot total 1, blot force 2, and wait time 3 s.
[CRITICAL STEP] The parameters of the plunge freezer may vary in different environment. It is recommended to try freezing the sample with different parameters to find out best ones in your laboratory.
-
(12)
Set up the coolant container. Fill the ethane cup with liquid ethane cooling by liquid nitrogen in the coolant container.
[CAUTION] Liquid nitrogen and liquid ethane are cryogens. Handle them with necessary personal protective equipment.
-
(13)
Load the filter paper on each blotter pad of the plunge freezer. Open the humidifier to fill the chamber with water vapor.
-
(14)
Mount the grids with cultures on the plunge freezer. Add 4 μL gold beads solution to each grid. Plunge the grids into liquid ethane for rapid vitrification, and store them in the liquid nitrogen Dewar until use.
Cryo-light microscopy imaging [TIMING] 0.5–2 h
-
(15)
Set up the cryo-light microscope system (Fig. 2). Mount the home-built cryo-chamber① on the Olympus IX71 inverted fluorescence microscope
 . Connect the liquid nitrogen⑦ to the cryo-chamber as LN2 inflow⑥. Connect the outlet for liquid nitrogen⑨ in the cryo-chamber to an open vessel. Connect high-pressure nitrogen gas
 cooling by LN2
 to the cryo-chamber as N2 inflow⑩. Connect the cryo-chamber with a temperature monitor
 to monitor the temperature inside cryo-chamber.
 -
(16)
Pre-dry the inside of the cryo-chamber by dry nitrogen gas for 5 min, then insert a plug to seal the chamber. Then, let high-pressure nitrogen gas
 flow between the objective lens
 and a coverslip in the bright field light path during the experiment to prevent frost accumulation. After 2 min, precool the inside of the cryo-chamber to −192 °C by liquid nitrogen⑦, as monitored by the temperature monitor
 .
. -
(17)
Load the EM grid with frozen-hydrated sample onto the Gatan EM cryo-holder②, and subsequently insert the cryo-holder into the cryo-chamber. After 5 min for system stabilization, turn on the halogen lamp③ and Hg lamp④ of the microscope and start cryo-LM imaging.
-
(18)
For each field of view which covers the whole square of interest and its indexes, collect one fluorescent image in EGFP channel (exciter: 470/40; dichroic mirror: 495; emitter: 525/50), and one bright-field image in the EGFP channel (light source: halogen lamp; dichroic mirror: 495). Compared to a conventional bright-field image in the bright-field channel, the bright-field image acquired in the EGFP channel avoids the image shift with the fluorescent image due to chromatic aberration and save both images in TIFF format (Fig. 4A, B). Select multiple areas on the EM grid and collect FLM images successively.
Fig. 4 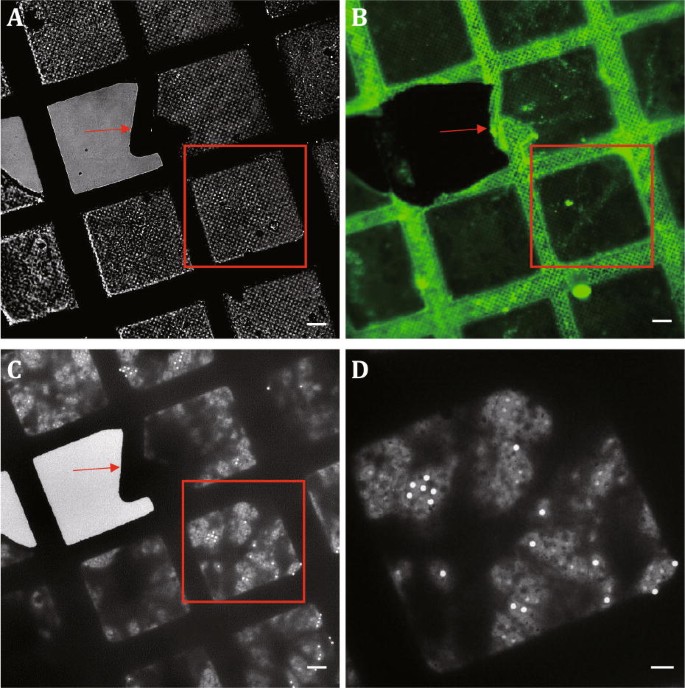
Light microscopy image and low magnification EM image of cultured neurons at cryogenic state. A Bight-field image of EGFP labelled PSD95 of neuronal cells on EM grids. B Fluorescent image of EGFP labelled PSD95 of neuronal cells on EM grids. C Low magnification EM image of neuronal cells on EM grids. Arrows indicate the same index “4” in A–C. Boxed areas in A–C indicate the same area of interest on the grid. D Square of interest which is the boxed area in C. Scale bars, 20 μm (A), 20 μm (B), 20 μm (C), 10 μm (D)
[CRITICAL STEP] The correlation accuracy is highly dependent on the quality of the cryo-FLM images. We generally selected areas with well-separated fluorescent puncta, and also with more than ten easily visualized carbon holes per square.
[? TROUBLESHOOTING]
 . Connect the liquid nitrogen⑦ to the cryo-chamber as LN2 inflow⑥. Connect the outlet for liquid nitrogen⑨ in the cryo-chamber to an open vessel. Connect high-pressure nitrogen gas
 cooling by LN2
 to the cryo-chamber as N2 inflow⑩. Connect the cryo-chamber with a temperature monitor
 to monitor the temperature inside cryo-chamber.
 flow between the objective lens
 and a coverslip in the bright field light path during the experiment to prevent frost accumulation. After 2 min, precool the inside of the cryo-chamber to −192 °C by liquid nitrogen⑦, as monitored by the temperature monitor
 .
.
Correlative cryo-electron microscopy imaging [TIMING] 2–24 h
-
(19)
Immediately after the LM imaging, directly transfer the EM cryo-holder into an Tecnai F20 scope. In low magnification mode, identify the target grid squares of the sample imaged in the cryo-light microscope by using the indexes of the finder grids (e.g., index “4” in Fig. 4A–C). Collect the low magnification EM images of the target gird squares at the magnification of 330× to cover at least one whole grid square in the image and save low magnification EM images in TIFF format (Fig. 4D).
-
(20)
Roughly align the low magnification EM image with LM images using Midas program in IMOD package as follows: put the low magnification EM image (e.g., 1.1.tif), the bright-field LM image (e.g., 1.2.tif), and the FLM image (e.g., 1.3.tif) of the same square area in the same folder. Open a command terminal and run following command to convert the images to one MRC stack file:
“>$ tif2mrc –g *.tif 1.mrc”.
Then open the MRC file (1.mrc) with Midas software:
“>$ midas 1.mrc”.
In the Midas software, manually align the bright-field LM image to the low magnification EM image by flipping, rotation, translation and scaling (Fig. 5). Click “File” → “Save transforms as…” to save the file as “1.xg”. Edit the file “1.xg” with a text editor (e.g., Gedit or Vim) to copy the values in the second line to the third line, and save the file. This text edition in “1.xg” makes the same transform of FLM image with bright-field LM image. And then, generate the roughly aligned image stack (2.mrc) with the following command:
Fig. 5 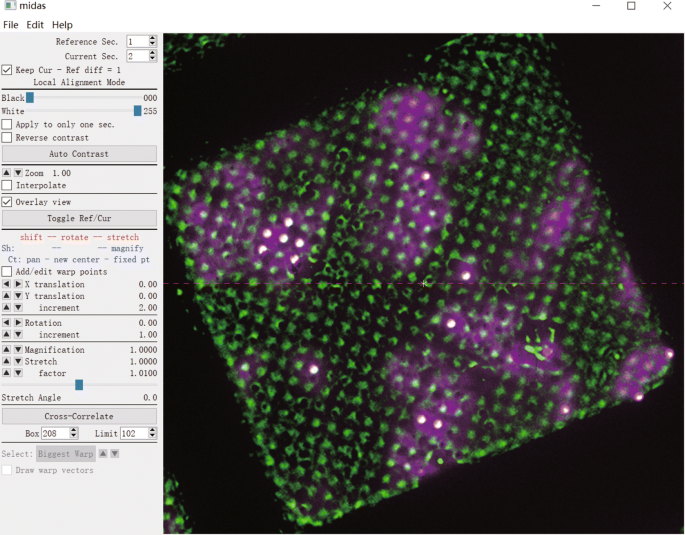
Roughly align the bright-field LM image with the low magnification EM image in the Midas software
“>$ newstack –xform 1.xg 1.mrc 2.mrc”.
[? TROUBLESHOOTING]
-
(21)
After rough alignment, pick a set of corresponding holes located on the carbon layer of the grid from both the low magnification EM image and the bright-field LM image using 3dmod in IMOD package. These corresponding holes are used as fiducial markers for fine alignment. Open 2.mrc in 3dmod and select “Model” in the “mode” column, then click “Edit” → “Object” → “Type…”. In the pop-up window, select “circle” in the “Symbols” column in order to pick carbon holes by circle symbols. Adjust the size of a circle to fit a carbon hole by changing “Size” value in the “Symbols” column (Fig. 6A). Then click mouse middle button to insert a couple of circles to select carbon holes on the low magnification EM image (Fig. 6B). Next, add a new object by clicking “Edit” → “Object” → “New”, and select the corresponding carbon holes on the bright-field LM image in the same way as do on the low magnification EM image. After selecting the corresponding holes on both EM and bright-field LM images, save the model as “1.mod”. Then generate finely aligned image stack (3.mrc) with the following command:
Fig. 6 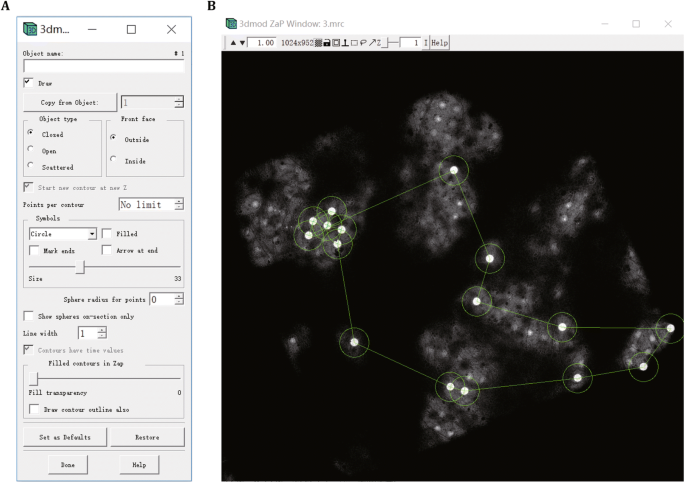
Picking carbon holes as fiducial markers for optimal alignment using 3dmod. A Object type configuration. B Carbon holes picking on the carbon layer of the grid
“>$ clem 2.mrc 1.mod 3.mrc 3”.
LM images are transformed to optimally align with the low magnification EM image according to the coordinates of carbon holes in 1.mod file (Fig. 7).
Fig. 7 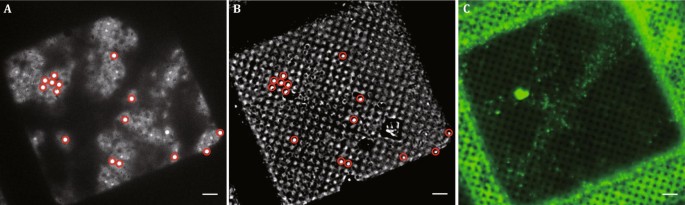
Fine aligned low magnification EM image (A), bright-field LM image (B), and FLM image (C). Bright-field LM image has been transformed to optimally align with the low magnification EM image (A) according to the corresponding carbon holes (circles in A and B). The same transformation has been applied to the FLM image (C). Scale bars, 10 μm
[CRITICAL STEP] Always select the holes which are evenly distributed in the square so that the alignment would be relatively accurate in the whole square.
-
(22)
Open 3.mrc file in 3dmod. Click “Edit” → “Object” → “New” in the pop-up window, and select “scattered” in the “Object”-type column. Then select all the fluorescent puncta by clicking mouse middle button to insert a couple of points in the FLM image. Save model as “synapse. mod”.


-
(23)
After selecting fluorescent puncta, pick up ten holes on the carbon layer (in one square) of the low magnification EM image in the way described in Step 21. Save model as “hole.mod”. Extract the coordinates of the ten holes by the command:
“>$ model2point hole.mod hole.point”.
A file named “hole.point” is generated. Then use Oval Marker Tool to draw a carbon hole-sized perfect circle in the center of CCD search image in TUI at the magnification of 5000×. Move the stage using joystick so that the picked carbon hole is in the center of the search image. Thus the coordinate shown in TUI is just the mechanical center coordinate of the picked carbon hole. Record the “XY” EM mechanical center coordinates of the picked holes shown in TUI (Fig. 8). Open “hole.point” in a text editor. Delete all the “0” in the third column and type in the EM mechanical center coordinates of the corresponding holes. Save the file as “hole.txt”.
Fig. 8 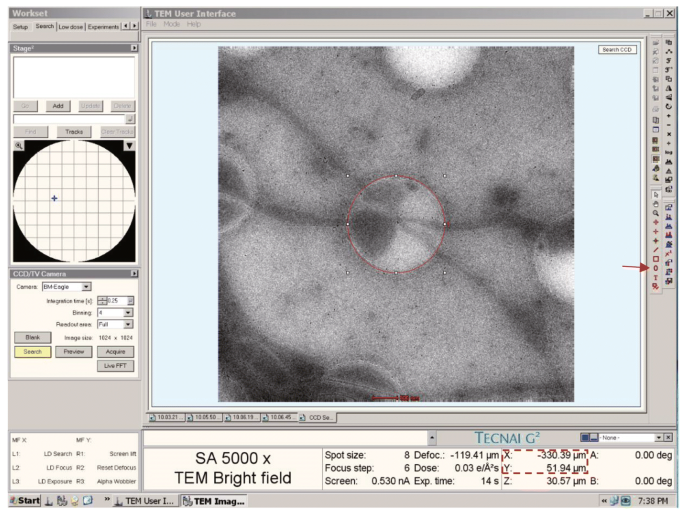
Mechanical center coordinates of holes in the boxed area are recorded by using “Oval Marker Tool” (arrow) in TUI. The red circle drawn by “Oval Marker Tool” is located in the center of CCD search image which has the same size with the carbon hole

-
(24)
Align images to the microscope mechanical coordinates. Convert positions of a couple of selected fluorescent puncta into corresponding EM mechanical coordinates by the command:
“>$ clem4 hole.txt synapse.mod Z”.
“Z” is the Z value of the microscope mechanical coordinates at euccentric focus.
Then two files named “synapse.st2” and “EM.txt” will be generated in the same folder of hole.txt.
-
(25)
Load EM mechanical coordinates of selected fluorescent puncta “synapse.st2” to Thermo Fisher TUI software and a list of coordinates of PSD95 labeled synapses will show up in the stage panel of TUI.
-
(26)
Collect tilt series on areas with selected fluorescent signals. Collect tilt series automatically with Thermo Fisher Xplore 3D software. Set up TEM batch tomography to collect data from all imported positions. The final pixel size is 1.509 nm with 14,500× magnification using the Thermo Fisher Eagle 4 k by 4 k CCD camera (binned by two during use). Acquire tilt series starting from 0° to −60°, and then from 2° to +60° with an interval of 2°, and set the defocus value at around −12 to −18 μm, with the total electron dosage of ~100 e−/Å2.
Tilt series reconstruction and high-magnification alignment [TIMING] 1–24 h
-
(27)
Align and reconstruct tilt series using IMOD. Use the 15 nm gold beads as fiducial markers to align the tilt series. Perform reconstruction using a simultaneous iterative reconstruction technique with five iterations.
-
(28)
Align the high-resolution tomographic slices with the fluorescent images to identify each synapse. Draw the contours of carbon holes on 5000× EM image and FLM image, respectively. Then convert 5000× EM image and FLM image into one MRC file and align two images by carbon holes using Midas in the same way described in Step 20. Convert one 14,500× tomographic slice with legible ultrastructure, 5000× EM image, and aligned FLM image into one MRC. Open this MRC file in Midas and align 5000× EM image and FLM image with 14,500× tomographic slice by the neuronal contour. Finally, merge the aligned tomographic slice and the fluorescent image by ImageJ (Fig. 9C).
Fig. 9 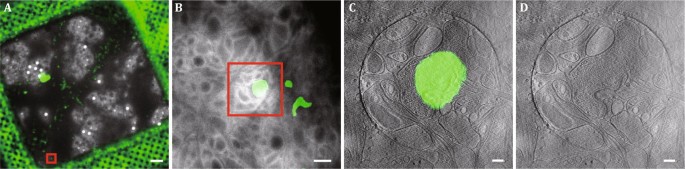
Example of imaging synapse with cryo-CLEM. A Merged low magnification (330×) cryo-EM image and aligned FLM image. B Superposed cryo-EM image (5000× magnification) and aligned FLM image. Boxed areas in A and B indicate the same PSD95-EGFP punctum. C A tomographic slice of an excitatory synapse co-localized with the PSD95-EGFP punctum. D Tomographic slice of the excitatory synapse in C. Scale bars, 10 μm (A), 1 μm (B), 200 nm (C), 200 nm (D)
[? TROUBLESHOOTING]
Troubleshooting advice can be found in Table 1.
Table 1 Troubleshooting table

Anticipated Results
This protocol describes how to perform cryo-CLEM on cultured hippocampal neurons. The acquired data successfully revealed ultrastructure of PSD95-EGFP labelled excitatory synapses. Figure 10 provides an example of visualized cryo-ET tomogram of an excitatory synapse. In the PSD95-EGFP labelled excitatory synapse (Fig. 10A, B), presynaptic and postsynaptic membrane, synaptic vesicles, postsynaptic density, endoplasmic reticulum and endosomes are segmented (Fig. 10C and supplementary movie).

Example of visualized cryo-tomogram of an excitatory synapse. A A tomographic slice of an excitatory synapse co-localized with the PSD95-EGFP punctum. B Tomographic slice of the excitatory synapse in A. Green circles: synaptic vesicles (SVs). C 3D segmented structures of the tomogram of the same synapse shown in B. Presynaptic membrane: light yellow; SVs: colored spheres; Postsynaptic membrane: cyan; Postsynaptic density (PSD): purple; Endoplasmic reticulum or endosomes: orange. Scale bars, 200 nm
Discussion
We have developed a cryo-CLEM system that was employed to examine the ultrastructure of synapses with fluorescence labelling in cultured hippocampal neurons. This method is based on a custom-designed cryo-chamber which is compatible with the commercial EM sample cryo-holder. Differing from other cryo-chambers (Jun et al. 2011; Sartori et al. 2007), the grid with frozen-hydrated sample is loaded in the Gatan EM cryo-holder for FLM imaging, eliminating potential contamination and damage when transferring the grid from LM to EM. In addition, the objective lens is outside the cryo-chamber, avoiding possible damage caused by immersion in a low temperature atmosphere. Comparing with a similar cryo-CLEM platform (Li et al. 2018a), our system is much easier to machine and with low-cost, and also the experiment time can be greatly reduced. Generally, we can finish the cryo-FLM experiment for one sample (from preparing the setup to loading the sample into EM scope) in 30–40 min.
Our approach to LM/EM alignment used the regularly fabricated holes on the carbon films of the EM grid. These holes are evenly distributed on the carbon film coated on the EM grid and can be clearly localized in both LM and EM image. Using multiple holes as fiducial markers improves the accuracy of LM/EM alignment.
As an example, we implemented the cryo-CLEM method in the study of excitatory synapses labeled with EGFP-PSD95 (Fig. 10). The same approach can also be used for ultrastructural analysis of other synapse types or functional states, as long as a fluorescent marker is available. Overall, it is a convenient, low-cost approach that can be used in the study of various cellular structures, with reasonable efficiency.
References
Baumeister W (2002) Electron tomography: towards visualizing the molecular organization of the cytoplasm. Curr Opin Struct Biol 12:679–684
Chang Y-W, Chen S, Tocheva EI, Treuner-Lange A, Loebach S, Sogaard-Andersen L, Jensen GJ (2014) Correlated cryogenic photoactivated localization microscopy and cryo-electron tomography. Nat Methods 11:737–739
de Boer P, Hoogenboom JP, Giepmans BN (2015) Correlated light and electron microscopy: ultrastructure lights up! Nat Methods 12:503–513
Edelstein AD, Tsuchida MA, Amodaj N, Pinkard H, Vale RD, Stuurman N (2014) Advanced methods of microscope control using μManager software. J Biol Methods 1(2):e10
Frank J (2005) Introduction: principles of electron tomography. In: Frank J (ed) Electron tomography. Springer, Berlin
Giepmans BNG, Adams SR, Ellisman MH, Tsien RY (2006) The fluorescent toolbox for assessing protein location and function. Science 312:217–224
Grabenbauer M, Geerts WJC, Fernadez-Rodriguez J, Hoenger A, Koster AJ, Nilsson T (2005) Correlative microscopy and electron tomography of GFP through photooxidation. Nat Methods 2:857–862
Hampton CM, Strauss JD, Ke Z, Dillard RS, Hammonds JE, Alonas E, Desai TM, Marin M, Storms RE, Leon F, Melikyan GB, Santangelo PJ, Spearman PW, Wright ER (2017) Correlated fluorescence microscopy and cryo-electron tomography of virus-infected or transfected mammalian cells. Nat Protoc 12:150–167
Hoenger A, McIntosh JR (2009) Probing the macromolecular organization of cells by electron tomography. Curr Opin Cell Biol 21:89–96
Jun S, Ke D, Debiec K, Zhao G, Meng X, Ambrose Z, Gibson GA, Watkins SC, Zhang P (2011) Direct visualization of HIV-1 with correlative live-cell microscopy and cryo-electron tomography. Structure 19:1573–1581
Kremer JR, Mastronarde DN, McIntosh JR (1996) Computer visualization of three-dimensional image data using IMOD. J Struct Biol 116:71–76
Kukulski W, Schorb M, Kaksonen M, Briggs JAG (2012) Plasma membrane reshaping during endocytosis is revealed by time-resolved electron tomography. Cell 150:508–520
Li S, Ji G, Shi Y, Klausen LH, Niu T, Wang S, Huang X, Ding W, Zhang X, Dong M, Xu W, Sun F (2018a) High-vacuum optical platform for cryo-CLEM (HOPE): a new solution for non-integrated multiscale correlative light and electron microscopy. J Struct Biol 201:63–75
Li X, Lei J, Wang H-W (2018b) The application of CorrSight™ in correlative light and electron microscopy of vitrified biological specimens. Biophys Rep 4:143–152
Lichtman JW, Conchello JA (2005) Fluorescence microscopy. Nat Methods 2:910–919
Liu B, Xue Y, Zhao W, Chen Y, Fan C, Gu L, Zhang Y, Zhang X, Sun L, Huang X, Ding W, Sun F, Ji W, Xu T (2015) Three-dimensional super-resolution protein localization correlated with vitrified cellular context. Sci Rep 5:13017
Lucic V, Kossel AH, Yang T, Bonhoeffer T, Baumeister W, Sartori A (2007) Multiscale imaging of neurons grown in culture: from light microscopy to cryo-electron tomography. J Struct Biol 160:146–156
Sartori A, Gatz R, Beck F, Rigort A, Baumeister W, Plitzko JM (2007) Correlative microscopy: bridging the gap between fluorescence light microscopy and cryo-electron tomography. J Struct Biol 160:135–145
Schorb M, Briggs JA (2014) Correlated cryo-fluorescence and cryo-electron microscopy with high spatial precision and improved sensitivity. Ultramicroscopy 143:24–32
Sun R, Chen X, Yin CY, Qi L, Lau PM, Han H, Bi GQ (2018) Correlative light and electron microscopy for complex cellular structures on PDMS substrates with coded micro-patterns. Lab Chip 18:3840–3848
Tao C-L, Liu Y-T, Sun R, Zhang B, Qi L, Shivakoti S, Tian C-L, Zhang P, Lau P-M, Zhou ZH, Bi G-Q (2018) Differentiation and characterization of excitatory and inhibitory synapses by cryo-electron tomography and correlative microscopy. J Neurosci 38:1493–1510
Acknowledgements
This work was supported in part by grants from the National Natural Science Foundation of China (31630030, 31621002 and 31761163006), the National Key R&D Program of China (2017YFA0505303 and 2016YFA0400900), and the China Postdoctoral Science Foundation (2018M640590). We acknowledge the use of instruments at the Center for Integrative Imaging of Hefei National Laboratory for Physical Sciences at the Microscale, and Dr. Jay He for help with design and construction of the cryo-CLEM platform.
Author information
Authors and Affiliations
Corresponding author
Ethics declarations
Conflict of interest
Chang-Lu Tao, Yun-Tao Liu, Z. Hong Zhou, and Guo-Qiang Bi have filed a patent (Chinese patent for invention, No. ZL201410490390.5) related to this work.
Human and animal rights and informed consent
All institutional and national guidelines for the care and use of laboratory animals were followed.
Electronic supplementary material
Below is the link to the electronic supplementary material.
41048_2019_92_MOESM1_ESM.avi
Supplementary material 1—Structures of an excitatory synapse. This movie shows the tomogram of the same synapse as in Fig. 10, displays as z-stack and 3D surface rendering of the segmented structures, including presynaptic (light yellow) and postsynaptic (cyan) membrane, endoplasmic reticulum or endosomes (orange), PSD (purple) and synaptic vesicles (colored spheres)(AVI 6934 kb)
Rights and permissions
Open Access This article is distributed under the terms of the Creative Commons Attribution 4.0 International License (http://creativecommons.org/licenses/by/4.0/), which permits unrestricted use, distribution, and reproduction in any medium, provided you give appropriate credit to the original author(s) and the source, provide a link to the Creative Commons license, and indicate if changes were made.
About this article

Cite this article
Sun, R., Liu, YT., Tao, CL. et al. An efficient protocol of cryo-correlative light and electron microscopy for the study of neuronal synapses. Biophys Rep 5, 111–122 (2019). https://doi.org/10.1007/s41048-019-0092-4
Received:
Accepted:
Published:
Issue Date:
DOI: https://doi.org/10.1007/s41048-019-0092-4