
Abstract
This paper will illustrate how a product-centric simulation approach to recycling is core to Design for Recycling (DfR) & Design for Resource Efficiency. This approach is underpinned by rigorous recycling rate calculations, building on the extensive expertise, knowhow and tools of classical minerals, and metallurgical processing. Process simulation and design tools such as the commercial HSC Sim software are applied to quantify critical DfR rules for a particular product as well as to quantify the recycling rates of all materials and elements in a product. The ten DfR rules we have developed for Waste Electric and Electronic Waste recycling in a study performed for NVMP/Wecycle (the Netherlands) are applied to light emitting diode (LED) lamps. The results produced include recycling and recovery rates, as well as recyclate qualities and quantities, and losses and emissions of materials during recycling for various LED lamp redesigns. Metallurgical processing is also briefly discussed, showing that, in many cases, element recoveries are reduced to zero due to product complexity and ppm levels in the products. Simulation models are linked to life cycle assessment (LCA) and exergy, demonstrating how the applied simulation basis provides the detail to innovate the system. In addition, rigorous environmental assessment is a further outcome of the approach, while at the same time revealing the development that has to occur in LCA databases to improve their value for Ecodesign.
Introduction
Ubiquitous metals and derived functional materials play a pivotal role in imparting the special functionality we have become accustomed to in the consumer products and sustainability-enabling infrastructures we manufacture and use daily.
It is no surprise that the Europe 2020 strategy declares “Natural resources underpin the functioning of the European and global economy and our quality of life” with the key objectives to achieve a resource efficiency (RE) conscious resilient society that champions a circular economy [1].
The recycling of bulk waste is relatively easy and fits into simplified circular economy discussions. The challenge lies in the recycling of modern products, the complex-designed “minerals” characterized by numerous specialty materials at their functional heart. Product-centric recycling [2] provides the platform for optimizing the recovery of materials and energy from these designer “minerals” in System-Integrated Metallurgical Processing (SIMP). In the United Nations Environmental Programme (UNEP) report on metal recycling [3], it is shown that resource-efficient recycling requires a robust, high-tech, interconnected metallurgical infrastructure as a crucial enabler of the EU2020 vision. Platforms exist for the recovery of metals from geological and designer minerals as shown by Fig. 1. Policy must provide the wise basis that cements these systems (i.e., internet-of-things) as key pillars into an RE-aware society.

System-Integrated Metal Production (SIMP) and the linking of all stakeholders on a predictive simulation basis as shown by blocks A to C. Design-based greenprinting of the WEEE system, i.e., the handprint realizes the minimization of the environmental footprint and links product design with geological and urban mines is key for a circular economy
Simplified circular economy discussions stimulate the notion that simplified Design for Recycling (DfR) rules are the golden bullet to resolve recycling hurdles. Complex products fundamentally challenge the development of too simple design rules [4] and approaches that suppress innovation, as they do not reveal the true impact of designs and design modifications. The RE and Ecodesign [5] playing field was recently challenged by the authors’ developed DfR rules [6] and suggested that policy
-
are based on robust and aligned with SIMP platforms that are thermodynamically, technologically and economically viable;
-
embrace system simulation, rigorously digitalizing the loss of metals from functional combinations throughout the processing chain;
-
reflect the interest and expertise of all stakeholders in the resource system, stimulating dynamic interaction; and
-
respect the time-varying product “mineralogy”, innovation and recycling profile as well as incorporating the dynamics of the system and its architecture.
The true challenge of RE is to link all the actors and stakeholders depicted in Fig. 1 through digitalization techniques (e.g., simulation tools, process control, suitable databases that make available data for software and information technology (IT) tools, modeling, design, exergy, thermodynamics, etc.) to pinpoint the innovations that will deliver the systemic performance that maximizes RE. This will enable the rigorous estimation of particularly all the losses of materials from the Waste Electric and Electronic (WEEE) or End-of-Life (EoL) recycling system, the losses that diminish RE. This systemic simulation is fundamental to minimizing the footprint of the system, thus enabling it by maximizing the handprint (i.e., the doing). The fundamental role of metallurgy as the basis of “closing” the loop is clear from Fig. 1, thus also depicting the true meaning of Sustainable Metallurgy. Metallurgical reactors close the material cycle, thus understanding process metallurgy well, innovating its potential through deep understanding of their physics, thermodynamics, transport phenomena for unique new designer “minerals” is the true challenge of RE, DfR, and Design for Resource Efficiency (DfRE).
EU2020 objectives will be guided to economic reality by the wise integration of techno-economically viable system-integrated metallurgical and material processing systems with Original Equipment Manufacturers (OEMs). Politics should thus be harmonized with economics, viable technology, and thermodynamic constraints.
In order to enable this assertion, this paper will show how product design mineralogy (i.e., OEM activity) can be linked to metallurgical processing to simulate the recycling system as shown by Fig. 1. Or in other words, the simulation models depicted by A to C in Fig. 1 must be linked to fundamentally connect product design to metal recovery in a carefully simulated manner. In this way, the RE of the system can be quantified, and its base operating line determined from which improvements can be measured and optimized as well as certified. It is also shown implicitly via simulation tools what the data format should be of the databases that map the urban mine.
Thus, maximizing the handprint and minimizing the footprint in Fig. 1 through rigorous system and plant design will produce a resource-efficient greenprint of the system in addition to key performance indicators. Thus, the greenprint of a designed system is the equivalent to the RE-optimized blueprint of the complete system and thus to our understanding an important tool to quantify the handprint as discussed by Biemer et al. [7], a concept that has its roots in India, developed already a number of years ago. Classical process design and engineering is at the core of the greenprinting of products, plants, and systems: the fundamental message of this paper. It will be evident from the discussion that the suggested approach places more rigor into Ecodesign [5], which generally speaking seems rather vague in true quantification of RE. Linking the product designer and metallurgical processing as shown in Fig. 1 is hardly possible with the simplified approaches being suggested and discussed by Vallet et al. [8], Karlsson and Luttropp [9], Luttropp and Lagerstedt [4], and Bonvoisin et al. [10]. Predicting the recovery of the multitude of elements from complex products shown in Fig. 1 already during design is the objective of this paper.
Designing Resource-Efficient Systems: Greenprinting
The objective of the societal challenge “Climate action, environment, resource efficiency and raw materials” of the Horizon 2020 Work Programme 2014–2015 [1] is “To achieve a resource- and water-efficient and climate-change-resilient economy and society, the protection and sustainable management of natural resources and ecosystems, and a sustainable supply and use of raw materials, in order to meet the needs of a growing global population within the sustainable limits of the planet’s natural resources and eco-systems.” Similar objectives are expressed in the recent publication for a circular economy [11].
It has been stated that “A smart economy minimizes the production of waste and reuses waste as a resource” and that “Resource constraints and environmental pressures will accelerate the transformation from a linear extraction-use-throw-away model of production and consumption to a circular one.” The need for the decoupling of economic growth from resource use has been clearly identified. One of the areas for investigation and improvement in the H2020 focuses on waste, i.e., resources, recycling, reuse, and recovery of raw materials by addressing the whole production and consumption cycle, from waste prevention and the design of processes and products for recyclability to reuse and waste management.
Metals, their compounds, and alloys have unique properties that enable sustainability in innovative modern infrastructures and through modern products [2, 3]. Through clever and innovative product design and high EoL collection rates, the metals and their compounds in sustainability-enabling and other products can be recovered effectively, thus recoveries and therefore recycling of metals can be high. However, limitations on the recycling rate, among other things, can be imposed by the (functionality-driven) linkages and combinations of metals and materials in products. The RE of the recycling system and the recovery and losses of metals/materials/elements from this can only be optimized by exploring these limits and restrictions on a rigorous basis, while addressing the interactions between design, particulate, and recyclate quality and recycling/recovery/losses in metallurgical processing as a consequence. This provides the basis for a well-designed greenprint of the system linked to optimized product design.
Figure 1 shows various factors and the actors/stakeholders that can affect the RE of metal processing and recycling. The interaction therefore of primary and secondary recovery of metals drives not only the sustainable recovery of elements from minerals but also provides the recycling system architecture that recovers metals from complex products and therefore enables the maximum recovery of all elements from designer minerals. It is self-evident that “classical” minerals processing and metallurgy play a key role in maximizing RE and ensuring that metals are true enablers of sustainability. These techniques have been applied in various ways in software [12], which will be briefly presented in this paper.
The principal aim of RE therefore is to drive processes and especially systems to their fundamental limit, opportunity, and innovation, as depicted in Fig. 2, hardly possible with methods suggested Finnveden and Moberg [13]. If the baseline for the system is known, innovation can be driven, and also the RE improved, as the position of systems relative to an absolute baseline is then known. This implies one can then direct research to those areas which bring true innovation. For example, Fig. 3 shows software that, using the aforementioned theory, can model, simulate, and control complete systems, e.g., the recycling pre-processing of light emitting diode (LED) lamps, as depicted.

Exploring the limits of the system and driving innovation through Systems-Integrated Metallurgical, Material and Product Processing (SIMP), as depicted in Fig. 1-greenprinting of a system relative to a fundamental system baseline

HSC Sim model of the recycling process for LED lamps developed in HSC Sim 8.0 (www.outotec.com), showing the link of physical separation (also connected to metallurgical processing) with the link to environmental life cycle assessment (LCA) in GaBi (www.pe-international.com) [14]: The basis of greenprinting of SIMP [16]
Figure 3 also shows that HSC Sim is supported and linked by sophisticated environmental LCA software [14]. In addition, Gibbs free energy minimization may be used to quantify equilibrium systems to assist in the simulations and understanding of the behavior of species if they undergo chemical change in hydro- and pyrometallurgical reactors and complete plants [6, 15]. This paper will present briefly how this theory has been used to describe and simulate the performance of complete recycling and residue processing systems. It will be illustrated how recycling rates and material/element recoveries and losses are calculated for various recycling architectures or product inputs/designs, based on full mass balances and quantities and qualities of (intermediate) recycling flows by applying existing industry tools. This will be done by highlighting a product-centric description of materials and EoL products. It will be shown how DfR rules and DfRE are based on this detail.
The true innovation discussed in this paper is the rigorous digitalization of the whole system i.e., the internet of technologies/processes using simulation tools. These originate from the primary minerals and metallurgical processing industry, modeling, and simulating the destination of all materials, metals, and alloys as a function of the techno-economically rigorous design of the system. Thus what we should be aiming for is Quantified Sustainability through rigorous simulation-based DfRE that produces a greenprint for the resource-efficient system, which we generally call System-Integrated Metal Production (SIMP) as already defined in some detail by Reuter [16]. While Stamp et al. [17] attempt addressing this complexity, their analysis seems to be simplified and does not reach the compound level nor rigorous mass and energy balance depth that is minimally required to capture the basics of a complex metallurgical flowsheet. This limits the environmental analysis and questions the results produced.
Product-Centric Recycling of Complex Man-Made Designed “minerals”
The key to RE is to digitalize the system on a meticulous basis. To do this, it requires a deep understanding of the existing fundamental basis of minerals and metallurgical processing. The authors have used this classical theory as a basis and adapted it to describe recycling and residue processing systems. This permits the calculation of material and element recoveries/losses, as well as fugitive emissions over the entire recycling system from product design and input mixtures, dismantling, pre-processing, and final treatment (i.e., process metallurgy). This provides a rigorous digitalized basis for DfR as part of DfRE [18]. Figure 4 reflects some of the complexity of EoL materials and the possible issues that describe and affect the liberation behavior, inevitable recycling (in)efficiency, and thus losses from the system. This section will describe the detail required to design resource-efficient systems.

Learning from the simulation of complex primary minerals (left) processing and metallurgical plants to quantify the processing of complex “designer” minerals, i.e., consumer products, which may have even more complex “mineralogies,” as shown by the figure on the right
Mineral Structure of Products and Recyclates
In order to capture the link between classical minerals and metals processing, recycling and product design requires theory to harmonize seamlessly over the complete chain, thus linking geological and urban mines (Fig. 1). This enables the calculations and optimization of recycling efficiency and recoveries of EoL products on a similar consistent mineral basis as shown by Reuter and Van Deventer [19] for mineral flotation and grinding systems. This means that the “mineral” structure (implying material usage, combinations, and connection types) has been linked by “mineral” liberation data structures similar to primary minerals processing of geological ores. Calibration has been done from extensive recycling liberation data collection and analyses of pre-processing recyclate fractions and the particles they contained.
The complexity of EoL products as shown in Fig. 4 and often the lack of good sampling data for scrap, lack of detailed “mineralogies” of EoL products, lack of understanding of liberation behavior etc., make the simulation of recycling systems significantly more difficult. Nevertheless, by the systematic use and description of recycling systems on the basis of well-established minerals processing and further developments of this theory, steps have been made to support consistent data collection on WEEE recycling input streams and products, sampling systems, data acquisition and storage, data resolution and depth in terms of analysis and composition (grade). This standardization of data will be of great assistance in providing the detail that can help enable RE.
Particle Description of Recyclates
The fundamental description and optimization of the recycling system require the key understanding that EoL products, waste materials etc., and should be considered very much like minerals, as shown in Figs. 4 and 5. This takes into account the complex and non-linear interactions between different metals/materials/compounds as applied for product functionality, performance, design, and/or esthetic reasons. We coined the word product-centric [2] recycling, based on the equivalence to mineral-centric, as shown by Reuter and Van Deventer [19]. This thinking by default brings into play the richness of all the theory and tools available through classical minerals and metals processing. The product-centric approach to recycling is core to DfR and DfRE; it allows the pinpointing of the interactions and effects of design considerations (material choice/combinations) in combination with recycling processing infrastructures/routes on material recovery, losses, and emissions and hence RE. Chancerel and Rotter [20] go to some length to analyze electronic waste, but no link is made to simulation. In future, such work should always provide data in a format so that true simulation can be completed on the basis of the data produced.

Particulate and recyclate quality (determining recyclate quality and recovery/losses) as a function of design. An impression of unliberated and multi-material particles from LED lamp recycling as included in the HSC Sim models. The bottom row shows recyclate fractions as photographed by authors produced from certain designs. They will be different for other designs
This inclusion of liberation and particulate quality as a function of design and comminution, and hence recyclate quality, into the description of a recycling system is crucial for understanding and optimizing recycling [19, 21]. In the modeling of liberation, parallels were drawn between classical minerals processing and the shredding/size reduction of EoL products [18]. By considering the product designs of LEDs shown in Fig. 5 and the created recyclates, some of the ferrous liberation fractions could be defined. Although steel is a minor fraction, fractions are defined such as these that principally found their way into the magnetic fraction, showing the domination of the magnetic property. Understanding this well makes it possible to better quantify losses in the system through physical phenomena as well as through dissolution of metals into inappropriate phases. It is self-evident that many of the materials in the fractions would not arrive in the steel but rather be lost to slag, flue dust as well as offgas, in an electric arc furnace (EAF). This will be discussed in the next section.
This detail is the true basis for quantifying sustainability and DfR, also in an early design stage and at the basis of the Metal Wheel and compatibility matrix that will be shown further below. The complexity of the particles in Fig. 6 suggests that significant work still has to be done on how particles are liberated during cutting/shredding in residue and EoL processing systems, although some work is available that has attempted to understand these phenomena better [18, 21]. Without the detail of Fig. 6, Ecodesign is shallow and will provide no meaningful guidance and makes the use of the Metal Wheel risky.

Recyclate composition of the ferrous fraction for the baseline design showing materials present in liberated and unliberated (impure) particles/fragments as defined in the HSC Sim 8 simulation model for LED lamps pinpointing the (design determined) reason for decreased quality and recyclability of this fraction. This shows that these simulations are a real tool for DfR. An MFA does not define this detail and therefore cannot provide a basis for good Ecodesign
The product-centric approach simultaneously considers all metals, alloys, materials etc., in an EoL product. Through this approach, recycling has the potential to capture much greater value from waste streams, extracting the metals presently still being lost. Thus RE is captured, much in the way we capture the losses of all metals in classical minerals and metals processing system. Using a tool developed in classical minerals processing and extraction, the authors could use and define EoL products and particles as minerals, as shown in Fig. 6, systems can be simulated as shown in Fig. 3, which links product “mineralogy” and liberated, cut and/or shredded particles to recyclate composition and mineralogy. This then makes it possible to link EoL products to metallurgical recovery.
The collection of data in the detail reflected by Fig. 6 and using these for calibration of simulation models for complete physical separation plants. This is a key innovation for the future and also crucial for providing the detail for implementation of Weeelabex [22] as well as for the realization of meaningful Ecodesign.
Metallurgical Processing of Recyclates
At the heart of product-centric recycling is an in-depth knowledge and understanding of extractive process metallurgy, slag chemistry, separation physics, and systems engineering as well as the techno-economic (capital expenditure CAPEX & operational expenditure OPEX) aspects of processes and processing systems. Easy to use diagrams such as Ellingham diagrams can easily be generated with existing software, as shown in Fig. 7. This figure shows the stability of various oxides, implying that in standard pyrometallurgical operations most of the stable oxides will disappear from the cycle in the slag phase. If a quick estimate is needed to see how various species behave under different conditions, a Gibbs free energy minimization can be performed, as shown in Fig. 8.

HSC Sim 8 (HSC 2014) example showing the stability of various oxides. Stable oxides in the lower part of the figure will preferentially report to slag during smelting (e.g., rare earth oxides). Depending on the activity coefficient of the elements in the metal phase, these distribute accordingly between metal, flue dust, and slag, for example

HSC Sim 8 (HSC 2014) permits the calculation of the free energy minimum of a system. Shown in the figure are the equilibrium phases for the given conditions for the Cu–S–O–Si–Fe system
Figure 9 shows that metallurgical production systems of the nobler carrier metals such as copper, lead, tin, and zinc usually includes a refining infrastructure for minor elements. During refining, copper for example releases the dissolved elements in a sophisticated refining infrastructure as reflected by Fig. 9 to produce high-purity metals, sophisticated alloys, and compounds. Thus, high-purity metals and materials can be refined from a range of inputs. The more ignoble the carrier metal (the lower part of Fig. 7), the more dilution with virgin material is required to produce the correct alloy quality; usually only refining to suitable alloy quality is done. Figure 10, the Metal Wheel, allows for a quick scan of metallurgical recovery and losses of a particular EoL material as a function of the produced recyclate and particulate quality (also as a function of design—see Fig. 5). The recyclate and particulate quality (Fig. 6), as well as the dispersion of the elements and components (such as parts of a printed circuit board assembly (PCBA)) over the various recyclate fractions, determine in which metallurgical commodity metal infrastructure the recyclates and contained materials/elements will end up and be recovered, or lost. This is depicted by the different sections or slices of the Metal Wheel (as derived from the original Metal Wheel for ores/concentrates by Verhoef et al. [23]). Each slice represents the complete metallurgical processing infrastructure and depth for a carrier base metal refinery (e.g., Fig. 9). This basic metallurgical knowhow, based on the processing of concentrates originating from mineral ores (the elements are typical of the different ores), is also in place for recycling to maximize RE [18]. It is based on typical thermodynamic knowhow, as reflected by the detail shown in Figs. 7 and 8.

A company such as DOWA Japan (http://www.dowa-eco.co.jp/en/recycle.html) fully exploits the refining metallurgy of at least four segments of Fig. 10 i.e., copper, lead, zinc, and nickel processing infrastructure, to produce various refined high-quality metal products, alloys and compounds from various inputs, using a suitable mix of pyro- and hydrometallurgical technology to achieve this

A generalized Metal Wheel for an EoL product, showing a complete carrier metal industry in each sector. Each segment has an infrastructure that efficiently recovers in a product-centric way as many as possible of the elements, metals, and compounds present in recyclates. This is a function of recyclate composition and quality (determined by design and pre-processing); the cleaner the scrap, the better the targeted recovery [27]
Generally speaking therefore, base metal metallurgy is often a highly sophisticated metallurgical refining metallurgy, which produces high-purity metals, compounds, and materials. Steel, aluminum, and magnesium, which are ignoble elements relative to copper for example, require dilution with virgin metal extracted mostly from ores or high-quality recyclate fractions to produce sophisticated alloys of high quality and economic value with tight tolerances in alloying element ranges as required by numerous high-tech applications of these alloys.
An example of the use of the Metal Wheel is the following: Consider a PCBA, or part of one, connected to the product structure by a steel bolt or other means (or even enveloped by the steel during shredding of a car). Due to the magnetic steel, this complex material will most likely end up in the ferrous fraction due to magnetic separation. Thus, the PCBA finds its way into the steel recycling infrastructure, rather than the preferred Cu/Pb route (as depicted in Figs. 9, 10), where all elements not useful for the required steel quality would be lost (e.g., also the precious (PM) and platinum metals (PGM)). On the other hand, if the PCBA were totally liberated, it would most likely flow into the Cu recycling infrastructure. There, due to copper’s relative nobility, it has the capability of capturing (dissolve) many valuable (sometimes scarce) technology elements from PCBAs and other EoL products, acting as a solvent. However, the bolt of steel (and its numerous alloying elements) would end up as FeO x and oxides in the slag and would be lost as would be any rare earth elements due to their stability as shown by Fig. 7 (bottom).
Process Metallurgy
The complexity and detailed knowledge of extractive metallurgy and thermodynamics required to understand and predict the recovery of metals from complex recyclates such as LEDs is based on the complex interactions and inter-linkages between metals/materials. This detail, as well as the techno-economics, flows into the simulation models that will be discussed further below covers the detail shown in Fig. 11.

Examples of different levels and details of data required (from bill of materials/chemical content analyses etc.) that capture the recycling profile of a product and also pinpoint critical DfR and DfRE issues and hence prompt innovation
Figure 12 shows the recovery of metals into the metal phase (from which they can be recovered) in a top-submerged lance (TSL) furnace (thus the deportation and recovery of all elements into all other phases) as a function of temperature (T) and partial oxygen pressure (pO2), as well as the solution thermodynamics of each phase as well as the specific fluid flow conditions [24]. Figures 12 and 13 depict the complex non-linear interactions that occur within metallurgical reactors that determine the destination of the elements present in the feed. These figures highlight various parameters that effect recovery, ranging from activity coefficients (Fig. 13), slag conditions (Fig. 13), compound stability (Fig. 7), and the complex non-linear equilibrium of compounds (Fig. 8) and the effect of conditions within the reactor as well as elements in the feed and the effect of volatile species (Fig. 13). In a furnace, the aim is to operate in a window that maximizes recovery of many elements in the feed at the same time into the phases from which they are best recovered downstream during refining. It is a mistake to take a specific window that looks good for one metal only, the usual one-dimensional tendency that simplistic DfR approaches often follow. The elements listed in Fig. 12 are also typically those in LED lamps (or any other similar complex WEEE) that can mostly be simulated for the copper system, although the solution models in FACT Sage 6.4 [15] do not fully cover the range of elements in WEEE. Filling the gaps in the metal solution models for various technology elements is the real challenge in DfR and where fundamental work should focus on in the field of RE, Sustainable Metallurgy and Ecodesign. Thus, a process can be designed and performance can be calculated on the basis of this type of simulation [15] noting and being aware of the limitations in the thermodynamic databases for molten metal and slag solutions. Various data such as that summarized by Lu et al. [25] show the key to what has to be understood to maximize metal recovery. In addition, transport processes and the type of technology (Fig. 14) should not be forgotten in this analysis and simulation [24].

Indicative recovery (in %) of a selection of the many elements present in WEEE (e.g., PCBA & LED) into the solvent copper phase of smelting at 1,300 °C in a smelting reactor with a large volume of gas flowing through a molten typical slag bath for the pO2 range. Note that many of the metals also report to other phases and are thus crowded to low recovery level to copper metal (thus outside the range of the y-axis)

FACT Sage [15] predictions of the activity of various elements in solution in copper in the given conditions in (a) and (b), as well as the distribution of various elements to copper, slag, gas, and dust phases in the given conditions in (c) and (d) for a specific furnace type. Note that the amount of solids precipitated in slag is also shown in (c) for two levels of aluminum

Some figures of various operational recycling smelting technologies, e.g., TSL and Kaldo, mostly as an integral part of complex refining infrastructures as shown in Fig. 9. The environmental cleanliness of these systems with extensive offgas cleaning systems to maintain operations within the boundaries of environmental legislative constraints is also evident
It is clear from Fig. 12 that optimizing the recovery of metals from complex mixtures of recyclates requires very careful control and understanding of the theory of metallurgical (hydro- and pyro-metallurgical) reactor technology to obtain metals that report to fractions from which they can be economically recovered. It reveals that recycling is clearly a complex thermodynamic and economic puzzle to solve, with no obvious single answer or set of DfR rules. This is most certainly not solvable with credos such as “cradle-to-cradle” [26], which seem to disregard thermodynamic complexity and above all the 2nd Law of Thermodynamics. This discussion also suggests that all the figures in this paper are snapshots and will be different for each new situation. Figure 13 reveals that metallurgy must include a recycling/recovery rating and DfR approaches for it to make sense. This depth of mineralogy (i.e., compounds, alloys, transformations, etc.) as shown in Fig. 11 for the LED and solution thermodynamics as reflected in Fig. 13 must be included in DfR approaches in order to derive industry-relevant conclusions and economic and realistic technological and policy (including eco-design) recommendations for recycling.
If one considers that liberation, sorting (in)efficiency during pre-processing, recyclate and particulate quality as depicted in Figs. 5 and 11, which all complicate the picture even further, it should be clear that no average recycling rates can be applied to predict the recycling of complex products and the recycling rates of the materials/elements/compounds they are composed of [18, 27].
In view of the detail discussed in this paper, it is clear that each product, and each situation must be calculated and checked to reveal its complexity fully. This can be done by applying rigorous modeling techniques (Figs. 7, 8, 12 and 13) to reveal the opportunities and limits of recycling and to quantify recycling/recovery rates as well as losses and emissions in the EoL phase in relation to product design and recycling options. It should be realized that even these have limitations, as all thermodynamic data are not yet available. Efforts should be focused on determining these thermodynamic and fundamental data rather than developing one-dimensional and simplistic design for recycling as well as material flow approaches that have no link to reality.
This product-centric approach, with its roots in minerals and metals processing, is an example of the practical application of systems thinking to a complex issue—and optimizing it requires DfRE. It is an approach that leads to a set of conclusions with strong implications for public recycling policy, one realized in ready existing technology, as shown in Fig. 14. It reveals when we will hit a “brick wall,” suggests changes, and prompts innovation and not just continuing research without a bigger perspective (Figs. 1, 3). Furthermore, it gives a true physics-based meaning to the so often and easily used word “holistic”.
Process Simulation
DfR demands a tool (see process simulation models in Figs. 3, 15, 16 including the detail of Fig. 4) that is capable of quantifying the product’s recycling profile and performance to pinpoint DfR issues of importance and to give priority within the design adjustments to be implemented and insight into the effect of improved design on RE (recycling rate, toxicity, scarce material recovery/losses, environmental impact, etc.).

Process simulation model for LED lamps, showing the quantified recovery of Al in a Sankey diagram in % to all (intermediate) recyclate flows and recycling products (results are equally derived for any of the other materials/elements in the product/input). This provides a true basis for DfR and system design greenprinting by pinpointing critical issues/losses, as well as for the calculation of recycling rates and environmental assessment

An HSC Sim 8 simulation model for an e-waste and copper scrap smelting process that also has LED PCBAs in the feed. The exergy flows are also shown
Process simulation models predict recoveries, losses, and emissions of all the materials/elements in a product/recycling input flow and determine the qualities and quantities of all (intermediate) recyclate and recycling products in the recycling system. Sankey diagrams can be defined based on these full material and mass balances, derived from product-centric-driven simulations. Figure 15 illustrates the flow (recovery and dispersion) of aluminium (Al) over the physical recycling system as an example of simulation outcomes. The flow of any other element/material/compound is simultaneously predicted and can be derived from these simulations. This basis is very different from the usual Sankey diagrams, which are developed on a simplistic Material Flow Analysis (MFA) approach in vogue when visualizing the material ‘flows’ in and from the Urban Mine [28]. MFA usually lacks a rigorous multi-element and compound process simulation basis [16] that incorporates the non-linear interactions dependent on the product and processing route, which strongly affect recoveries and losses and is not sufficient basis for DfR.
As shown in the Metal Wheel (Fig. 10), the efficiency (recovery of different elements), losses, and fugitive emissions of metallurgical processing are determined by process thermodynamics and also affected by the grade or quality of the recyclate flow entering the different metallurgical processing routes. HSC Sim models not only quantify recycling rates, but also quantify the so important grade/quality of all (intermediate) recyclate flows that flow into the metallurgical processing facilities (Fig. 16). Without this detail, no recovery rates can be calculated at all, including metallurgical processing, which is the ‘closer’ of the loop (as far as thermodynamically and technologically possible).
The detail of Fig. 15 and 16 is minimally required to capture the RE of the recycling system as well as to perform meaningful Ecodesign. While the metallurgical industry generally uses sophisticated simulation for their complete flowsheets as shown here for a smelting reactor (Fig. 16—simulating industrial facilities such as shown in Fig. 14), the physical recycling world resorts often to simpler approaches. The physical recycling world would advance much if it would use more often simulation tools. The true innovation thus (and it is a tough one!) is to measure data in the format as shown in Fig. 6 (as done on minerals processing plants) so that fundamental separation models can be developed and/or improved as well as calibrated within a simulation platform (Fig. 15). Presently data collection for recycling is often of a nature that it does not permit the easy calibration of simulation models as shown in Fig. 15. This results in the use of simple MFA models which are of no real value to the Ecodesign of sophisticated and complex (consumer) products.
Design for Recycling (DfR)
Linking of existing and industry applied Process Simulation tools to CAD/design tools is a necessary step forward towards realizing realistic and economically viable DfR (see Fig. 17). Figure 17 shows the basis required for understanding a complete recycling system. The examples in Figs. 3, 6 and 15 show that, based on rigorous recycling process simulation and detailed product compositional data derived from CAD/design tools, recycling performance indicators and recycling indices including environmental analyses can be derived. The simulated recovery rates for commodity and minor/critical materials along with recycling indicators provide the basis for rigorous DfR. Ecolabels for a product can be derived in this way, providing the depth to distinguish differences in product designs and identify the most resource-efficient. This approach incorporates detailed product design and the recycling system dependent composition (grade) of all streams, residues, effluents etc. (see Fig. 15) in the evaluation for DfR. Mass flow models provide a basis for any ‘add-on’ analyses such as environmental and/or economic analyses. Figure 3 illustrates the software-based link between HSC Sim and GaBi, which allows the link of process simulation tools with environmental assessment software. In the 6th EU framework project SuperLightCar [18], a software based link between CAD, recycling process models, Life Cycle Costing tools and Life Cycle Assessment Software [14] was realized, proving the capability of linking these different types of tools for DfR.

System Greenprinting
We define the simulation-based optimization and environmental footprinting of recycling systems shown in Fig. 1 as greenprinting. This delivers:
-
economic drivers and KPIs that capture the performance of the complete system (Fig. 1) and should be the main drivers;
-
a definition of the Best Available Techniques (BAT) by a certified system of operators in order to calculate the best recovery on a level global playing field (Fig. 2);
-
a thermodynamically underpinned recycling policy supported by suitable simulation and rigorous fundamental and industrial calibration data (Figs. 2, 3);
-
technology and system innovation that maximizes RE (Figs. 1, 9);
-
incentives that should be transparent for all stakeholders;
-
a structure for collecting recyclate data and suitable compositional resolution similar to that describing minerals;
-
a structure for sampling based on rigorous sampling theory, thus revealing and storing the product “mineralogy” of EoL materials; and
-
above all, that the DfRE of products, systems, waste etc., should be based on thorough process simulation and design. Simple material flow analysis (MFA) is not good enough to estimate RE, especially for scarce technology elements present in WEEE in small quantities in complex “mineralogies”.
The above is common practice in plant and system design and optimization for minerals, metals processing and metallurgy. In pyrometallurgy, all data are measured in such a way that standard polynomials can be calibrated for heat capacities (c p ), solution models etc., to calculate enthalpies and entropies. These fundamental data provide the so important baseline shown in Fig. 2, to which things are measured and relative to which things can be compared and potentials and limits for improvement can be identified.
A Case Study: Recycling of LED Lighting
Physical Recycling: Production of Recyclates of Economic Value
HSC simulation models have been defined and applied to simulate the recycling of five different LED lamp and spot designs. Design A is the standard LED against which results can be compared. These models and the underlying particle systems have been calibrated for a LED recycling trial as performed by a company within the GreenElec ENIAC joint undertaking. Recycling and recovery rates, as well as qualities, quantities, losses and fugitive emissions for all materials and elements in the LED lamps of this recycling set-up were predicted using the HSC Sim models (see Figs. 15, 16, 17). It is important to note that the particular focus of these trials was to produce a metal-rich fraction containing the driver and LED PCBAs. Hence the recycling performance does not necessarily represent the corporate or industrial average. Each physical recycling company will have their own strategy to maximize profit to deliver recyclates that maximize profit.
Figures 6, 15 and 16 above give some examples of the detail of these calculations, presented as recyclate particle quality (Fig. 6) and a quantified Sankey diagram for elements, respectively (Figs. 15, 16). Figure 6 shows the weight distribution of Al over different defined particles, whereas Fig. 15 gives the quantified recovery of Au in % to all (intermediate) recyclate flows and recycling products. Results are derived equally for any of the other materials/elements in the product/input.
It was learned from the trials that the type of potting material in the LED lamps/spots affects the liberation of the fraction in recycling, and decreases the particulate quality, due to potting materials being attached to PCBAs and/or steel, for instance. As this negatively affects the separation efficiency of PCBAs and hence decreases recyclate quality, additional granulation of certain fractions might be considered an option to increase quality and the recovery of PCBAs in this case.
In the first example, the HSC Sim model has been applied to quantify and predict recycling rates and the qualities/quantities of all flows and materials/elements as shown by Fig. 18. This is the standard Design A. This model has also been expanded to investigate the effect of additional granulation on the recyclability and recyclate grade. Figure 19 presents the quantified recoveries into valuable recyclates. These are calculated for all materials and elements in the LED lamps/spots (shown for a selection of valuable/critical elements) and Cu (given for the element) contained in the PCBAs and electronics recyclate fractions. Also shown are the steel/ferrous metal recovered to the steel/ferrous recyclate fraction (as alloy) and Al (alloy) in the aluminum recyclate. Two cases are described viz. (i) the recovery for additional granulation and thus liberation (left bar) and for pre-processing for the defined plant set-up, and (ii) without additional granulation (right bar). Each of these valuable fractions can be treated metallurgically either in a non-ferrous precious metal smelter or in aluminum and steel recycling facilities, respectively.

Distribution of materials to recyclates for the standard Design A for the flowsheet depicted by Fig. 15, which shows the recovery, losses, dispersion of materials/minerals to various streams

Pre-processing recoveries into valuable recyclates ONLY of a selection of different valuable elements (Ag, Au, Ni, Sn, Cu) and metal alloys (Steel/ferrous and Al) from LED lamps/spots for the recycling process set- up including (left bar) and without (right bar) additional granulation. Note Depending on the destination of the recyclates the final recovery could decrease to ZERO for the metals flowing to the incorrect metallurgical destination
The results in Fig. 19 show a strong increase in the physical recovery in recyclates as a result of the additional granulation. This becomes particularly visible for the materials/elements contained on the PCBA, as the additional granulation focused on improving the liberation and increasing purity of PCBA particulates (liberated from the potting). This allows for improved sorting efficiency and increased quality and recovery of these materials/fractions. Thus it must be noted that Fig. 19, in this case, only presents the recoveries based on pre-processing recyclates! In order to recover/obtain the metals/materials from the produced recyclates, these fractions will be treated in metallurgical processing and a refining infrastructure (see an example in Fig. 9). Figure 20 gives a further example of the calculations possible in HSC Sim for the flowsheet depicted by Fig. 15, i.e., the grade (quality) of the produced metal-rich fraction can be derived for the two described cases (including and excluding additional granulation respectively). Figures 21 and 22 show further details of recoveries of elements and grades calculated for the different LED designs A to D respectively. This shows the importance of understanding the effect of the redesigns of the lamps and how this affects the recovery of the elements and grades of the recyclates. These aspects all have a significant effect on the metallurgical recovery and needs to be understood in detail to add true value DfR.

Example of the grade/quality of the metal-rich fraction for the case including additional (a) and no additional granulation (b). Quality is expressed in this figure in materials/compounds; similar data is calculated for the elemental composition of these flows (equally calculated for any stream in the recycling flow sheet). The figure shows an increase in contaminants (e.g., increase of presence of potting material) so the composition has changed thus the economic value as well as possible destinations

Element and compound recovery to recyclates for Design A (standard) and Design B designed for liberation with fracture lines respectively

Quality of recyclates for Designs C and Design D; i.e., deep-drawn aluminum with and without potting (which is added for rigidity) respectively
Metallurgical Processing
Figures 6, 20 and 22, shows the high level of contamination of the metal-rich recyclate flow, which can be manipulated and rendered cleaner by additional granulation. Similar calculations are equally derived for all the flows in the processing flowsheet for the four redesigns of the LED lamps. The presence of contaminants can (see for example Figs. 6, 12) significantly affect the processing conditions and hence recovery, losses, emissions of metallurgical recycling processes. In addition, the effect on the energy profile and required additional process input such as virgin aluminum and pig iron (with all environmental consequences related to this) to achieve correct alloy qualities can be calculated.
For example: the presence of contaminating potting material (which is higher for the case in which no additional granulation has been applied) in the metal-rich recyclate will have a detrimental effect on the recovery of valuable elements from this fraction, as elements will report to the slag. This leads to an increased slag production, slag viscosity and increased valuable metal losses as well as energy input to keep everything molten. Thus metals/elements not compatible with a specific metallurgy in the sectors of the metal wheel will mostly be lost to slag. Note however, it is general smelter practice to mix different feeds into a suitable feed mix that best suits and optimizes furnace operation, while minimizing losses to unwanted streams.
While some physical recycling rates above for different physical separation are mentioned, we do not give any final recovery of the elements after the metallurgical processing, as this is also very much determined by the technology, feed mix, and the strategy of a smelter. It would be implicitly clear from the various figures that depending on the conditions, the amount of elements within the recyclates and hence their economic value would determine where the recyclates would be directed to optimize the recovery of the elements. It must also be noted that thus depending on the economics then while some elements are recovered, while governed by thermodynamics and transfer processes other elements will go lost. Thus a straightforward answer will not be given here.
Depending where the recyclates are directed to, for instance, if it is to aluminum, most of the elements shown in Figs. 19, 20, 21, and 22 would drop to low values. The same would apply if it goes to the steel stream. The Cu/Ni route is most suited to recover most of the valuable LED and PCBA elements, shown in Figs. 19, 20, 21, and 22, with as high as possible recovery rates (actual recovery rates are also dependent on the contaminants present). Many of the elements shown in Figs. 7, 12 and 13 are present in LED systems, therefore estimating the recycling and recovery of these elements must consider all of these aspects in addition to the reactor type, which also affects all the transfer processes within a reactor that ultimately determines recovery [24]. In lieu of this detail, Fig. 23 reflects the total metal recovery after metallurgical processing, e.g., in furnaces such as those depicted in Fig. 14 as well as refining as depicted in Fig. 9, and thus all losses of the physical separation as well as metallurgical recovery are included. To make the reader aware of the influence of the metallurgical processing route followed, error bars have been included; thus there is no single value, and the whole flowsheet must be simulated. In this example basically only the TSL furnace has been included.

Recovery of elements (inclusive of error bars to reflect different options which will produce different recoveries) through the whole recycling chain, i.e., from physical separation to metallurgical recovery. This figure refers to metallurgical recovery in a TSL if all materials in Fig. 19 were to be processed in a Cu(Ni)-based smelter. Obviously steel and aluminum rich fractions would be processed in appropriate infrastructure, which would maximize their recovery, but lead to a loss of non-liberated elements (e.g., PM or PGMs) in those specific fractions
The above analysis assumes first pyrometallurgical processing followed by hydrometallurgical treatment of materials, as shown in Fig. 9 for example. This metallurgical processing infrastructure deals well with residues, low-grade plastic contaminated recyclates (as secondary fuel/reductant), etc. A similar analysis should be followed to investigate whether initial hydrometallurgical treatment, which creates various impure plastic and residue fractions (that may have to be dumped) from PCBAs, unliberated housing materials etc., is a better option. This can only be determined by rigorous simulation, CAPEX, OPEX as well as environmental and exergy analysis. It must be noted that the entropy increase from dissolving elements in aqueous solutions is not negligible. Thus an important further analysis of pyro- versus hydrometallurgical processing options is the exergy creation during the dissolution of elements during hydrometallurgical processing from metal to dilute solutions. HSC’s exergy module is very useful for analyzing systems on this rigorous thermodynamic basis to find the best RE solution for a particulate recyclate.
Environmental Assessment Using LCA Software and Exergy
Figure 24 gives a snapshot of the environmental assessment as performed for this case, using the approach depicted in Fig. 17. As granulation is a relatively energy-intensive process step in pre-processing and extensive granulation can increase the production of very fine particle fractions (e.g., dust emitted to air), the environmental impact of increased energy consumption and emissions to air should be taken into account when assessing the benefits of increased recovery and improved quality of recyclates. More potting material in the recyclate increases the production of slag and/or increased energy and material consumption during metallurgical processing. Hence reduced potting material in the recyclate fraction either due to improved liberation or changed lamp design could positively affect the environmental balance of recycling LED lamps.

A GaBi Process plan, Process (with flow details normalized to the reference aluminum secondary material) and Balance (impact results) produced as an exported file from the HSC Sim 8 simulation for the LED lamp/spot physical processing example
With this approach, recovery rates and material losses can be simultaneously assessed and the environmental impacts evaluated. This reveals the benefits of recycling while considering energy consumption, emissions to nature and all the effects on metallurgical process operation conditions arising due to recyclate quality and recovery and the emissions thus created. This is a very sophisticated task, which can be performed based on depth and detail, and the full mass balances for all elements/materials, including all non-linear interactions (and energy balances) as provided by HSC Sim and FACT Sage.
However, when performing the environmental assessment based on the detailed knowledge as provided by HSC Sim linked to GaBi, it becomes clear that the environmental databases are inadequate for recycling and contain numerous gaps. Stamp et al. [17] seem not to have considered this detail and therefore their and similar even less detailed work may have produced erroneous environmental assessments. Bovea and Gallardo [29] suggest always to do a sensitivity analysis, but this does not mitigate the fact that numerous streams cannot be mapped as the detail of a simulator flow in its full compositional complexity is not always available in the environmental databases.
The inventory as calculated by HSC Sim provides a sound basis for improving environmental databases and impact assessment. Thus processes can be estimated providing much needed benchmark process information to bring more rigor into the LCA databases. This is already in use through HSC Sim 8, where environmental databases can be improved based on rigorous metallurgical knowledge for many different metallurgical infrastructures.
In summary, it should be noted that in many cases the detail is not present in LCA databases, therefore seriously questioning results produced by these tools to date. As long as LCA data has not been improved for recycling, one has to question the value of environmental weight calculations as a tool for DfR and hence for recycling optimization at this point of state-of-the-art DfR.
While MFA-based LCA-type approaches provide general information and highlight in a very general manner where things may be problematic, they do not provide a solution. These MFA methods provide neither the information on how to innovate the system nor the detail on a techno-economic basis to improve the system. Therefore, it is always advisable, in addition to environmental impact assessment of the complete system, to use tools such as thermodynamic-based approaches like exergy for analysis and/or mass and energy transfer analysis [24]. Figure 16 shows such an analysis, thus highlighting where there are improvements to be made, and where most losses occur.
Discussion: Application of DfR Rules in LED Lamp Recycling
A set of ten DfR Rules was proposed by Van Schaik and Reuter [18] for the application of the above-mentioned simulation tools and techniques. These rules were grouped into five fundamental design rules and five derived guidelines and constitute the basis of the greenprinting of recycling. These rules balance the optimization of RE through product design for recycling and system design for optimized RE. We will apply our ten rules here to the LED example to demonstrate that, when these are applied, meaningful information can be given to the product designer. Luttropp and Lagerstedt [4] have defined ten useful golden rules but these provide neither detail nor resolution how to change and optimize nor provide physics based techno-economic analyses how to innovate the system. In the end methods and rules must be rigorous enough to show where the RE gains in the system occur in a quantified manner, otherwise things remain too vague and general. With a rigorous simulation basis a fundamental RE quantification enabling structure is brought into the general Luttropp and Lagerstedt [4] rules.
Application of the Five Fundamental DfR Rules to LED Design
-
Rule #1: DfR rules are product and recycling system specific; oversimplification of recycling by defining general DfR rules will not produce the intended goal of RE. Figures 3 and 4 show the different facets and complexity of recycling complex multi-material products such as WEEE. These also reveal all the details, which should be considered in DfR & DfRE. Due to its functional and unique mix of materials, each product has a unique recyclability profile and fingerprint. This implies that every product has a unique set of DfR guidelines, which are product and recycling system specific. The ‘Recycling Matrix’ [27] reveals the unique recycling fingerprint of some precious/critical metals in a specific product. Figure 25 illustrates that although the five designs may all have a similar suite of functional materials loosely called “mineralogies,” the total recovery is different and hence their recycling rates are different. Figure 26 shows that, depending on the product and the combinations of materials of LEDs; the recovery of metals may differ due to chemistry, concentration, and metallurgical processes being incompatible. This Recycling Matrix has been developed as a preliminary DfR tool for designers and design tools. It captures the physics of recycling on the basis of the discussed simulation models that link product design to the complete recycling system.
Fig. 25 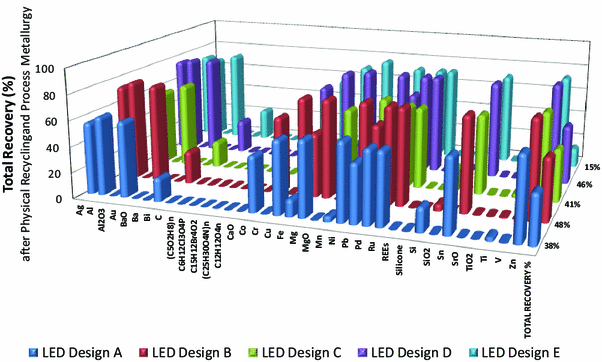
Recovery of elements after the metallurgical processing of the different recyclate fractions. The total metal/element recoveries of each of the standard LED design and redesigns B–E are given on the right. These are rather low values, but this is to be expected from the rather complex “mineralogy” of LED lamps
Fig. 26 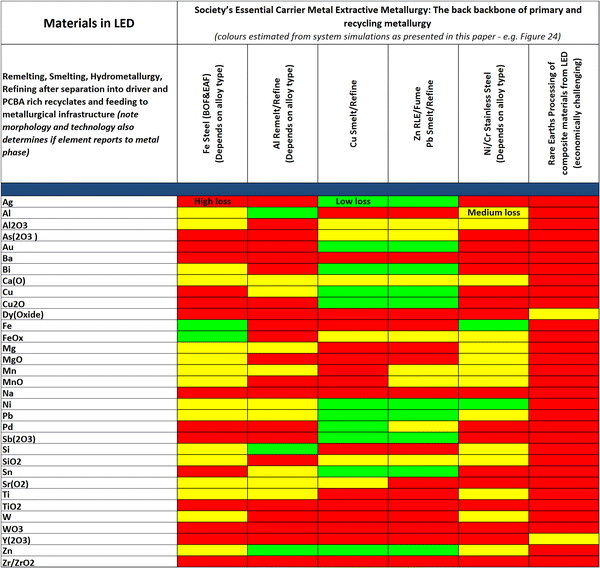
Design/material (in)compatibility matrices for the driver and LED PCBAs in a LED lamp. It shows the (in)compatibility of elements in the product/component with the various carrier metal processing routes of the Metal Wheel (Fig. 10). This based on the chemical analyses of PCBAs in LED MR16 supplied by Philips Lighting and the simulation models and results presented in this paper [18]
-
Rule #2: DfR needs model- and simulation-based quantification. It is evident from Figs. 18, 19, 20, 21, 22, 23, and 25 that every change in the physical recycling system and product design produces a different recovery. This resolution can provide an accurate picture to the designer of what the five LED designs have truly achieved.
-
Rule #3: Design data should be accessible and available in a consistent format, which is compatible with the detail required to optimize and quantify the recycling performance of products for all metals, materials and compounds present. Details and format of the product data on product material composition (including chemical compounds) and construction should have the resolution to quantify, identify and localize the commodity/critical/disturbing materials (see Figs. 6, 11). The precise simulation performed in this paper makes clear that if the LED mineralogy is presented in a format where it can be usefully used to calibrate simulation models, it will become very powerful to compare different LED designs.
-
Rule #4: Economically viable technology infrastructure and accurate tools must be in existence for executing industrial DfR rules and methodology. Design must be based on a robust physical separation and sorting infrastructure that is minimally capable of producing economically valuable recyclates (see Figs. 3, 10). A robust metallurgical infrastructure and system must be in place to ensure maximum recovery of all the “critical” materials from complex recyclates and dismantled functional sub-units of a product. Figure 4 illustrates the role of the metallurgical processing infrastructure, which takes up the different recyclates from dismantling and sorting. The Metal Wheel (Fig. 10) shows the destination (recovery/losses) of the different elements contained in an EoL product and different recyclates of physical recycling (where the quality of is design and sorting determined). The carrier metallurgical infrastructure (segment in the Metal Wheel) in which the recyclate will end up determines the recovery, losses and fugitive emissions of product recycling. Environmental footprint and eco-design should include the whole chain of processing to ensure that all materials, residues, fugitive emissions, losses are tracked (Fig. 3) in their true compositional “mineralogy”. This requires a suitable global policy be in place. Ultimately the overall metal recovery can be calculated as shown in Fig. 23 and 25 while at the same time extra dilution metal/virgin material can also be calculated to produce correct alloy qualities. This is of extreme importance when evaluating the environmental footprint.
-
Rule # 5: CAD, Process and System Design tools must be linked to recycling system process simulation tools to realize technology-based, realistic and economically viable DfR. Figure 4 and 17 show how CAD are rigorously linked to process metallurgy. DfR should minimally be linked in this way to process metallurgy in order to obtain a true picture of metal and material recycling as well as energy recovery and true environmental impact.


Five Possible DfR Guidelines as Derived from the Fundamental DfR Rules for LEDs
Various DfR guidelines can be derived by applying the above-listed fundamental DfR rules and principles (which should be iteratively checked by simulation and for validity, while being subject to a mindful consideration of product/component functionality). Recycling process simulation tools are used to define, validate and quantify the set of guidelines per product (of which the list below shows some possible guidelines). This physics-based approach can also set priorities between the different guidelines and quantify the necessity and potential result of DfR. Examples of these general guidelines can be found in Van Schaik and Reuter [18]. Through the implementation of the fundamental rules and simulation as a basis to derive and refine these, unique sets of guidelines are derived per product as a function of material mix and (BAT) recycling systems, including a mindful consideration of product functional demands (whereas a fixed set of all possible guidelines will leave no room for the designer to design/construct a product). In general, LEDs are rather complex products and it is shown that their recycling rate is rather low (Fig. 23, 25). A few design changes were included but in general the final metal recovery was relatively low. Following the guidelines, some general remarks can be made for LED lamps.
-
Guideline #6: Identify and minimize the use of materials, which will cause losses and contaminations in recycling due to material characteristics and behavior in sorting. Some redesigns can be made to improve aluminum recovery, but in general compact design limits the achievement of high recycling rates (Fig. 25).
-
Guideline #7: Identify components/clusters in a product, which will cause problems and losses in recycling due to combined and applied materials. A compatibility matrix (Fig. 26) can be derived per product based on the knowledge behind the Metal Wheel and is useful for a quick first screening. It is important to realize that compatibility tables are no DfR tool on their own, since they give no indication of RE, material recovery, losses or fugitive emissions.
-
Guideline #8: Design clusters or sub-units in products that can be easily removed and which match with the final treatment recycling options (i.e., Metal Wheel). Designing an LED in such a way that critical components are present on separable or removable parts or components is a rather big challenge for many of the elements in an LED.
-
Guideline # 9: Labeling (including carefully considered standardization) of products/components based on recovery and/or incompatibility so that they can be easily identified from recyclates and waste streams. Thus Design for Waste stream sorting or Design for (Automated) Dismantling/Sorting is important. For LEDs, this may be of limited value in general due to the compact design and complex “mineralogy” demanded by the LED functionality.
-
Guideline #10: Be mindful of liberation of materials in design (Design for Liberation). Simulation and knowledge on liberation behavior in relation to design, particulate and recyclate quality and recycling (metallurgical) efficiency is crucial (see Fig. 5). This was attempted in the redesign to an extent to liberate the aluminum, but even that did not produce sufficiently high recycling rates but improved slightly for certain redesigns (Fig. 25).
The Metal Wheel (Fig. 10) and the compatibility matrix (first developed for simple products, see [30]) shown in Fig. 26 for LEDs [18] indicate the consequences of design choices in a simple overview manner based on all the simulation results summarized in this paper. Simulation quantifies these more precisely in terms of recoveries, losses and emissions capturing the complexities and depth of recycling and metallurgical technology, its physics, chemistry and economics. Thus these compatibility tables are very product specific and should not be generalized as our original paper [30] may suggest, just as the Metal Wheel is a simplification of rather complex metallurgy of a complete infrastructure.
A quick analysis using standard MFA-based Ecodesign methodology [8] has shown that the recycling rates calculated for the five designs using such an approach is significantly higher than that estimated by the methodology in this paper. It is obvious that this produces no tangible design improvement suggestions to the design engineer.
Figure 27 compares by normalizing the estimated overall recycling rate shown in Fig. 25 with that produced by typical Ecodesign approaches based on MFA. The standard approach does not include the complexity of a “mineral” particle structure as shown by Fig. 6, but usually considers only the simplified recyclates types shown by the middle layer of Fig. 5. The results in Fig. 27 show that the standard Ecodesign approach does not produce consistent results compared to a more rigorous simulation approach.

A comparison of standard MFA-based approach to Ecodesign and the approach discussed in this paper (Fig. 25): (i) Left Normal allocation of streams to different metallurgies using a selected separation for all LEDs irrespective of material quality (grade and composition) and (ii) Right Using simulation-based physical separation for the simplified MFA recyclates and the same metallurgical recovery as for left-hand case
Both Figs. 27 and 28 show that not only the differences are significant and inconsistent and follow different trends, but for some designs also show an opposite recycling performance trend when comparing improved design with the original one. Figure 28 shows an example where the trend of recycling performance for some of the evaluated LED lamp redesigns points in different directions.

Comparison of the recycling performances between standard and simulation-based Ecodesign for original and redesigned LEDs
The marked inconsistent differences between the normal Ecodesign approach and that presented here would suggest that for Ecodesign to deliver its full value it must embrace the mineral complexity of recyclates as shown by the bottom layer of pictures in Fig. 5 and thence the particles separation efficiency in each unit operation of the flowsheet shown by Figs. 15 and 16. Standard MFA-based approaches neglect the effect of design determined particle composition on separation efficiency and recyclate quality. This is the key area for further research.
Policy Targets for Recycling and Ecodesign
Some policy targets and recommendation have been derived from these rules with regard to recycling and eco-design. These have been translated into a manifesto, which was handed over to the Dutch Lower Chamber [6]. With respect to LEDs, the following may be of importance:
-
design rules for LEDs should remain within what is physically, technologically and thermodynamically possible and hence be based on recycling process simulation tools and knowledge;
-
must be set in ways that account for the loss of metals from the LEDs due to mixing in products (for product functionality specifications);
-
should reflect the interest and expertise of all stakeholders in the product and recycling system and stimulate interaction of all parties in the LED recycling chain;
-
should respect the dynamic (time-varying) LED product characteristics and hence the recycling profile over time for all LED redesigns and innovations; and
-
should be set aligning with economic drivers.
Conclusions
DfRE demands product-centric knowledge of liberation behavior, particulate quality of recyclates, separation efficiency linked to the compatibility and thus recovery and/or loss of material in metallurgical processing. Ultimately, this detail is required to quantify and optimize recycling as defined for example in the Weeelabex standard [22] for WEEE.
It is evident from the discussion and recycling rate calculations that support the DfR rules (and guidelines) presented, that complexity can only be captured by simulation and modeling of products as a function of design choices, connection type, and connected materials. The HSC Sim simulation models for the LED lamp recycling presented provide a technology- and industrial-process driven basis for DfR to optimize RE and closure of material cycles.
This product-centric approach permits the optimal recovery of commodity, critical and scarce elements in complex consumer products, such as e-waste/WEEE as well as other complex products. This all should be read in line with the recent UNEP Metal Recycling report [3], which gives a detailed overview of metal recycling.
In view of the discussion on DfR in this paper, some points can be kept in mind when advancing the field of DfRE and DfR and the suggested more product-centric approach to it. Therefore, the greenprinting of recycling systems should consider the following:
-
develop as far as possible the description of the system on the basis of the theory that is already available from minerals and metals processing in order to optimize the systems as rapidly as possible, which drives the advancement of theory and fostering deeper understanding of the system and technology;
-
base recycling rate calculations and DfRE and DfR efforts and descriptions on rigorous process rather than simplistic material flow analysis approaches;
-
base environmental assessment on the rigor of industry applied process modeling, which will also drive the crucial improvement of environmental databases and hence the credibility of environmental calculations;
-
this rigorous simulation shows that LCA data is seriously deficient due to lacking data, hence questioning the published results for recycling systems and product design;
-
the rigor suggested by the DfR rules based on simulation ensures that research is focused on the issues that are of true value and will lead to true innovation;
-
understand the thermodynamics of the system as well as process kinetic and transfer process issues that may affect the outcome both technologically as well as economically;
-
understand the dynamics of the market as well as the available metallurgical infrastructure (internet-of-things) as these are key to extract metal value and thus maximize RE [31]; and
-
ultimately understand that DfR and Ecodesign should predict as part of its concrete output be able to quantify the possible recovery of major and minor elements, alloys, materials during design, from which economic as well as environmental information can be derived.
In summary, Greenprinting is a digitalized simulation basis for the rigorous discussion, optimization, and innovation within RE: ultimately, the goal of DfR and DfRE. It would further help to provide a further support to ecological footprint calculations [32], as simulation details each stream to the compound and species level, which is important for assessing environmental and toxicological aspects in detail. Digitalization in the form of simulation should be a key backbone of Ecodesign to get it closer to predicting true impact of product (re)designs. Thus, much like Knight and Jenkins [33] give a practitioner perspective, this paper gives a metallurgical and recycling process engineer perspective. Digitalization, as briefly presented in this paper, is the common language linking and harmonizing all actors. This harmonizes the discussion and bridges the gap between waste processing, metallurgical, OEMs and their CAD tools, resource recovery, materials science, recycling, environmental assessment among other things. It thus de-silos the industry, which is a prerequisite for a digitalized recycling and resource system resulting in an optimized greenprint of recycling system design and thus a key to System-Integrated Material Production. This should be a pressing outcome for the exciting but urgent innovation ahead of us. Society and taxpayers demand this of us to come up with techno-economically feasible solution and develop Ecodesign to its full potential.
Some of the research with regard to the application of the HSC models to the LED recycling trial has received funding from the ENIAC Joint Undertaking, under grant agreement no. 296127.
References
EC (2013) European Commission Decision C 8631 of 10 December 2013. HORIZON 2020 WORK PROGRAMME 2014-2015. Climate action, environment, resource efficiency and raw materials
Reuter MA, van Schaik A (2012) Opportunities and limits of recycling—a dynamic-model-based analysis. MRS Bull 37(4):339–347
UNEP (2013): Reuter et al. Metal recycling: opportunities, limits, infrastructure, United Nations Environmental Programme UNEP. http://www.unep.org/resourcepanel/Portals/50244/publications/Metal_Recycling-Full_Report_150dpi_130919.pdf. Accessed 22 Jan 2015
Luttropp C, Lagerstedt J (2006) EcoDesign and the ten golden rules: generic advice for merging environmental aspects into product development. J Clean Prod 14:1396–1408
EC (2009) DIRECTIVE 2009/125/EC OF THE EUROPEAN PARLIAMENT AND OF THE COUNCIL of 21 October 2009 establishing a framework for the setting of ecodesign requirements for energy-related products
NVMP/Wecycle (2013). Manifesto for the sustainable design of electronics: Recommendations for product design with efficient use of raw materials. Presented to Paulus Jansen, Chairman of the Infrastructure & Environment Commission in the Dutch Lower Chamber, at the Design for Recycling symposium held on 29th August 2013. http://www.nvmp.nl/onderzoek/design-for-recycling.html. Accessed 22 Jan 2015
Biemer J, Dixon W, Blackburn N (2013) Our environmental handprint the good we do, Institute of Electrical and Electronic Engineers. Presented at the 2013 IEEE Conference on Technologies for Sustainability
Vallet F, Eynard B, Millet D, Mahut SG, Tyl B, Bertoluci G (2013) Using eco-design tools: an overview of experts’ practices. Des Stud 34(3):345–377
Karlsson R, Luttropp C (2006) EcoDesign: what’s happening? An overview of the subject area of EcoDesign and of the papers in this special issue. J Clean Prod 14:1291–1298
Bonvoisin J, Lelah A, Mathieux F, Brissaud D (2014) An integrated method for environmental assessment and ecodesign of ICT-based optimization services. J Clean Prod 68:144–154
EC (2014) Communication from the commission to the European Parliament, the Council, the European Economic and Social Committee and the Committee of the Regions. Towards a circular economy: A zero waste programme for Europe, COM/2014/0398 final
HSC and HSC Sim 7.1&8 (1974–2014) Thermochemical and process simulation, Outotec Research Center, www.outotec.com
Finnveden G, Moberg A (2005) Environmental systems analysis tools—an overview. J Clean Prod 13:1165–1173
GaBi 6 (1992–2013) “Software and System Databases for Life Cycle Engineering”, Stuttgart-Echterdingen, www.pe-international.com
FACT Sage 6.4: ©CRCT 2006–2013—www.factsage.com
Reuter MA (1998) The simulation of industrial ecosystems. Miner Eng 11(10):891–917
Stamp A, Althaus H-J, Wäger PA (2013) Limitations of applying life cycle assessment to complex co-product systems: the case of an integrated precious metals smelter-refinery. Resour Conserv Recycl 80:85–96
Van Schaik A, Reuter MA (2014) Material-centric (aluminium and copper) and product-centric (Cars, WEEE, TV, Lamps, Batteries, Catalysts) recycling and DfR rules. In: Worrel E, Reuter MA (eds) Handbook of Recycling, Elsevier BV, Amsterdam, p 307–378
Reuter MA, Van Deventer JSJ (1990) The use of linear programming in the optimal design of flotation circuits incorporating regrind mills. Int J Miner Process 28:15–43
Chancerel P, Rotter S (2009) Recycling-oriented characterization of small waste electrical and electronic equipment. Waste Manag 29:2336–2352
Reuter M, Heiskanen K, Boin U, Van Schaik A, Verhoef E, Yang Y (2005) The metrics of material and metal ecology, harmonizing the resource, technology and environmental cycles. Elsevier BV, Amsterdam
WEEELABEX—WEEE Label of Excellence (2013) European Standards for Treatment and Recycling of E&E Waste and for Monitoring the Processing Companies LIFE07 ENV/B/000041
Verhoef E, Dijkema G, Reuter MA (2004) Process knowledge, system dynamics and metal ecology. J Ind Ecol 8(1–2):23–43
Huda N, Naser J, Brooks G, Reuter MA, Matusewicz RW (2012) Computational fluid dynamic modeling of zinc slag fuming process in top-submerged lance smelting furnace. Metall Trans B 43(1):39–55
Lu X, Nakajima K, Sakanakura H, Matsubae K, Bai H, Nagasaka T (2012) Thermodynamic estimation of minor element distribution between immiscible liquids in Fe–Cu-based metal phase generated in melting treatment of municipal solid wastes. Waste Manag 32:1148–1155
Braungart M, McDonough W, Bollinger A (2007) Cradle-to-cradle design: creating healthy emissions—a strategy for eco-effective product and system design. J Clean Prod 15:1337–1348
Van Schaik A, Reuter MA (2012) Shredding, sorting and recovery of metals from WEEE: linking design to resource efficiency. In: Goodship V, Stevels A (eds) Waste electrical and electronic equipment (WEEE) handbook, Woodhead Publishing Limited, Elsevier BV, Cambridge, p 163–211
Brunner PH, Rechberger H (2004) Practical handbook of material flow analysis. Lewis Publishers, New York. ISBN 1-56670-604-1
Bovea MD, Gallardo A (2006) The influence of impact assessment methods on materials selection for eco-design. Mater Des 27:209–215
Castro B, Remmerswal H, Boin U, Reuter MA (2004) A thermodynamic approach to the compatibility of materials combinations for recycling. Resour Conserv Recycl 43(1):1–19
Van Schaik A, Reuter MA (2004) The time-varying factors influencing the recycling rate of products. Resour Conserv Recycl 40(4):301–328
Huijbregts MAJ, Hellweg S, Frischknecht R, Hungerbühler K, Hendriks AJ (2008) Ecological footprint accounting in the life cycle assessment of products. Ecol Econ 64:798–807
Knight P, Jenkins JO (2009) Adopting and applying eco-design techniques: a practitioners perspective. J Clean Prod 17:549–558
Author information
Authors and Affiliations
Corresponding author
Rights and permissions
About this article

Cite this article
Reuter, M.A., van Schaik, A. Product-Centric Simulation-Based Design for Recycling: Case of LED Lamp Recycling. J. Sustain. Metall. 1, 4–28 (2015). https://doi.org/10.1007/s40831-014-0006-0
Published:
Issue Date:
DOI: https://doi.org/10.1007/s40831-014-0006-0