
Abstract
Shuozhou is a typical coal mining city, and the Pingshuo Antaibao open-pit coal mine in its area is one of the largest open-pit coal mines in China. The mining of coal resources is an important part of ensuring national energy security, and at the same time, it inevitably has a certain impact on the ecology, such as coal dust generated by open-pit mining will affect air quality, soil, water and vegetation. It is of great significance to explore the temporal and spatial variation of ecological environment quality in coal mining cities for ecological protection and sustainable social and economic development. Based on the Google Earth Engine (GEE) platform, this paper combines the index-based coal dust index (ICDI) and Remote Sensing Ecological Index (RSEI) models to construct an improved RSEI (IRSEI) that can reflect coal mining cities. This paper explores the spatial–temporal evolution characteristics and spatial correlation of ecological environment quality in Shuozhou from 2000 to 2020. The results showed that the average value of IRSEI in Shuozhou was between 0.262 and 0.418, and the overall change showed an upward trend. The growth areas of ecological environment quality are mainly located in the eastern and southwestern areas with good vegetation growth, and these regions have vigorously implemented the Northern Shelter Forest Project, afforestation and greening projects, implemented the forest resource management and protection responsibility system, promoted the construction of ecological civilization, and significantly improved the ecological environment. While the declining areas are mainly located in the central and southern regions where mining activities and human activities are more intensive. The IRSEI in the study area showed a significant spatial positive correlation, and the agglomeration types of the spatial pattern were mainly high-high and low-low agglomeration types, with the high-high agglomeration types mainly distributed in the eastern and southwestern regions, and the low-low agglomeration types distributed in the northern and south-central regions of the study area. The trend of low and low agglomeration has decreased, which further proves that the ecological restoration measures taken by the government, such as returning farmland to forests, integrating protection and restoration of mountains, waters, forests, fields, lakes, grasslands, and sands, controlling soil erosion, and stage wise reclamation of coal mining subsidence areas, have improved the ecological environment quality of Shuozhou. This study provides a reference for understanding the spatiotemporal changes of the ecological environment of coal mining cities, and is conducive to formulating appropriate ecological protection strategies.
Avoid common mistakes on your manuscript.
1 Introduction
Coal, as a non-renewable energy source, is an important resource for ensuring energy supply security and a crucial component supporting the rapid economic growth of numerous countries (Duo et al. 2022). Although coal mining activities drive regional social and economic development, they often come with a range of ecological issues, including land subsidence, fractures, landscape fragmentation, soil erosion, vegetation degradation, and dust pollution (Wang et al. 2022, 2023; Li et al. 2022; He et al. 2023). The most widely used methods for coal extraction are open-pit mining and underground mining (Yang et al. 2023). Among them, open-pit mining has one of the most direct and severe impacts on the ecological environment (Zhang et al. 2023), leading to direct destruction of natural surface ecosystems, intensified soil erosion, and increased occurrences of geological disasters such as landslides and mudslides. Additionally, the accumulation of coal gangue in open-pit mining areas and the substantial coal dust generated during the mining process are prone to spontaneous combustion, further compromising the local ecological environment and posing a threat to human health (Trechera et al. 2021; Zhao et al. 2023). With the rapid development of the socioeconomic landscape, the urgent challenge lies in coordinating the demands of coal mining activities with the sustainable development of society and the environment (Li et al. 2020). Therefore, scientifically and reasonably monitoring and analyzing the ecological environment quality in coal mining areas, understanding the trends and spatial distribution patterns of ecological environment quality, holds significant importance for regional ecological preservation and the sustainable development of society and the economy.
In recent years, remote sensing technology has been widely applied in the monitoring and assessment of ecological environment quality, and the open access to multisource remote sensing data has provided a new avenue for quantitative analysis of ecological environments (Pricope et al. 2019). Due to the complexity of ecosystems, the quality of the ecological environment is influenced by various factors, and relying solely on a single indicator cannot comprehensively reflect the state of the ecological environment (Zhang et al. 2022). To overcome the limitations of single indicators, many studies have adopted ecological indicators based on remote sensing data. These studies utilize Principal Component Analysis (PCA) to couple four indicators—greenness, wetness, dryness, and warmth—to evaluate regional ecological environment quality (Nie et al. 2021). Most researchers use the Normalized Difference Vegetation Index (NDVI) to represent greenness, bare soil index to represent dryness, and land surface temperature (LST) to represent warmth. By combining these with humidity indicators, they construct ecological remote sensing indicator systems, such as building RSEI on the Google Earth Engine (GEE) platform to monitor the spatiotemporal changes in the ecological environment quality of the Erhai Lake Basin (Xiong et al. 2021). Additionally, some scholars, building on this indicator system, combine building and bare soil indices to represent dryness, analyzing the ecological environment quality of the Changzhu Tan metropolitan area in central China from 2000 to 2020 (Zhang et al. 2022). By combining the Normalized Difference Bare Soil Index (NDBSI) and Salinity Index (SI) to represent dryness, they construct the RSEI for the core area of the Kashgar Delta, analyzing the evolution patterns of ecological quality over the past 30 years (Ju et al. 2023). Furthermore, Chen et al. constructed an ecological remote sensing indicator system using the Gross Primary Productivity (GPP) index representing greenness, studying the spatiotemporal changes in the ecological environment quality of Meizhou City (Chen et al. 2022).
Although the above evaluation indicators are widely used to assess regional ecological environment quality, most of these indicators are constructed based on non-resource-based. This study focuses on a coal mining city as the research area. During the coal mining process, a large amount of dust is generated, causing atmospheric pollution. Coal dust, through leaf surface dust deposition, affects photosynthesis and disrupts the biological functions of regional vegetation (Singh et al. 2021). Furthermore, as coal mining efficiency increases, the emission of coal mine dust also grows (Xu et al. 2023; Trechera et al. 2021), and under certain conditions, coal dust can lead to explosions (Miller et al. 2018), posing a serious threat to the ecological environment of the city and the safety of residents (Zhao et al. 2021; Wang et al. 2019). Therefore, incorporating dust factors into the ecological remote sensing indicator system for coal mining areas is more reasonable.
Compared to traditional methods of ecological quality assessment, GEE offers higher computational efficiency and accuracy (Duo et al. 2023). The GEE platform provides access to, analyzes, and visualizes a vast amount of geographical spatial data and related time-series data, with the advantages of short data processing time and wide processing scope. Utilizing GEE to assess regional ecological environment quality is an effective method (Zaki et al. 2023; Gorelick et al. 2017; Yi et al. 2023).
Shuozhou is located in the northern part of China and is an economically potent city in Shanxi Province, serving as a crucial coal production base. The Pingshuo Coal Mine is the largest open-pit coal mine, generating a substantial amount of dust during the open-pit mining process, impacting the city's ecological environment. With the improvement of open-pit coal mining efficiency, issues such as urban air pollution, vegetation degradation, and soil erosion have become increasingly severe. Shuozhou belongs to a coal mining city, most studies focus on non-resource-based cities, constructing ecological remote sensing indices using only greenness, dryness, wetness, and warmth, which lacks persuasiveness. Therefore, it is necessary to dynamically monitor the ecological environment quality of coal mining cities.
This study, based on the GEE platform, incorporates coal dust factors into the ecological remote sensing indicator system, enabling a more comprehensive assessment and analysis of the ecological environment quality in Shuozhou. The main objectives of the research include: (1) Building an improved ecological remote sensing index (IRSEI) suitable for evaluating the ecological environment of coal mining cities, integrating greenness (NDVI), wetness (WET), warmth (NDBSI), dryness (LST), and index-based coal dust index (ICDI). (2) Revealing the spatiotemporal evolution patterns of ecological environment quality in Shuozhou from 2000 to 2020. (3) Investigating the spatial correlation of ecological quality in Shuozhou through the application of Moran's I index and spatial clustering analysis. Establishing a scientifically sound ecological remote sensing indicator system is of paramount significance for promoting the sustainable development of the natural environment and socioeconomic aspects in coal mining cities.
2 Study area and data sources
2.1 Study area
Shuozhou (111°53′–113°34′E, 39°5′–40°17′N) is a provincial municipality in Shanxi Province. Shuozhou is located in northern China, northern Shanxi Province (Fig. 1). Shuozhou belongs to the temperate continental semi-arid monsoon climate, the average annual temperature is 6.9 °C, the rainfall is less, the precipitation is less, the annual rainfall is 423 mm, the average annual evaporation is 1609.8 mm. Shuozhou as a whole is a loess-covered mountain terrain plateau, with complex and diverse natural conditions, due to the arid climate, sparse and single vegetation, and the ecological environment foundation is weak. In terms of social development, Shuozhou has a population of about 1,590,700 and a permanent urban population of 1,005,800 (urbanization rate of 63.23%). In 2022, Shuozhou will achieve a GDP of 153.62 billion yuan. According to the Shuozhou Energy Statistical Yearbook, Shuozhou produced 216 million tons of coal, accounting for 16.5% of the province's total output. Pingshuo Coal Mine is the largest and most technologically advanced open-pit coal mine in China, including Antaibao Coal Mine, Anjialing Coal Mine and East Open-pit Coal Mine, with an annual coal output of 45 million tons (Li et al. 2023; Nie et al. 2022). The complex natural geographical conditions and frequent coal mining activities have further damaged the local ecological environment, and the area has become one of the most serious areas of coal dust pollution and spontaneous coal combustion in Shanxi Province, accompanied by vegetation degradation and soil erosion (Li et al. 2021a, b; Xin et al. 2022; Li et al. 2021a, b; Shi et al. 2021). In summary, Shuozhou can be used as a typical research area for the evaluation of ecological environment quality of coal mining cities.

Study area
2.2 Data sources
The 2020 vector map data in this study were obtained from the National Geographic Information Resource Catalog Service System (https://www.webmap.cn/), with a spatial resolution of 1:1,000,000. Landsat remote sensing images were obtained from the GEE platform (https://earthengine.google.com/), with a spatial resolution is 30 m, the temporal resolution is 16 days, and the time span is 2000–2020. It includes the surface reflectance image data of Landsat 5(TM) and Landsat 8(OLI), which have been radiometrically corrected, atmospherically corrected, and geometrically corrected. Due to incomplete data being found on the GEE platform for Landsat7 in 2012, the data for 2012 is missing. The MODIS image data from GEE (https://earthengine.google.com/), were selected for the study, with a spatial resolution of 1000 m, a temporal resolution of 8 days, and a time span of 2000–2020. The data processing process mainly includes cloud mask processing, cropping, splicing, and calculation of IRSEI data for the Landsat image data of the whole year. Among them, the processing of Landsat image data is carried out in Google Earth Engine (GEE).
3 Methodology
During the period from 2000 to 2020, China's economy developed at a high speed, and during this period, Shuozhou actively promoted the strategy of "ecological city, stable coal and new development", and practiced the concept of ecological priority and green development. A comparative analysis of the changes in ecological quality over this 20-years period can provide a basis for assessing the ecological quality of Shuozhou and assist in the formulation of planning strategies for the city.
This study consists of three main steps (Fig. 2): (1) The study area is a coal minging city. This paper constructs the IRSEI model based on the GEE platform by adding the index-based coal dust index on top of the four major indicators of green, wet, hot, and dry. (2) Based on the univariate linear regression trend analysis and F-test, we analyzed the spatial and temporal evolution characteristics of ecological quality in Shuozhou for a total of 10 years, from 2000 to 2020. (3) The spatial correlation of ecological quality in Shuozhou was analyzed by using the Moran’s I index and local spatial correlation index to analyze the spatial correlation of ecological quality in Shuozhou.

Flow chart
3.1 Construct RESI model based on GEE
Green, humidity, heat and dryness are closely related to the quality of the ecological environment, and this comprehensive construction of RSEI model can reflect the quality of the ecological environment. To avoid dimensional inconsistency, normalize the four indicators of greenness, humidity, heat, and dryness before coupling RSEI.
In the formula: N is the normalized result, \({N}_{i}\) is the value of the i-th pixel, and \({N}_{\text{max}}\) and \({N}_{\text{min}}\) are the maximum and minimum values of the pixel, respectively.
The information of the four indicators of greenness, humidity, heat, and dryness is integrated through principal component transformation, and \({\text{RSEI}}_{0}\) is constructed from the first principal component PC1, which represents the main information of the four indicators. RSEI is obtained after normalizing \({\text{RSEI}}_{0}\). The closer the RSEI value is to 1, the better the ecological environment quality is.
In the formula, NDVI represents green index, WET represents humidity index, LST represents heat index, and NDBSI represents dryness index. \({\text{RSEI}}_{0\text{max}}\) and \({\text{RSEI}}_{0\text{min}}\) represent the maximum and minimum values of \({\text{RSEI}}_{0}\), respectively (Table 1).
3.2 Improved IRSEI model construction
RSEI integrates various factors such as greenness, humidity, heat and dryness, and can reflect the spatial dynamic change characteristics of ecological environment. However, it is only applicable to specific environments, such as in cities dominated by human activities, or river and lake basins with natural ecological scenarios. It is not suitable for coal regions, so there is room for optimization and improvement. The city of Shuozhou in Shanxi has one of the largest open-pit mines in China, and its ecological quality is deeply affected by the coal dust generated during the production process. Therefore, the application of RSEI in this study should be improved and the index-based coal dust index (CDI) should be used as one of the indicators to construct IRSEI.
3.2.1 Index-based coal dust index
Shuozhou, Shanxi Province has the largest and most technologically advanced open-pit coal mine in China, and its open-pit mining method is extremely destructive to the ground surface and the environment. During the operation, the coal dust produced in the mine causes serious air pollution, so the local ecological situation cannot be better represented by simply using the RSEI model. Nie et al. (2022) constructed the index-based coal dust index (ICDI) in their study, which can better quantify the coal dust pollution index . Combined with the climate of Shuozhou and the pollution problems generated by surface coal mines in the production process, we used the index-based coal dust index as the fifth index to construct the IRSEI model in this study. Its calculation formula is as follows:
where, \({\rho }_{i}\) is the reflectivity of the TM, ETM + , and OLI sensors in each band, respectively.
3.2.2 IRSEI model construction
The IRSEI ecological index is a coupling of five indicators, namely, the vegetation index (NDVI), the humidity component (WET), the surface temperature (LST), the dryness index (NDSI), and the index-based coal dust index (ICDI), by using principal component analysis. In order to reduce the influence of subjective factors, this study firstly normalized the contribution of each indicator's respective eigenvalue as its weight, i.e., the magnitude was unified between [0, 1]. The 1st principal component after principal component transformation was selected as the initial drought remote sensing index (IRSEI), and the drought remote sensing index (IRSEI) was obtained through normalization. Where the closer the IRSEI index is to 1, the better the ecological quality is, and the opposite is worse. The formula is as follows:
where: \({\text{MRSEI}}_{0}\) is the initial drought remote sensing index; \(\text{MRSEI}\) is the normalized drought remote sensing index; \({\text{MRSEI}}_\text{0min}\) is the minimum value of the initial ecological index; \({\text{MRSEI}}_\text{0max}\) is the maximum value of the initial ecological index.
3.3 Trend analysis method
Linear regression is to find a straight line and make this line fit the data points in the graph as much as possible. In order to derive the spatial trend of ecological environmental quality in Shuozhou from 2000 to 2020, the IRSEI index was chosen in this study for the one-dimensional linear regression analysis, with the formula:
where \({\theta }_\text{slope}\) is the trend of x-indicator in 2000–2020, \(n\) is the number of monitoring years10, \(i\) is the year, and \({x}_{i}\) is the value of x-indicator in the i-th year. The F-test after linear regression is used to test the significance of the linear equation as a whole, i.e., whether the trend of IRSEI in Shuozhou from 2000 to 2020 is significant. The formula is.
where \(U={\sum }_{i=1}^{n}{(\widehat{y}-\overline{y })}^{2}\) is called the sum of error squares; \(Q={\sum }_{i=1}^{n}{({y}_{i}-\widehat{y})}^{2}\) is called the regression sum of squares; \({y}_{i}\) is the pixel value of the i-th year, \(\widehat{y}\) is the regression value of it, \(\overline{y }\) is the mean value of the IRSEI during the testing period, and \(n\) is the number of years of monitoring. Based on the results of the test, the trend of the change is divided into five classes: highly significant improvement \(({\theta }_\text{slope}>0,{F}>{F}_{\alpha }=0.01)\); significant improvement \({(\theta }_\text{slope}>0,{F}_{\alpha }=0.05<F\le {F}_{\alpha }=0.01)\); basically unchanged \((F\le {F}_{\alpha }=0.05)\); highly significant degradation \((<0,{F}>{F}_{\alpha }=0.01)\); significant degradation \({(\theta }_\text{slope}<0,{F}_{\alpha }=0.05<F\le {F}_{\alpha }=0.01\)).
3.4 Spatial correlation
In order to study the spatial correlation between the distribution of different elements in the region, local spatial autocorrelation is used to characterize the overall agglomeration in the region, and the global Moran index is used to characterize the degree of correlation. Its calculation formula is as follows:
where \({I}_{i}\) is the local Moran' I index, \(n\) is the number of cities in the study area, and \({W}_{ij}\) represents the proximity relationship between the ith cell and the jth cell in the spatial weight matrix established based on spatial connectivity.
I refers to the global Moran's index, which takes the value of [-1, 1], Moran' I > 0 indicates positive association, Moran' I < 0 indicates negative association, and Moran' I = 0 indicates that each area is randomly distributed. With the help of GeoDa software, LISA clustering map (Iocal Indicator of spatial association) was plotted on the basis of Z-value test (P = 0.05) to reflect the spatial dependence and correlation between the degree of socioeconomic development and ecosystem services. The outputs included: high value clustering (HH), low value clustering (LL), high and low clustering (HL), low and high clustering (LH), and no correlation (NN).
4 Results
4.1 Validity of the IRSEI model
To verify the applicability of IRSEI to the actual situation in Shuozhou, a comparative analysis was conducted between IRSEI, RSEI, and satellite imagery (Fig. 3). It can be seen that the trends of IRSEI and RSEI in Zone B and Zone C are basically the same, and the changes of high—low values of IRSEI are also basically the same as the trends of greenland—dryland changes in the field in satellite images. It proves that IRSEI can basically reflect the high-low change of ecological environment quality distribution. Coal mining can cause a series of ecological and environmental problems (Wu et al. 2021), and coal dust factors can effectively express the degree of pollution caused by coal dust to the region (Nie et al. 2022; Liu et al. 2023). After adding index-based coal dust index to the remote sensing ecological index, the improved remote sensing ecological index can better reflect the impact of coal mines on ecological environment quality. Therefore, compared with RSEI, IRSEI is more sensitive to identifying the ecological environment quality of coal mining areas (Zone A) and more accurate in judging local details of coal mining areas. IRSEI's performance in low value areas of coal mining areas is clearer, better highlighting the local contour characteristics and distribution pattern of ecological environment quality distribution in coal mining areas. Overall, after adding the index-based coal dust index, IRSEI is more applicable to the actual situation of Shuozhou compared with RSEI.

Comparison of local details between the RSEI and IRSEI
4.2 Analysis of spatial and temporal variation of the IRSEI
Figures 4 and 5 shows the spatial and temporal changes of IRSEI in Shuozhou between 2000 and 2020, and the annual average IRSEI in Shuozhou is characterized by fluctuating changes. As a whole, the annual average IRSEI value of Shuozhou increased from 0.351 in 2000 to 0.389 in 2020, an increase of 10.83%. Among them, the lowest value is 0.262 in 2004, and the highest value is 0.418 in 2017. The whole time series can be roughly divided into two segments, with a roughly upward trend from 2000 to 2009, and a slight decrease from 2010 to 2020, but the decrease is not significant. In addition, the fitting reveals that the change of IRSEI in Shuozhou has an overall upward trend. Overall, the ecological environmental quality of Shuozhou shows a fluctuating upward trend during the 20-year period. And spatially, the areas with higher ecological environment quality in Shuozhou are mainly distributed in the western area, part of the northern area and part of the eastern area. The vegetation growth in these areas is fine, which will increase the value of IRSEI. And compared with 2000, the high value areas of IRSEI value in 2020 have increased, that is, the areas with better ecological environment quality have increased.
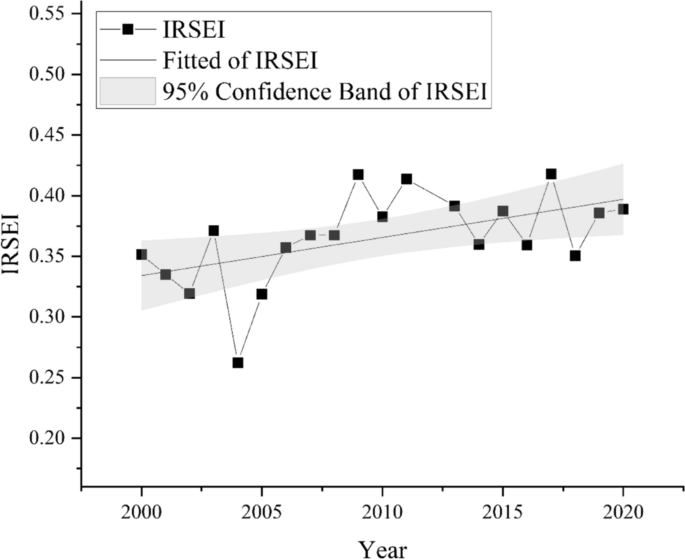
Interannual change in the IRSEI in Shuozhou from 2000 to 2020

Spatial distribution of the IRSEI from 2000 to 2020
In order to further study the changes in the ecological environmental quality in Shuozhou, the trend analysis method was used to analyze the trend of the ecological environmental quality in Shuozhou (Fig. 6). When the change trend value is greater than zero, it indicates that the ecological environmental quality has an improving trend, while when the change trend value is less than zero, it indicates that the ecological environmental quality has a degrading trend. The IRSEI in most areas of Shuozhou is on the rise, which may be related to the ecological restoration measures implemented by Shuozhou, such as integrated protection and restoration of mountains, rivers, forests, fields, lakes, grasslands, and sands, soil erosion control, and phased reclamation of coal mining subsidence areas. Especially in most of the forest growing areas, there is a trend of improvement in the ecological environment quality in Shuozhou. On the one hand, this is because forest land has a good protective effect on the ecological environment quality, and on the other hand, it also proves that the forest land protection measures such as returning farmland to forest, protective forest projects, afforestation and greening projects in Shuozhou have effectively promoted local forest land construction, resulting in an improvement in ecological quality. The south-central area has a more obvious degradation trend, which is a densely populated area and also the location of the mining area, where human activities and mining activities may have a certain impact on the quality of the ecological environment.

Spatial change trend of the IRSEI in Shuozhou from 2000 to 2020
Combining significance analysis, calculate the proportion of different types of change trends in terms of area (Fig. 7, Table 2). It can be seen that the proportion of areas with basically unchanged ecological environment quality in Shuozhou is the highest (61.747%). The proportion of highly significant degradated areas is the smallest (0.758), mainly distributed in the central and southern regions, which are greatly affected by human disturbances. The development of urbanization may be one of the reasons for the degradation of ecological environment quality. The areas with highly significant improvement and significant improvement can account for more than one-third (36.685%) of the total area of the region. These areas have good vegetation growth and strong self-regulation and restoration capabilities of the ecosystem. Overall, the area of areas with improved ecological environment quality in Shuozhou is much larger than that of degraded areas, and the overall ecological environment quality in Shuozhou is showing a positive trend. This also proves that the implementation of policies such as pollution prevention and control, green and low-carbon transformation in Shuozhou has achieved certain results.

Spatial distribution of significant IRSEI values in Shuozhou from 2000 to 2020
4.3 Spatial correlation analysis of ecological environment quality
From the results of the global Moran's I index of ecological environmental quality in Shuozhou (Table 3), it can be seen that during the study period, the global Moran's I indexes were all greater than 0.79, with an overall upward trend, a P value of less than 0.01, and a Z value of greater than 2.58, all of which passed the significance test. This indicates that there is a significant positive spatial correlation of ecological environmental quality in Shuozhou between 2000 and 2020. In 2005, Moran's index value was the highest (0.8474), which indicated that IRSEI was highly spatially clustered.In 2020, Moran's index value decreased to the lowest (0.7926), which indicated that the IRSEI is spatially clustered to a lesser extent and ecological patches are gradually fragmented.
A local spatial autocorrelation analysis was conducted on the ecological environment quality of Shuozhou. The local spatial characteristics of Shuozhou's ecological environment quality (Fig. 8) indicate that Shuozhou mainly exhibits five spatial characteristics: high high clustering, high low clustering, low low clustering, low high clustering, and no significance. The local Moran's I index of IRSEI is mainly distributed in the first and third quadrants, which are "high high" and "low low" clustering types, and IRSEI shows spatial positive correlation; The number of "low high" and "high low" types distributed in the second and fourth quadrants is relatively small, and there is a phenomenon of polarization.

The 2000–2020 LISA agglomeration map in Shuozhou. a Scatter chart of local Moran's I index b LISA cluster diagram
Study the spatial local autocorrelation distribution of IRSEI in five periods, including 2000, 2005, 2010, 2015, and 2020, using LISA clustering maps. The spatial pattern of ecological environment quality in Shuozhou from 2000 to 2020 was mainly characterized by high-high and low-low clustering types. The high-high clustering types were mainly distributed in the eastern and southwestern regions, with some expansion in the southeastern region but limited growth, resulting in a certain spatial spillover effect. The growth of forest land in the high-high clustering areas was relatively dense, with high humidity and greenness levels; Low-low set clustering is distributed in the northern and central southern regions of the study area, and spreads along the periphery. During the research period, the clustering of low-low sets in some northern regions decreased, and the ecological environment quality in this area also showed an upward trend, which is consistent with previous research results. The dryness and heat levels in the areas where low-low clustering types are located are relatively high. In the future, attention should be paid to the dryness and heat effects caused by economic development and mining area construction, improve the layout of urban ecological space, and comprehensively enhance the level of urban humidity and greenness.
4.4 Analysis of changes in index-based coal dust index (ICDI)
The annual average variation of index-based coal dust index (ICDI) in Shuozhou is shown in Fig. 9. Through fitting, it is found that from 2000 to 2020, ICDI in Shuozhou showed a fluctuating downward trend. This proves that the coal dust pollution situation in Shuozhou has weakened over the past 21 years. After conducting a significant analysis of the trend of ICDI changes (Fig. 10), it was found that ICDI in most areas of Shuozhou showed a trend of degradation, which further proves that the measures implemented in Shuozhou, such as ecological restoration of mines, carbon reduction and pollution reduction, upgrading of coal chemical industry, and energy conservation and carbon reduction projects in key areas, have effectively promoted the control of coal dust pollution in Shuozhou. After comparing the significance of ICDI with the significance of IRSEI (Fig. 7), it was found that when the IRSEI in the northern and eastern parts of Shuozhou showed an upward trend, ICDI showed a downward trend, while the IRSEI in the central and southern parts showed a downward trend, but the index-based coal dust index in this area showed an upward trend. Overall, the trend of ICDI is opposite to that of IRSEI in most areas, which also proves that coal dust pollution may have an impact on the quality of ecosystems.
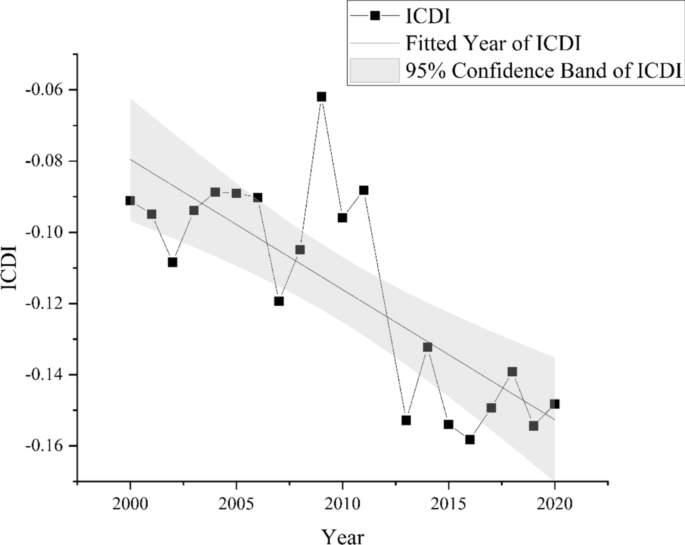
Interannual change in the ICDI in Shuozhou from 2000 to 2020

Spatial distribution of significant ICDI values in Shuozhou from 2000 to 2020
5 Discussion
5.1 Advantages of the IRSEI
In recent years, many researchers have widely applied RSEI to assess the ecological quality of non-resource-based cities (An et al. 2022; Yuan et al. 2021) to provide information for the development of environmental protection and governance measures. Shuozhou is a typical coal mining city, and the Pingshuo Coal Mine is the largest open-pit coal mine in Shuozhou, while coal dust is the largest source of dust from open-pit coal mines. Coal dust affects the quality of the atmosphere, soil, water bodies, and vegetation, causing major environmental hazards in and around the host city and posing a great threat to human life and health (Xu et al. 2023; León-Mejía et al. 2023). It has been found that the coal dust factor can effectively express the degree of regional pollution by coal dust (Nie et al. 2022; Liu et al. 2023). Therefore, in this study, representative coal dust factors were selected to improve RSEI according to the ecological characteristics of Shuozhou.The improved IRSEI model was created by greenness (NDVI), humidity (Wet), dryness (NDBSI), heat (LST) and index-based coal dust index (ICDI). In this paper, the dynamic monitoring and assessment of the ecological environment quality in Shuozhou was conducted for 20 years based on the IRSEI model with the help of the GEE platform, and the results showed that the improved IRSEI model better reflected the ecological environment quality in the study area, which was more obvious in the coal mining area, the vegetation cover area and the built-up area. Overall, the inclusion of the coal dust factor in the IRSEI helps to quickly realize the analysis of the ecological environment quality in coal minging cities.
5.2 Changes in the IRSEI
From 2000 to 2020, the quality of Shuozhou's ecological environment showed a wave-like upward trend. This is similar to the results of other studies in the same region. For example, Gong et al. established an ecological remote sensing index for the past 20 years (2000–2020) in Shanxi Province, analyzed the factors affecting the quality of local ecosystems, and found that the overall ecological environment quality in Shanxi Province improved, and the average RSEI index increased from 0.48 to 0.57 (Gong et al. 2023). This is because ecological restoration projects such as air, water, soil, and vegetation have been carried out in the past 20 years, which has increased the vegetation coverage rate and improved the quality of the ecological environment (Yang et al. 2022). In order to restore ecological vegetation and reduce soil erosion, so as to improve the quality of the ecological environment in Shuozhou, the Shuozhou government coordinated the integrated protection and restoration of mountains, rivers, forests, fields, lakes, grasslands and sands, conscientiously organized and implemented key ecological projects such as returning farmland to forests, and vigorously promoted ecological restoration and soil erosion control, especially the phased reclamation of coal mining subsidence areas (Shuozhou.2023). This further indicates that the overall quality of the ecological environment in Shuozhou has been improved through the implementation of these measures to protect and restore the urban ecological environment, and also confirms the credibility of the results of this study.
5.3 Limitations and prospects
In this study, the RSEI was improved by selecting the index-based coal dust index, and the ecological environment quality assessment model was formed, and the ecological environment quality of the cities polluted by dust from open-pit coal mines was evaluated, so as to enrich the research on the ecological environment quality of coal mining cities. However, there are some shortcomings. Since this study is completely based on remote sensing data, due to the influence of the resolution and quality of remote sensing image data, it is inevitable that there will be some errors in the constructed remote sensing images. In addition, there are not only natural factors but also human factors that affect the urban ecosystem, so there are many aspects that need to be considered in evaluating the ecological environment quality of coal mining cities. However, the IRSEI model in this study only integrates greenness, temperature, humidity, dryness, heat, and index-based coal dust index, and does not analyze human activities, GDP, nighttime lighting, land use and other related factors, and explores the coupling effects of these factors. In the future research, the various impacts of the above influencing factors on the ecological environment should be fully considered, and the RSEI should be improved with more comprehensive and effective indicators, and the changes of ecological environment quality of coal mining cities should be studied, so as to further explore the interaction between human factors and ecological environment quality.
6 Conclusions
This study is based on the characteristics of coal minging cities in Shuozhou, and introduces the index-based coal dust index into the traditional RSEI model to construct the IRSEI model, in order to explore the spatiotemporal changes in the ecological environment quality of Shuozhou. To provide theoretical basis for the coordinated development of economic construction and ecological environment in Shuozhou, and promote high-quality urban construction and development.
Compared with traditional RSEI models, IRSEI is more suitable for ecological environment quality assessment in Shuozhou. During the research period, the ecological environment quality in Shuozhou showed a fluctuating upward trend. From 2000 to 2020, the IRSEI in the study area showed a significant spatial positive correlation. There is a clustering trend, and the clustering types of IRSEI spatial pattern are mainly high-high and low-low clustering types. High-high clustering types show a growth trend while Low-low clustering types show a decreasing trend, which further indicates that the ecological environment quality of Shuozhou has improved.The environmental protection work in Shuozhou has achieved results.
References
An M, Xie P, He WJ, Wang B, Huang J, Khanal R (2022) Spatiotemporal change of ecologic environment quality and human interaction factors in three gorges ecologic economic corridor, based on RSEI. Ecol Ind 141:109090
Chen ZY, Chen RR, Guo Q, Hu LY (2022) Spatiotemporal change of urban ecologic environment quality based on RSEI—taking Meizhou City, China as an example. Sustainability 14(20):13424
Duo LH, Hu ZQ, Yang K et al (2022) Sediment settlement rate and consolidation time of filling reclamation in coal mining subsidence land. Int J Coal Sci Technol 9(3):15
Duo LH, Wang JQ, Zhang FQ, Xia YP, Xiao S, He BJ (2023) Assessing the spatiotemporal evolution and drivers of ecological environment quality using an enhanced remote sensing ecological index in Lanzhou City, China. Remote Sensing 15(19):4704
Gong C, Lyu FN, Wang YL (2023) Spatiotemporal change and drivers of ecosystem quality in the Loess Plateau based on RSEI: a case study of Shanxi China. Ecol Indicat 155:11060
Gorelick N, Hancher M, Dixon M, Ilyushchenko S, Thau D, Moore R (2017) Google earth engine: planetary-scale geospatial analysis for everyone. Remote Sens Environ 202:18–27
He TT, Zhang MX, Guo AD, Zhai G, Wu CF, Xiao W (2023) A novel index combining temperature and vegetation conditions for monitoring surface mining disturbance using Landsat time series. CATENA 229:107235
Ju XF, He JL, Zhang Q, Staitiniyazi A (2023) Evolution pattern and driving mechanism of eco-environmental quality in arid oasis belt—A case study of oasis core area in Kashgar Delta. Ecol Ind 154:110866
León-Mejía G, Vargas JE, Quintana-Sosa M, Rueda RA, Pérez Pérez J, Miranda-Guevara A, Moreno OF, Trindade C, Acosta-Hoyos A, Dias J, Silva JD, Henriques JAP (2023) Exposure to coal mining can lead to imbalanced levels of inorganic elements and DNA damage in individuals living near open-pit mining sites. Environ Res 227:115773
Li SC, Xiao W, Zhao YL, Lv XJ (2020) Incorporating ecological risk index in the multi-process MCRE model to optimize the ecological security pattern in a semi-arid area with intensive coal mining: a case study in northern China. J Clean Prod 247:119143
Li L, Zhang R, Sun J, He Q, Kong L, Liu X (2021a) Monitoring and prediction of dust concentration in an open-pit mine using a deep-learning algorithm. J Environ Health Sci Eng 19:401–414
Li S, Wang J, Zhang M, Tang Q (2021b) Characterizing and attributing the vegetation coverage changes in North Shanxi coal base of China from 1987 to 2020. Resour Policy 74:102331
Li YN, Duo LH, Zhang M et al (2022) Habitat quality assessment of mining cities based on InVEST model—a case study of Yanshan County, Jiangxi Province. Int J Coal Sci Technol 9(1):28
Li H, Wang DD, Du WK, Gong Y (2023) Study on the prediction of blasting vibration speed and safe allowable distance in Anjialing coal mine. Coal Eng 55(10):156–161
Liu Y, Xu PP, Bi YL, Yue H, Peng SP, Han Y, Jiang KS (2023) Quantitative analysis of coal mining disturbance on environment in Xinjiang Gobi Open-pit mining area. J China Coal Soc 48(2):959–974
Miller J, Schafler J, Mulligan P, Eades R, Perry K, Johnson C (2018) Explosive dust test vessel comparison using pulverized Pittsburgh coal. Arch Min Sci 63(3):713–726
Nie XR, Hu ZQ, Zhu Q, Ruan MY (2021) Research on temporal and spatial resolution and the driving forces of ecological environment quality in coal mining areas considering topographic correction. Remote Sensing 13(14):2815
Nie XR, Hu Z, Ruan M, Zhu Q, Sun H (2022) Remote-sensing evaluation and temporal and spatial change detection of ecological environment quality in coal-mining areas. Remote Sens 14:345
Pricope NG, Mapes KL, Woodward KD (2019) Remote sensing of human–environment interactions in global change research: A review of advances, challenges and future directions. Remote Sensing 11(23):2783
Shi W, Wang J, Li X, Xu Q, Jiang X (2021) Multi-fractal characteristics of reconstructed landform and its relationship with soil erosion at a large opencast coal-mine in the loess area of China. Geomorphology 390:107859
Shuozhou, Shanxi: Cultivating the Ecological Background of High-quality Development Shuozhou Daily 2023–11–11,004, News.
Singh S, Pandey B, Roy LB, Shekhar S, Singh RK (2021) Tree responses to foliar dust deposition and gradient of air pollution around opencast coal mines of Jharia coalfield, India: gas exchange, antioxidative potential and tolerance level. Environ Sci Pollut Res 28:8637–8651
Trechera P, Moreno T, Córdoba P, Moreno N, Zhuang XG, Li BQ, Li J, Shangguan YF, Dominguez AO, Kelly F, Querol X (2021) Comprehensive evaluation of potential coal mine dust emissions in an open-pit coal mine in Northwest China. Int J Coal Geol 235:103677
Wang PF, Tan XH, Zhang LY, Li YJ, Liu RH (2019) Influence of particle diameter on the wettability of coal dust and the dust suppression efficiency via spraying. Process Saf Environ Prot 132:189–199
Wang ZM, Zhou W, Jiskani IM, Luo HT, Ao ZC, Mvula EM (2022) Annual dust pollution characteristics and its prevention and control for environmental protection in surface mines. Sci Total Environ 852:153949
Wang HY, Zhou W, Guan YJ, Wang J, Ma RR (2023) Monitoring the ecological restoration effect of land reclamation in open-pit coal mining areas: An exploration of a fusion method based on ZhuHai-1 and Landsat 8 data. Sci Total Environ 904:166324
Wu ZH, Lei SG, Yan QW, Bian ZF, Lu QQ (2021) Landscape ecological network construction controlling surface coal mining effect on landscape ecology: a case study of a mining city in semi-arid steppe. Ecol Ind 133:108403
Xin H, Sun J, Tian W, Zhou B, Tang Z, Qi XY, Di CC, Zhong XX, Wang DM (2022) The structural transformation and reburning characteristics of gas coal in Ningwu coalfield fire. Energy Explor Exploit 40:79–96
Xiong Y, Xu WH, Lu N, Huang SD, Wu C, Wang LG, Dai F, Kou WL (2021) Assessment of spatial–temporal changes of ecological environment quality based on RSEI and GEE: a case study in Erhai Lake Basin, Yunnan province China. Ecol Ind 125:107518
Xu XC, Gu XW, Wang Q, Zhao YQ (2023) Ultimate pit optimization with environmental problem for open-pit coal mine. Process Saf Environ Prot 173:366–372
Yang Z, Zhan JY, Wang C, Twumasi-Ankrah MJ (2022) Coupling coordination analysis and spatiotemporal heterogeneity between sustainable development and ecosystem services in Shanxi Province, China. Sci Total Environ 836:155625
Yang JH, Wei HX, Quan ZL, Xu R, Wang ZH, He HL (2023) A global meta-analysis of coal mining studies provides insights into the hydrologic cycle at watershed scale. J Hydrol 617:129023
Yi SQ, Zhou Y, Zhang JD, Li Q, Liu YY, Guo YT, Chen YQ (2023) Spatial-temporal evolution and motivation of ecological vulnerability based on RSEI and GEE in the Jianghan Plain from 2000 to 2020. Front Environ Sci 11:1191532
Yuan BD, Fu LN, Zou YA, Zhang SQ, Chen XS, Li F, Deng ZM, Xie YH (2021) Spatiotemporal change detection of ecological quality and the associated affecting factors in Dongting Lake Basin, based on RSEI. J Clean Prod 302:126995
Zaki A, Buchori I, Pangi P, Sejati WA, Liu Y (2023) Google earth engine for improved spatial planning in agricultural and forested lands: a method for projecting future ecological quality. Remote Sensing Appl Soc Environ 32:101078
Zhang Y, She JY, Long XR, Zhang M (2022) Spatio-temporal evolution and driving factors of eco-environmental quality based on RSEI in Chang-Zhu-Tan metropolitan circle, central China. Ecol Ind 144:109436
Zhang CY, Li FY, Li J, Zhang K, Ran WY, Du MH, Guo JT, Hou GF (2023) Assessing the effect, attribution, and potential of vegetation restoration in open-pit coal mines’ dumping sites during 2003–2020 utilizing remote sensing. Ecol Ind 155:111003
Zhao WJ, Yan TT, Ding X, Peng SZ, Chen HN, Fu YC, Zhou Z (2021) Response of ecological quality to the evolution of land use structure in Taiyuan during 2003 to 2018. Alex Eng J 60(1):1777–1785
Zhao PX, Zhuo RS, Li SG, Lin HF, Shu CM, Shuang HQ, Wei ZY (2023) Greenhouse gas protection and control based upon the evolution of overburden fractures under coal mining: a review of methods, influencing factors, and techniques. Energy 284:129158
Acknowledgements
This research was funded by the National Natural Science Foundation of China (42377472, 42174055), Jiangxi Provincial Social Science Foundation Project (23GL34), Humanities and social science research project of universities in Jiangxi Province (GL22228), Open Fund of Key Laboratory of Mine Environmental Monitoring and Improving around Poyang Lake of the Ministry of Natural Resources (MEMI-2021-2022-28), Science and Technology Research Project of Jiangxi Provincial Department of Education (GJJ2200741), the Graduate Innovation Fund of Jiangxi (YC2023-S557), and the Doctoral Research Initiation fund of East China University of Technology (DHBK2019184).
Author information
Authors and Affiliations
Contributions
Conceptualization, L.D., J.W. and Y.Z.; methodology, C.J.; software, J.W. and Y.C.; valida-tion, L.D. and J.W.; data curation, J.W. and X.G.; writing—original draft preparation, L.D., J.W., Y.Z. and C.J.; writing—review and editing, L.D. and J.W.; funding acquisition, L.D. and X.G.. All authors have read and agreed to the published version of the manuscript.
Corresponding author
Ethics declarations
Competing interests
The authors declare that they have no competing interests.
Additional information
Publisher’s Note
Springer Nature remains neutral with regard to jurisdictional claims in published maps and institutional affiliations.
Rights and permissions
Open Access This article is licensed under a Creative Commons Attribution 4.0 International License, which permits use, sharing, adaptation, distribution and reproduction in any medium or format, as long as you give appropriate credit to the original author(s) and the source, provide a link to the Creative Commons licence, and indicate if changes were made. The images or other third party material in this article are included in the article's Creative Commons licence, unless indicated otherwise in a credit line to the material. If material is not included in the article's Creative Commons licence and your intended use is not permitted by statutory regulation or exceeds the permitted use, you will need to obtain permission directly from the copyright holder. To view a copy of this licence, visit http://creativecommons.org/licenses/by/4.0/.
About this article

Cite this article
Duo, L., Wang, J., Zhong, Y. et al. Ecological environment quality assessment of coal mining cities based on GEE platform: A case study of Shuozhou, China. Int J Coal Sci Technol 11, 75 (2024). https://doi.org/10.1007/s40789-024-00723-8
Received:
Revised:
Accepted:
Published:
DOI: https://doi.org/10.1007/s40789-024-00723-8