
Abstract
In recent years, products that are free of hazardous substances and 2050 Net zero are the focus of environmental sustainability issues, and the standards formulated by various countries (e.g., RoHS, ISO14064-1) are mandatory requirements that brands cannot ignore. When products are to be imported, they must present relevant reports (i.e., product hazardous substance reports, greenhouse gas reports) and pass customs inspection before they can be sold in the country. The key to complying with the standards is to use raw materials without hazardous substances and reduce electricity use during the production process. However, previous works only focused on production development technology, but ignored the issue of energy consumption. Therefore, this study proposes the product hazardous substance report making energy consumption problem (PHSRMECP), which has the goal of low carbon emissions and a new matching method to solve it. As the complexity and solution difficulty of PHSRMECP are NP-Hard, this study proposes a heuristic algorithm to solve it. First, the Analytic Hierarchy Process (AHP), which is commonly used in multi-objective decision-making, is used to match reports and engineers based on weights, and then, the divide and conquer genetic algorithm (DnCGA) is applied to identify the best match. This new heuristic algorithm is based on the genetic algorithm, which is mixed with the divide-and-conquer simplified algorithm, in order to consider the speed and quality of the solution. The research goal is achieved by minimizing the energy consumption required to collect and compile reports. The verification method is applied to simulate the real data, and the results show that the proposed method is more effective than the original manual matching method: reduced 73,741.9 \(KgCO_{2} e\) emissions, and verified small, medium, and large-scale data statistics to effectively reduce CO2 emissions by 15.3% to 29.2%.
1 Introduction
In recent years, the issue of environmental sustainability has been a key topic, and the control of hazardous substances and energy protection are the standards that many countries apply when formulating policies, which creates a barrier to product sales; for example, the establishment of the hazardous substance directive (e.g., RoHS) to control imported products [1]; if a product contains hazardous substances, it will cause a health risk in humans [2, 3]. As the developments of Industry 4.0 are aimed at improving energy efficiency [4], manufacturers are required to comply with standards (e.g., ISO 14064-1) to effectively reduce energy use and CO2 emissions [5, 6]. Based on environmental sustainability, manufacturers must complete a product hazardous substance report (PHSR) to prove compliance with the directives. Then, the brand’s products must pass the customs inspection to prove they are low-carbon manufactured products without hazardous substances before they can be sold. The operational steps are shown in Fig. 1. The steps include the brand requesting the PHSR requirements (step 2), confirming the reports after making (step 4), and submitting to the customs inspection (step 5), in order to prove compliance with directive of the country before being sold (step 6). Most important is the energy consumption of the equipment used in the three main operations. The first is to review the materials provided for PHSR making, that is material composition declaration (MCD) provided by supplier (step 1). Process energy consumption generated by using green data server to process a large amount of MCD data and using X-Ray fluorescence to detect hazardous substances. The second is to match PHSRs and engineers using personal computers to make the reports (step 3). According to practical experience, each report can take an average of 30 working days to complete. The extensive process is due to the long operation time of using a green data server, the X-Ray fluorescence process, and collecting and compiling all the required personal computer results, which consumes a large amount of energy and creates CO2 emissions.

PHSR operation flow chart
Based on the need to sell products, many scholars have focused on compliance with directives and energy saving in manufacturing. Turner and Filella [7] proposed using X-Ray fluorescence to detect substances in rubber, and up to 18% were detected. Nogueira et al. [8] used X-Ray fluorescence to effectively measure the harmful substances contained in ink powders. Alassali et al. [9] evaluated recycled plastics with X-Ray fluorescence to identify potential toxic substances. Turner and Filella [10] used X-Ray fluorescence to measure packaging and plastic materials, and indicated pollution problems in recycling. Other energy consumption works include Alarcón et al. [11] which aimed to reduce the energy consumption of Industry 4.0 by adding energy and maintenance management systems. Cao et al. [12] proposed an evaluation framework based on fog-cloud computing to improve die casting factories. Zhou et al. [13] proposed a preventive maintenance and mass production model based on the opportunity to conserve energy during equipment downtime. Li et al. [14] developed a new energy supply system to improve energy efficiency and reduce carbon emissions. Wen et al. [15] proposed an innovative mapping method, which includes energy loss modeling, energy performance indicators, and improvement strategies.
According to relevant works, manufacturers must comply with the standards for hazardous substances control and energy saving of the various countries that import their products, and take relevant measures at each stage. Simultaneously, manufacturers must grasp their energy consumption and CO2 emissions, and take relevant energy-saving measures to achieve the goals. However, previous works regarding the management hazardous substances and energy saving only focused on fast and low-cost substance testing and low-energy use, but ignored the issue of completing PHSRs with optimized energy consumption. No work has ever explored the product report problem (PHSRMECP) based on an integrated view of energy savings. This lack of PHSR for brands will further affect the operation of manufacturers. In the current situation, when manufacturers receive requests, the works are matched by supervisors based on personal experience. However, as brands are restricted by the directives in different countries, there will be different report specifications (e.g., report formats), which increases the overall difficulty. The process includes the MCD approval in Fig. 1 (step 1) and the PHSRs and engineer matching (step 3). If the country’s requirements and the engineer's own conditions are not considered during matching, the PHSR will be returned for revision due to low quality, which in turn will affect mass production and shipment. Therefore, in order to meet the shipping schedule, engineers work overtime to complete the report, which increases the energy consumption burden.
In view of this, this study proposes a novel PHSRMECP to explore the optimization of matching combinations to help manufacturers efficiently meet the requirements with low energy consumption. As matching is an NP-Hard problem [16], this study used a heuristic algorithm, which includes the process of quantifying the influence degree of equipment energy consumption and engineers ability with the AHP method, where matches are prioritized based on their weights. In order to quickly obtain the best matching results, as based on the effective genetic algorithm, this study considered the convergence speed and quality of the solution, and applied the divide and conquer scheme to improve the chances of obtaining the best solution. According to this divide and conquer genetic algorithm (DnCGA), in order to solve the optimal matching problem, the objective is set to minimize the energy consumption of completing PHSRs. Among them, the engineer is responsible to match the constraints regarding the total number and format of the PHSRs. The simulation results show that the DnCGA method has lower energy consumption and CO2 emissions than manual matching.
The main contributions of this work are as follows:
-
This work proposes PHSRMECP to discuss optimal matching, as based on hazardous substance control and energy savings, and considers and moves towards the goal of making green products with net zero carbon emissions.
-
In order to meet the requirements the first time, and avoid the extra energy consumption caused by overtime, this work considers the engineer’s own matching conditions to effectively reduce the total working time.
-
AHP and the novel and efficient DnCGA solution are used to solve PHSRMECP, and the algorithm is based on the results of strengths and weaknesses. Compared with the current method of manual matching, this method can effectively improve efficiency and obtain high-quality solutions.
The next chapters of this work are organized as follows: Sect. 2 is the literature review, Sect. 3 is the mathematical model of PHSRMECP, Sect. 4 is AHP with DnCGA to solve the PHSRMECP problem, Sect. 5 is the experiment and analysis, then Sect. 6 is the conclusion and reference literature.
2 Literature Review
This work focuses on matching, and considers the impact of multiple criteria decision making (MCDM) to select the best solution. Therefore, the literature review was conducted on this condition.
2.1 Previous Works on MCDM
When facing multiple decision evaluation problems in the past, many works proposed MCDM methods to assist decision-making. Salvia et al. [17] used AHP to decide different lighting alternatives for public lighting, and further analyzed the energy savings. Han et al. [18] conducted production efficiency improvements, and evaluated the results with data envelopment analysis and the AHP method. Zhou and Yang [19] used the AHP method to assess distributed wind farm construction, which took the electricity price change policy as the key factor affecting sustainable development. Gao et al. [20] established a decision-maker weight model, which provided a scientific basis for the location of compressed-air energy storage installations. Nicklin and Darabkhani [21] used the MCDM method to improve the existing technology for emissions monitoring, including an equipment selection strategy. Hussain et al. [22] collected the delay factors of building energy projects with an AHP questionnaire, in order to achieve work objectives within the original budget. Srinivasan et al. [23] used the technique for order preference by similarity to determine the ideal solution and the response surface method to select better processing parameters. Overall, previous MCDM works in related fields have considered minimizing energy use or maximizing operating efficiency in the manufacturing and equipment configuration process.
2.2 Matching Problem Works
At present, the operations of human–machine systems have the problem of large energy consumption. By applying innovation technology, many scholars have planned heuristic algorithms and used computers to solve matching problems. Hazır et al. [24] used the design of experimental methods to determine the optimal parameters and developed a heuristic algorithm to smooth workloads. To solve the distribution of work, Gong et al. [25] applied a hybrid evolutionary algorithm that considered the workers‘ own conditions and energy consumption. Regarding production line expansion, Zhang et al. [26] evaluated the operation time and energy consumption to complete workstation allocations with an improved whale optimization algorithm. Zhang et al. [27] applied a hybrid parthenogenetic particle swarm optimization algorithm to decide the optimal matching combinations of work tasks. Karas and Ozcelik [28] proposed an artificial bee colony algorithm to re-allocate workers due to workstation interruption. To determine the optimal configuration for electric vehicles and charging stations, Zhou et al. [29] considered energy consumption and used genetic algorithms to complete the optimization model. To solve the problem of a wireless network layout in a cabin, Sun et al. [30] improved the genetic algorithm based on the divide-and-conquer method, and the simulation results showed better network coverage and more convenient passenger use. Toussi and Naghibzadeh [31] proposed a divide-and-conquer workflow scheduling algorithm to effectively complete work within the scheduled time, and greatly reduced operating costs. Gurukumaresan et al. [32] used the fourier elimination method to complete worker assignments with minimized costs. Liang et al. [33] applied a dual-individual simulated annealing algorithm to complete line balancing with minimal energy consumption. Betül Sultan Yıldız [34] studied the increasing demands for CO2-free electric vehicles, and found that, in addition to the huge demand for parts, there is also a requirement for high safety, and thus, designed complex thin-walled energy absorbers with a slim mold algorithm to enhance structural crashworthiness. Gürses et al. [35] studied the lightweight structural design goals of vehicle components, and applied a hybrid slim mold algorithm-simulated annealing algorithm to optimize the shape to achieve the goal of vehicles with minimized fuel emissions. To solve real‑world complex vehicle engineering problems, Yildiz et al. [36] used a new elite opposition-based learning grasshopper optimization algorithm to configure multiple design variables, and an effective optimization technique solution was achieved through actual case verification. To sum up the above, good matching needs must consider the 'worker's own conditions and energy consumption. However, when considering the work efficiency and quality of workers, most previous works focused on line balancing and minimizing operating cost, but ignored reducing carbon emissions during manufacturing. Therefore, this work proposes a new AHP with a DnCGA algorithm to solve the PHSRMECP, as based on the engineer‘s own conditions for product manufacturing.
3 Mathematical Model for the Concerned PHSRMECP
This chapter creates the mathematical model for PHSRMECP, focuses on minimizing the energy consumption of operations, considers the engineer's own conditions to effectively reduce operation time, and ensures operational quality. Specifically, the AHP method is used to effectively obtain the weights of engineer's work efficiency on the green data server, the X-Ray fluorescence process, personal computer use, and work quality regarding four evaluation criteria, and applies the new DnCGA for calculation to obtain a high-quality solution. The restrictions include each PHSR is made by an engineer, the total number of PHSRs for the engineers cannot exceed the total average number of PHSRs, and each engineer is responsible for at least two PHSR formats that do not exceed the maximum total formats.
For the mathematical model, refer to the past work of matching problems by Min et al. [37], and the symbols used are shown in Table 1.
This problem considers the following objective:
where
The objective Formula (1) is intended to minimize the total energy consumption of the green data server, the X-Ray fluorescence process, and personal computer use multiplied by the sum of the constant value of the influence of the energy consumption, as caused by the work quality criterion. Formula (2) is the total energy consumption \(G_{ij}^{k}\) of the green data server, which is based on the standard operating hours WR of each PHSR, and the difference value in the operating efficiency of engineers GEk and PHSR's on green data server GEij, multiplied by the influence constant value CV converted to standard operating hours, and then, multiplied to calculate the energy consumption GP using the green data server. Formula (3) is the total energy consumption \(R_{ij}^{k}\) of the X-Ray fluorescence process, which is based on the standard operating hours WR of PHSR, and the difference value in the operating efficiency of engineers REk and PHSR's X-Ray fluorescence REij, multiplied by the influence constant value CV converted to standard operating hours, and then, multiplied to calculate the energy consumption RP using the X-Ray fluorescence process. Formula (4) is the total energy consumption \(P_{ij}^{k}\) of the personal computer, which is based on the standard operating hours WR of PHSR, and the difference value in the operating efficiency of engineers PEk and PHSR's on personal computer PEij, multiplied by the influence constant value CV converted to standard operating hours, and then, multiplied to calculate the energy consumption PP using the personal computer.
The influence value of the engineer and PHSR work quality is shown in the following:
Formula (5) considers the work quality of PHSR \(Q_{ij}^{k}\), calculates the difference between the engineer's and PHSR's work quality impact criteria PQk and PQij, which is divided by two times the maximum difference, and adds a constant 1 to calculate. It is considered that the difference between the weight fractions of PQij and PQk, as obtained by the AHP method, is at most 8 points (e.g., PQij = 9, PQk = 1), thus, according to practical experience, it will cause an additional two times the total operation time; therefore, the denominator is set to 16. Among them, \((PQ_{ij} - PQ^{k} ) > 0\) means the engineer's work quality cannot meet the quality requirements, and it is necessary to increase \(Q_{ij}^{k} { > }1\), in order that the influence constant value of the total work time is set according to the calculated value. \(\left( {PQ_{ij} - PQ^{k} } \right) \le 0\) means the engineer's work quality meets the quality requirements, then, the work quality value is set as \(Q_{ij}^{k} = 1\), and the \(Q_{ij}^{k}\) criteria decision conditions are sorted, as follows.
A larger \(Q_{ij}^{k}\) means that the engineer cannot meet the requirements, thus, it will be returned to the brand, and additional overtime will be required, which will further increase energy consumption. Formula (6) indicates that each PHSR is to be set by an engineer, which matches the PHSR of the i-th format j to k engineers in sequence, where the report is matched as \(X_{ij}^{k} = 1\), and conversely \(X_{ij}^{k} = 0\). However, matching must consider the workload and training of multi-skilled workers, thus, each engineer is responsible for the total number of PHSR pieces \(TQ_{i}^{k}\) and the format limit of PHSR \(FQ_{j}^{k}\), in order to achieve the purpose of flexible matching and improve the report making capacity.
This problem considers the following constraints:
Restriction (7) denotes that each engineer is responsible for a total quantity of PHSRs \(TQ_{i}^{k}\), which is the average of the total quantity reports and engineers. Restriction (8) denotes that each engineer is responsible for making PHSR formats \(FQ_{j}^{k}\), where the setting should be at least two or more and not exceed the maximum total format \(FL_{j}^{k}\).
The differences of the proposed model from the previous model in Liu et al. [38] research are listed as follows:
-
Previous works only aimed at minimizing the total cost of employment and energy consumption, but did not consider the impact of worker productivity on energy consumption. Formula (1) is based on minimizing the energy consumption of various operations and adding the weight of the influence criterion, which is more in line with the actual situation of human–machine system operations.
-
The previous model did not consider the impact of increased energy consumption due to overtime, which is due to poor quality of work. Formula (5) considers the work quality to confirm the compliance of the engineer's competence criteria, in order to reduce the incidence rate of poor quality reporting.
-
The proposed model also considers multi-skilled workers, and Formula (8) sets that the engineer is responsible for the formats, and the purpose of improving the report making capacity of personnel is achieved by being responsible for different reporting requirements.
4 AHP with DnCGA to Solve the PHSRMECP Problem
This chapter describes and discusses the process of solving the PHSRMECP, and then, applies AHP with the DnCGA algorithm to solve it.
4.1 Problem Description
The concern of the PHSRMECP is based on the control of hazardous substances and energy saving in the PHSR making process (see steps 1 and 3 in Fig. 1). How to combine the requirements and the engineer's own conditions in the match (as shown in Fig. 2), make decisions, and determine the best solution is the focus. AHP with the DnCGA algorithm are proposed to solve the complex problem in this work.

PHSR matching diagram
4.2 Using AHP with DnCGA in the PHSRMECP Problem
Solving the PHSRMECP in this work is carried out in two steps. First, the AHP process considers the PHSR requirements and the engineer's own conditions to obtain the evaluation decision. Second, the DnCGA process is based on a commonly used genetic algorithm, which considers the efficiency and quality of the solution, and refers to the divide and conquer method of Younas et al. [39] for task assignment. AHP with the DnCGA algorithm applies the one-point (GA1), two-points (GA2), uniform genetic (GA3) algorithm, and elite strategy genetic algorithm (ESGA) in detailed steps, as shown in Fig. 3, which is used to confirm the effectiveness of solving the PHSRMECP using different algorithms.

The flow chart of solving the PHSRMECP
4.2.1 AHP Process
This section uses the Saaty [40] AHP method to effectively obtain the weights of the evaluation criteria that affect the PHSRMECP, and provides a priority scheme selection order method for fitness value calculation. According to literature regarding the use of AHP for multi-objective decision making [41], the method includes the following 3 steps:
-
1.
Establish a match comparison matrix: To obtain the matched evaluation matrix \(A_{i}^{k}\) of the PHSRMECP, a comparison matrix is established based on i = 1,2,…N pieces of PHSR and k = 1,2,…0 engineers, respectively. Based on the evaluation criteria of the E1, E2…, En report requirements and the engineer’s own conditions, evaluation matrix \(A_{i}^{k}\) is established including a11, a12…,ann comparison matrices, which are matched with 1, 2,…n evaluation criteria, and the completed matrix is shown in (9).
$$\begin{array}{*{20}c} {E_{1} } & {E_{2} } & \cdots & {E_{n} } \\ \end{array}$$$$A_{i}^{k} = \begin{array}{*{20}c} {E_{1} } \\ {E_{2} } \\ \vdots \\ {E_{n} } \\ \end{array} \left[ {\begin{array}{*{20}c} {a_{11} } & {a_{12} } & \cdots & {a_{1n} } \\ {a_{21} } & {a_{22} } & \cdots & {a_{2n} } \\ \vdots & \vdots & \ddots & \vdots \\ {a_{n1} } & {a_{n2} } & \cdots & {a_{nn} } \\ \end{array} } \right]$$(9) -
2.
Calculate the relative weights of the evaluation criteria: In the matched evaluation matrix \(A_{i}^{k}\), experts give a11, a12…,ann comparison matrix W11, W21…,Wnn weights according to the Saaty [41] AHP fundamental scale table, where the evaluation criteria comparison itself has the same importance, its weight is set to 1, and its calculation formula is shown in (10). Finally, calculate the geometric mean of the relative weight \(B_{i}^{k}\), and further obtain the Gn1, Gn2…,Gnn geometric mean of the E1, E2…, En report requirements, as well as the engineer's evaluation criteria. The evaluation calculation method is shown in (11).
$$A_{i}^{k} = \left[ {\begin{array}{*{20}c} 1 & {\frac{{W_{21} }}{{W_{12} }}} & \cdots & {\frac{{W_{n1} }}{{W_{1n} }}} \\ {\frac{{W_{12} }}{{W_{21} }}} & 1 & \cdots & {\frac{{W_{n2} }}{{W_{2n} }}} \\ \vdots & \vdots & \ddots & \vdots \\ {\frac{{W_{1n} }}{{W_{n1} }}} & {\frac{{W_{2n} }}{{W_{n2} }}} & \cdots & {\frac{{W_{nn} }}{{W_{nn} }}} \\ \end{array} } \right]$$(10)$$B_{i}^{k} = \left[ {\begin{array}{*{20}c} {\sum\limits_{1}^{n} {\sqrt[n]{{1 \times \frac{{W_{21} }}{{W_{12} }} \times \cdots \frac{{W_{n1} }}{{W_{1n} }}}}} } \\ {\sum\limits_{1}^{n} {\sqrt[n]{{\frac{{W_{12} }}{{W_{21} }} \times 1 \times \cdots \frac{{W_{n2} }}{{W_{2n} }}}}} } \\ \vdots \\ {\sum\limits_{1}^{n} {\sqrt[n]{{\frac{{W_{1n} }}{{W_{n1} }} \times \frac{{W_{2n} }}{{W_{n2} }} \times \cdots \frac{{W_{nn} }}{{W_{nn} }}}}} } \\ \end{array} } \right] = \left[ {\begin{array}{*{20}c} {G_{n1} } \\ {G_{n2} } \\ \vdots \\ {G_{nn} } \\ \end{array} } \right]$$(11) -
3.
Obtain the decision value of the matched evaluation criteria: To obtain decision value \(C_{i}^{k}\) of the evaluation criteria that each report is matched with each engineer, calculate the Gn1, Gn2…,Gnn values obtained by the geometric mean of the relative weight \(B_{i}^{k}\), then, obtain the M1, M2…, Mn evaluation decision value according to the calculation formula shown in (12), and finally, complete all PHSRs and match each engineer's evaluation criteria decision value.
$$C_{i}^{k} = \left[ {\begin{array}{*{20}c} {\frac{{G_{n1} }}{{\sum\limits_{1}^{n} {\left( {G_{n1} + G_{n2} + ... + G_{nn} } \right)} }}} \\ {\frac{{G_{n2} }}{{\sum\limits_{1}^{n} {\left( {G_{n1} + G_{n2} + ... + G_{nn} } \right)} }}} \\ \vdots \\ {\frac{{G_{nn} }}{{\sum\limits_{1}^{n} {\left( {G_{n1} + G_{n2} + ... + G_{nn} } \right)} }}} \\ \end{array} } \right] = \left[ {\begin{array}{*{20}c} {M_{1} } \\ {M_{2} } \\ \vdots \\ {M_{n} } \\ \end{array} } \right]$$(12)
The AHP calculation example of the PHSRMECP includes the matched evaluation matrix \(A_{i}^{k}\), which is calculated according to the evaluation criteria of PHSR (1) and engineer (1), while the equipment operation efficiency, including the green data server of 3, X-Ray fluorescence process of 2, personal computer use of 5, and PHSR of 7, are filled in according to (9)–(11), respectively, to obtain the geometric mean value \(B_{i}^{k}\) of the green data server \(\sqrt[4]{{{\raise0.7ex\hbox{$2$} \!\mathord{\left/ {\vphantom {2 {15}}}\right.\kern-0pt} \!\lower0.7ex\hbox{${15}$}}}}\), X-Ray fluorescence \(\sqrt[4]{{{\raise0.7ex\hbox{$1$} \!\mathord{\left/ {\vphantom {1 {48}}}\right.\kern-0pt} \!\lower0.7ex\hbox{${48}$}}}}\), personal computer \(\sqrt[4]{4}\) and operation quality \(\sqrt[4]{{90}}\). Finally, fill in this value according to (12) to obtain the evaluation criterion decision value \(C_{i}^{k}\), including the green data server 0.11, X-Ray fluorescence 0.07, personal computer 0.26, and operation quality 0.56.
4.2.2 Algorithm Process
This section applies the DnCGA method to solve the manufacturer’s PHSRMECP, which is combined with GA1, GA2, GA3, ESGA, to compare the strengths and weaknesses. Then, verify with the actual case data, and the results will prove the effectiveness of the research. The proposed novel DnCGA algorithm is shown in Algorithm 1, and detailed, as follows:

Algorithm 1 DnCGA
-
(A)
Expression of solution
To solve the matching problem, each solution is \(Y^{m} = \left( {X_{11}^{1} ,X_{22}^{2} ,X_{33}^{3} , \ldots X_{ij}^{k} } \right)\), where m is the number of possible solutions, i is the piece of PHSR, j is the report format, and k is the number of engineers. The solution is to minimize the match fitness value \(Minimize \, f\left( {X_{ij}^{k} } \right), \, X_{ij}^{k} \in Y^{m} \, i = 1,2,3 \ldots N, \, j = 1,2,3 \ldots M_{ij} , \, k = 1,2,3 \ldots O\), where the decision variable \(X_{ij}^{k}\) affects the objective function, and \(Y^{m}\) is the set of possible solutions. The initial solution is intended to generate a chromosomal composition that satisfies the constraints in a pattern.
-
(B)
Fitness value calculation.
To confirm the optimal combination matching scheme, the fitness value is calculated according to the four evaluation criteria, and the setting of fitness \(f\left( {Y^{m} } \right)\) is expressed by (13). The process is based on minimizing the energy consumption, where \(X_{ij}^{k}\) is the i-th PHSR of format j, which is matched with k engineers, and then, multiplied by the total value of the four evaluation criteria with restriction penalty value S (including the penalty value of formula (7) 50 points/piece and (8) 1000 points/piece), which is multiplied by the violation of restriction L set at l-th matching, where the decision variable \(PY_{ijl}^{k}\) of the i-th PHSR format j is matched with k engineers to violate the restriction l, as shown in (14), and the fitness value of each possible matched solutions is obtained after calculation.
-
(C)
Generate new chromosomes.
First, the basis for generating new progeny chromosomes is detailed, as follows: the parent chromosomes are selected according to the fitness value proportional roulette selection method, and the maternal chromosomes Cs are randomly selected and stored in the mating pool. Regarding the paternal chromosomes, according to (15), use the number of mating \(P_{c}\) and (16) mutation number \(P_{m}\) to determine the number of mating chromosomes and mutated genes to produce new progeny chromosomes. Among them, Cr represents the mating rate, Cn represents the number of chromosomes, Mr represents the mutation rate, and Cb represents the number of genes. To generate a new progeny chromosome, the fitness value is calculated by (13), which replaces the previous parent fitness value with better chromosomes.
To distinguish the chromosome mating methods into three categories, the first method uses all the paternal chromosomes generated from the initial solution, including GA1, GA2, and GA3, to generate new offspring; the second uses the optimal top 20% of the paternal chromosomes of ESGA to produce new offspring; the third is based on the efficiency and quality of the solution, which refers to a previous work [39] that used the divide-and-conquer method to propose a novel DnCGA algorithm, and the steps are described, as follows.
-
1.
1. Divide the solution chromosomes: Divide the chromosome Ch composed of each possible solution \(Y^{m} = \left( {X_{11}^{1} ,X_{22}^{2} ,X_{33}^{3} , \ldots X_{ij}^{k} } \right)\), divided by the \({\raise0.7ex\hbox{${Ch}$} \!\mathord{\left/ {\vphantom {{Ch} k}}\right.\kern-0pt} \!\lower0.7ex\hbox{$k$}}\) number k of the PHSR making engineers, to complete several sub-chromosomes Sub-Ch. The process of the divide-and-conquer method for chromosomes is shown in Fig. 4.
Fig. 4 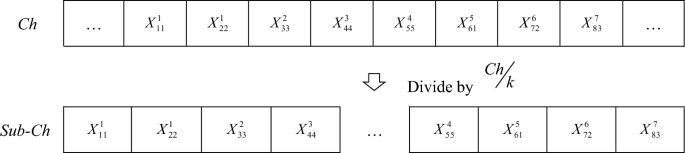
Divide-and-conquer chromosomes diagram
-
2.
Competitive selection for crossover: Select the paternal sub-chromosome Sub-Ch to deposit in the mating pool by the competitive selection method.
-
3.
Uniform chromosome crossovers: Mating of paternal sub-chromosome Sub-Ch in a uniform mating manner at the mating rate of Cr. The process of chromosome crossover is shown in Fig. 5.
Fig. 5 
Chromosomes crossover diagram
-
4.
Mutation to generate offspring: Mutate sub-chromosome Sub-Ch after mating at the mutation rate of Mr. The process of chromosome mutation is shown in Fig. 6.
Fig. 6 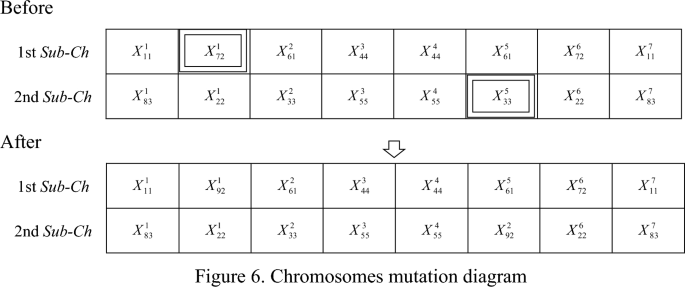
Chromosomes mutation diagram
-
5.
Chromosomes merge: Merge several sub-chromosomes Sub-Chr that have been mutated to provide subsequent fitness value calculation. The process of chromosomes merge is shown in Fig. 7.
Fig. 7 
Chromosomes merge diagram


-
(D)
Punishment mechanism.
When a chromosome cannot meet the restriction formula after mutation, it must be punished, including the restriction (7) and (8) penalty values.
-
(E)
Iterative termination.
The generation of new progeny chromosome and update iterations are continued, and the termination condition is that the maximum number of iterations has been reached or there is no new improved solution.
5 Experimental Results and Analysis
This chapter describes the experimental case, analyzes the parameters of the algorithm, and compares and analyzes the final simulation results.
5.1 Experimental Case and Environment
Manufacturer A, which is a professional original equipment manufacturer of network products, is the subject company of the experimental case. It was established in Taiwan's Hsinchu Science Park in 2003, and its capital is NT$5.422 billion. To verify the validity of the work, this matching experiment was conducted with the real data. The data includes the total quantity values of PHSRs and engineers (including small-scale 2440 PHSRs and 7 engineers, medium-scale 4480 PHSRs and 14 engineers, and large-scale 6720 PHSRs and 21 engineers) of different size scale conditions, and the limitation is that each engineer is responsible for the format and a portion of the total quantity of PHSRs, and the relevant real data is shown in Table 2.
The simulation program was written in C++ and solved by simulation on an Intel(R) Core(TM) i7-7200U CPU @ 2.71 GHz and 8.00 GB RAM personal computer.
5.2 Optimal Analysis of the Experimental Parameters
To determine the optimal chromosome size (Cs) parameters, crossover rate (Cr) and mutation rate (Mr) refer to the optimization energy-saving GA method of [42], and possible parameters including \(Cs = \left\{ {60, \ldots 10{0},150} \right\}\), \(Cr = \left\{ {0.6, \ldots 0.7,0.8} \right\}\), \(Mr = \left\{ {0.01, \ldots 0.04,0.05} \right\}\). To determine the various parameters and effectively simplify the number of experiments, the Taguchi method [43] was used in this work. The signal-to-noise ratio (S/N) was used for parameter selection, and the smaller-the-better S/N was applied, where Yi is the solution of the i-th experiment \(i = \left( {1,2,3 \ldots n} \right)\), and n is the number of experiments, and the calculation method is shown in (17).
Based on the confirmed experimental results of the algorithms, this study proposed three levels of influencing parameter values \(Cs = \left\{ {5,2{0},150} \right\}\)、\(Cr = \left\{ {0.1,0.5,0.9} \right\}\)、\(Mr = \left\{ {0.01,0.05,0.09} \right\}\) to draw the S/N ratio diagram, including three levels with three parameters in GA1, GA2, GA3, DnCGA, and fixed Cr = 0.2 with three levels of two parameters in ESGA, for parameter experimental analysis. Then, draw the S/N ratio diagram of the algorithm, where the X-axis represents the different levels, and the Y-axis represents the S/N ratio of the individual parameters, as shown in Fig. 8.

S/N ratio diagram of different parameter levels
The selection of the optimal parameter value is based on the most applicable principle of the smaller-the-better S/N ratio, and the maximum value. Table 3 provides the experimental verification settings.
5.3 Algorithm Comparison
This study performed 20,000 iterations of simulation experiments on the algorithm according to the optimal parameter settings in Table 3, and compared the experimental results. Table 4 shows that the best fitness of the DnCGA algorithm is 101,624.9, the average fitness is 101,629.9, and the worst fitness is 101,633.1, and compared with the GA1, GA2, GA3, and ESGA algorithms, the performance is better, and the computational time is shorter than that of GA3 and ESGA, which also use uniform matching. Figure 9 shows that the DnCGA algorithm converged faster than the other four algorithms in the comparison of the algorithm convergence. Figure 10 shows that the stability of the algorithms is comparable to the discrete range of the boxplot. The DnCGA algorithm is less discrete and more stable than the other four algorithms.

Algorithm iterative convergence comparison chart

Algorithm run 50 times boxplot diagram
5.4 Matched Total Score Comparison
This section performed a novel DnCGA algorithm to compare the matched total scores with manual matching, and confirmed that it has better performance than other algorithms. As shown in Fig. 11, the DnCGA algorithm has a lower total score than the existing manual matching and the GA1, GA2, GA3, ESGA algorithms. The improved scores of the DnCGA algorithm, as compared to manual matching, includes the small-scale decrease of 18,066.7 points, the medium-scale decrease of 55,324.4 points, and the large-scale decrease of 131,571.3 points. Changing the original manual matching to the DnCGA algorithm for PHSR making can effectively increase the improvement rate by 15.3–29.2% under the three scales of data.

Algorithm matched total score comparison diagram
5.5 Operational Energy Consumption and CO2 Emissions
Achieving net-zero carbon emissions by 2050 to curb environmental warming is an important policy for the sustainable development of various countries. On April 18, 2023, the European Parliament passed the Carbon Border Adjustment Mechanism [44, 45], and began to impose tariffs on specific imported products, which further erected new barriers to product sales and forced brand owners to require manufacturers to submit manufacturing energy consumption reports for support. Therefore, they conducted PHSR making analysis based on the research goal of optimizing energy consumption and CO2 emissions. Based on the DnCGA matching, and according to the actual use of the equipment, the energy consumption required to make the reports is shown in Table 5, including the green data server operation under 60% load and 24 h operation time, 2440 pieces of PHSR consumed the total energy of 77,572.2 kWh; the X-Ray fluorescence process completed the detection of 2440 PHSR raw materials under the 7 h operation time (after deducting the calibration and maintenance every day), and the total energy consumption was 42,087.5 kWh. According to the average working time of 21 working days per month and 8 h per day for personal computer work, 7 engineers completed 2440 PHSRs for a total operating energy consumption of 4778.1 kWh. Figure 12 shows the total energy consumption for operations: 62% for the green data server, 34% for the X-Ray fluorescence process, and 4% for personal computer use. The total energy consumption of the three operations using the DnCGA matching was 124,437.8 kWh, which is 15.3% less than the 146,896.3 kWh using manual matching.

PHSR operating energy consumption ratio diagram
Confirmation of the carbon emissions was based on the emission coefficient method to calculate the greenhouse gas emissions generated by the energy consumption of the operations according to the 2006 IPCC guidelines [46]. The calculated value was converted according to the global warming potential of the 2013 IPCC climate change report [47], and the value was converted into the CO2 equivalent \(KgCO_{2} e\), according to the statistics of CO2 greenhouse gas emissions of operation, as calculated by (18). Among them, \(KgCO_{2} e\) was the total greenhouse gas emission equivalent of the operation, \(G_{ij}^{k}\) was the energy consumption of the green data server, \(R_{ij}^{k}\) was the energy consumption of the X-Ray fluorescence process, \(P_{ij}^{k}\) was the energy consumption of personal computer use, and \(EC_{{{\text{KgCO}}_{{2}} {\text{e}}}}\) was the 2021 electricity carbon emission factor, as announced by the Bureau of Energy R.O.C [48]. After calculation, the CO2 greenhouse gas emissions of the total operation were obtained.
The CO2 greenhouse gas emissions of the operations are shown in Table 6, including the use of DnCGA matching to reduce the total CO2 emissions to 62,467.8 \(KgCO_{2} e\), for a reduction of 15.3%, as compared with the original manual matching of the total CO2 emissions of 73,741.9 \(KgCO_{2} e\).
6 Conclusion and Future Work
To achieve the goal of hazardous substance control and energy saving, many countries have formulated the RoHS Directive to control imported products, which requires the reduction of energy used in product manufacturing. Regarding the PHSRMECP, this study proposed AHP with the DnCGA method to plan the optimal energy consumption combination of PHSR requirements and engineer matching, and verified the method with the real data. The experimental results show that the new method has better performance than manual matching, and reduced energy consumption and CO2 emissions by 15.3–29.2% under different scale data. This method can help manufacturers make PHSRs in a more energy-efficient manner for brands to submit to customs inspections in various countries, in order that products can be smoothly imported and sold.
However, while the world pays attention to environmental sustainability and implements net zero carbon emissions by 2050, in addition to the requirements of various national CO2 emission standards, manufacturers are required by brands to disclose the carbon emissions created during manufacturing (i.e., CDP global disclosure system), and the requirements for the reduction of hazardous substances (i.e., SCIP regulations) will become more stringent with time. This will make the research of PHSRMECP more difficult and complex. In view of this, based on the possible development of new technologies and innovative methods, several further works will include: (1) Research and development: Selecting hazardous-free substances and low-carbon raw materials for the product development stage, and how to carry out X-Ray fluorescence detection of risky substances. (2) Matching method: Whether a more effective and efficient algorithm for the matching process can be proposed in a follow-up study. (3) Manufacturing process: Manufacturing methods and PHSR making processes with low energy consumption are subjects that can be directly studied to reduce CO2 emissions. Finally, further research can take a holistic direction or suggest different evaluation criteria for better solutions.
Availability of Data and Material
The datasets generated during and/or analysed during the current study are not publicly available due to [Real data confidentiality requirements] but are available from the corresponding author on reasonable request.
Abbreviations
- i :
-
PHSR requests numbered
- j :
-
PHSR formats numbered
- k :
-
Engineers numbered
- N :
-
PHSR total pieces
- M :
-
PHSR formats total pieces
- O :
-
Total engineers
- WR :
-
Standard working hours
- GP :
-
Green data server average energy consumption
- RP :
-
X-Ray fluorescence average energy consumption
- PP :
-
Personal computer average energy consumption
- CV :
-
Impact constant value
- G E :
-
Operating efficiency of the green data server
- RE :
-
Operating efficiency of the X-Ray fluorescence
- PE :
-
Operating efficiency of personal computer
- PQ :
-
Work quality impact criterion
- TQ :
-
Total quality of PHSR making
- FL :
-
Limit quantity of format
- FQ :
-
Making quantity of formats
- G :
-
Total green data server energy consumption
- R :
-
Total X-Ray fluorescence energy consumption
- P :
-
Total personal computer energy consumption
- Q :
-
Difference between the weighted of the work quality criteria
- X :
-
Decision variable of matching
- E :
-
Evaluation criteria
- W :
-
Relative weight of evaluation criteria
- Y :
-
Possible matching solutions
- PY :
-
Decision variable of restriction violate
- S :
-
Restriction penalty value
- l :
-
Violate of the restriction
- L :
-
Total violate of the restriction
References
Grifa, R. A., & Pozzoli, G. (2019). Electro-medical devices: Environmental regulation on hazardous substances. Microchemical Journal, 148, 568–572. https://doi.org/10.1016/j.microc.2019.05.047
Duan, W., Xu, C., Liu, Q., Xu, J., Weng, Z., Zhang, X., Basnet, T. B., Dahal, M., & Gu, A. (2020). Levels of a mixture of heavy metals in blood and urine and all-cause, cardiovascular disease and cancer mortality: A population-basedcohort study. Environmental Pollution, 263, 114630. https://doi.org/10.1016/j.envpol.2020.114630
Singha, N., Duan, H., & Tang, Y. (2020). Toxicity evaluation of E-waste plastics and potential repercussions for human health. Environment International, 137, 105559. https://doi.org/10.1016/j.envint.2020.105559
Teng, S. Y., Touš, M., Leong, W. D., How, B. S., Lam, H. L., & Máša, V. (2021). Recent advances on industrial data-driven energy savings: Digital twins and infrastructures. Renewable and Sustainable Energy Review, 135, 110208. https://doi.org/10.1016/j.rser.2020.110208
Javadi, P., Yeganeh, B., Abbasi, M., & Alipourmohajer, S. (2021). Energy assessment and greenhouse gas predictions in the automotive manufacturing industries in Iran. Sustainable Production and Consumption, 26, 316–330. https://doi.org/10.1016/j.spc.2020.10.014
Chen, X., Xu, X., Lu, Z., Zhang, W., Yang, J., Hou, Y., Wang, X., Zhou, S., Li, Y., Wu, L., & Zhang, F. (2020). Carbon footprint of a typical pomelo production region in China based on farm survey data. Journal of Cleaner Production, 277, 124041. https://doi.org/10.1016/j.jclepro.2020.124041
Turner, A., & Filella, M. (2017). Field-portable-XRF reveals the ubiquity of antimony in plastic consumer products. Science of the Total Environment, 584–585, 982–989. https://doi.org/10.1016/j.scitotenv.2017.01.149
Nogueira, G. A. L., Parreira, P. S., Santos, F. R. D., & Melquiades, F. L. (2019). Determination of metal content in industrial powder ink and paint thickness over steel plates using X-Ray fluorescence. Applied Radiation and Isotopes, 150, 168–174. https://doi.org/10.1016/j.apradiso.2019.05.030
Alassalia, A., Barouta, D., Tirion, H., Moldt, Y., & Kuchta, K. (2020). Towards a high quality recycling of plastics from waste electrical and electronic equipment through separation of contaminated fractions. Journal of Hazardous Materials, 387, 121741. https://doi.org/10.1016/j.jhazmat.2019.121741
Turner, A., & Filella, M. (2021). Lead in plastics—recycling of legacy material and appropriateness of current regulations. Journal of Hazardous Materials, 404, 124131. https://doi.org/10.1016/j.jhazmat.2020.124131
Alarcón, M., Martínez-García, F. M., & Hijes, F. C. G. D. L. (2021). Energy and maintenance management systems in the context of industry 4.0. Implementation in a real case. Renewable and Sustainable Energy Reviews, 142, 110841. https://doi.org/10.1016/j.rser.2021.110841
Cao, H., Chen, E., Yi, H., Li, H., Zhu, L., & Wen, X. (2021). Multi-level energy efficiency evaluation for die casting workshop based on fog-cloud computing. Energy, 226, 120397. https://doi.org/10.1016/j.energy.2021.120397
Zhou, B., Qi, Y., & Liu, Y. (2020). Proactive preventive maintenance policy for buffered serialproduction systems based on energy saving opportunistic windows. Journal of Cleaner Production, 253, 119791. https://doi.org/10.1016/j.jclepro.2019.119791
Li, L., Huang, H., Zou, X., Zhao, F., Li, G., & Liu, Z. (2021). An energy-efficient service-oriented energy supplying system and controlfor multi-machine in the production line. Applied Energy, 286, 116483. https://doi.org/10.1016/j.apenergy.2021.116483
Nordström, A., & Tufekci, S. (1994). A genetic algorithm for the talent scheduling problem. Computers & Operation Research, 21(8), 927–940. https://doi.org/10.1016/0305-0548(94)90021-3
Wen, X., Cao, H., Hon, B., Chen, E., & Li, H. (2021). Energy value mapping: A novel lean method to integrate energy efficiency into production management. Energy, 217, 19353. https://doi.org/10.1016/j.energy.2020.119353
Salvia, A. L., Brandli, L. L., Filho, W. L., & Kalil, R. M. L. (2019). An analysis of the applications of Analytic Hierarchy Process (AHP) for selection of energy efficiency practices in public lighting in a sample of Brazilian cities. Energy Policy, 132, 854–864. https://doi.org/10.1016/j.enpol.2019.06.021
Han, Y., Zhou, R., Geng, Z., Bai, J., Ma, B., & Fan, J. (2020). A novel data envelopment analysis cross-model integrating interpretative structural model and analytic hierarchy process for energy efficiency evaluation and optimization modeling: Application to ethylene industries. Journal of Cleaner Production, 246, 118965. https://doi.org/10.1016/j.jclepro.2019.118965
Zhou, S., & Yang, P. (2020). Risk management in distributed wind energy implementing Analytic Hierarchy Process. Renewable Energy, 150, 616–623. https://doi.org/10.1016/j.renene.2019.12.125
Gao, J., Men, H., Guo, F., Liu, H., Li, X., & Huang, X. (2021). A multi-criteria decision-making framework for compressed air energy storage power site selection based on the probabilistic language term sets and regret theory. Journal of Energy Storage, 37, 102473. https://doi.org/10.1016/j.est.2021.102473
Nicklin, D., & Darabkhani, H. G. (2021). Techniques to measure particulate matter emissions from stationary sources: A critical technology review using Multi Criteria Decision Analysis (MCDA). Journal of Environmental Management, 296, 113167. https://doi.org/10.1016/j.jenvman.2021.113167
Hussain, S., Xuetong, W., Hussain, T., Khoja, A. H., & Zia, M. Z. (2021). Assessing the impact of COVID-19 and safety parameters on energy project performance with an analytical hierarchy process. Utilities Policy, 70, 101210. https://doi.org/10.1016/j.jup.2021.101210
Srinivasan, V. P., Palani, P. K., Dhayananthan, S., Gopi, S., Balamurugan, S., & Venkatesh, S. M. (2021). A Multi Criteria Decision Making (MCDM) based on TOPSIS and RSM for process improvement in electrical discharge machining of silicon nitride–titanium nitride ceramic composites. Materials Today: Proceedings, 45(2), 1319–1327. https://doi.org/10.1016/j.matpr.2020.05.436
Hazır, Ö., Agi, M., & Guérin, J. (2020). A fast and effective heuristic for smoothing workloads on assembly lines: Algorithm design and experimental analysis. Computers and Operations Research, 115, 104857. https://doi.org/10.1016/j.cor.2019.104857
Gong, G., Chiong, R., Deng, Q., Han, W., Zhang, L., Lin, W., & Li, K. (2020). Energy-efficient flexible flow shop scheduling with worker flexibility. Expert Systems With Applications, 141, 112902. https://doi.org/10.1016/j.eswa.2019.112902
Zhang, B., Xu, L., & Zhang, J. (2020). Developing mathematical model and optimization algorithm for designing energy efficient semi-automated assembly line. Computers & Industrial Engineering, 149, 106768. https://doi.org/10.1016/j.cie.2020.106768
Zhang, L., Li, Z., Yang, Y., & Cui, M. (2020). Human error unplanned downtime inferring and job-operator matching based on inverse optimal value method. Computers & Industrial Engineering, 149, 106840. https://doi.org/10.1016/j.cie.2020.106840
Karas, A., & Ozcelik, F. (2021). Assembly line worker assignment and rebalancing problem: A mathematical model and an artificial bee colony algorithm. Computers & Industrial Engineering, 156, 107195. https://doi.org/10.1016/j.cie.2021.107195
Zhou, G., Zhu, Z., Sharifi, A., & Luo, S. (2022). Location optimization of electric vehicle charging stations: Based on cost model and genetic algorithm. Energy, 247, 123437. https://doi.org/10.1016/j.energy.2022.123437
Sun, H., Yang, C., Wang, R., & Ghauri, S. (2020). A divide-and-conquer based improved genetic algorithm for network selection in heterogeneous wireless network. International Journal of Modelling, Identification and Control, 34, 217–224. https://doi.org/10.1504/IJMIC.2020.111625
Toussi, G. K., & Naghibzadeh, M. (2020). A divide and conquer approach to deadline constrained costoptimization workflow scheduling for the cloud. Cluster Computing, 24, 1711–1733. https://doi.org/10.1007/s10586-020-03223-x
Gurukumaresan, D., Duraisamy, C., Srinivasan, R., & Vijayan, V. (2021). Optimal solution of fuzzy assignment problem with centroid methods. Materials Today: Proceedings, 37(2), 553–555. https://doi.org/10.1016/j.matpr.2020.05.582
Liang, J., Guo, S., Du, B., Li, Y., Guo, J., Yang, Z., & Pang, S. (2021). Minimizing energy consumption in multi-objective two-sided disassembly line balancing problem with complex execution constraints using dual-individual simulated annealing algorithm. Journal of Cleaner Production, 284, 125418. https://doi.org/10.1016/j.jclepro.2020.125418
Yıldız, B. S. (2021). Slime mould algorithm and kriging surrogate model-based approach for enhanced crashworthiness of electric vehicles. International Journal of Vehicle Design, 83(1), 54–68. https://doi.org/10.1504/IJVD.2020.114786
Gürses, D., Bureerat, S., Sait, S. M., & Yıldız, A. R. (2021). Comparison of the arithmetic optimization algorithm, the slime mold optimization algorithm, the marine predators algorithm, the salp swarm algorithm for real-world engineering applications. Materials Testing, 63(5), 448–452. https://doi.org/10.1515/mt-2020-0076
Yildiz, B. S., Pholdee, N., Bureerat, S., Yildiz, A. R., & Sait, S. M. (2021). Enhanced grasshopper optimization algorithm using elite opposition-based learning for solving real-world engineering problems. Engineering with Computers, 38, 4207–4219. https://doi.org/10.1007/s00366-021-01368-w
Min, D., Dunbing, T., & Adriana, G. A. S. M. (2019). Multi-objective optimization for energy-efficient flexible job shop scheduling problem with transportation constraints. Robotics and Computer Integrated Manufacturing, 59, 143–157. https://doi.org/10.1016/j.rcim.2019.04.006
Liu, R., Liu, M., Chu, F., Zheng, F., & Chu, C. (2021). Eco-friendly multi-skilled worker assignment and assembly line balancing problem. Computers & Industrial Engineering, 151, 106944. https://doi.org/10.1016/j.cie.2020.106944
Younas, I., Kamrani, F., Bashir, M., & Schubert, J. (2018). Efficient genetic algorithms for optimal assignment of tasks to teams of agents. Neurocomputing, 314, 409–428. https://doi.org/10.1016/j.neucom.2018.07.008
Saaty, T. L. (1988). What is the analytic hierarchy process? Mathematical Models for Decision Support, 48, 109–121. https://doi.org/10.1007/978-3-642-83555-1_5
Omar, F., Bushby, S. T., & Williams, R. D. (2019). Assessing the performance of residential energy management control Algorithms: Multi-criteria decision making using the analytical hierarchy process. Energy & Buildings, 199, 537–546. https://doi.org/10.1016/j.enbuild.2019.07.033
Song, H., Cai, M., Cen, J., Xu, C., & Zeng, Q. (2022). Research on energy saving optimization method of electric refrigerated truck based on genetic algorithm. International Journal of Refrigeration, 137, 62–69. https://doi.org/10.1016/j.ijrefrig.2022.02.003
Sadeghifam, A. N., Meynagh, M. M., Tabatabaee, S., Mahdiyar, A., Memari, A., & Ismail, S. (2019). Assessment of the building components in the energy efficient design of tropical residential buildings: An application of BIM and statistical Taguchi method. Energy, 188, 116080. https://doi.org/10.1016/j.energy.2019.116080
Böhringer, C., Fischer, C., Rosendahl, K. E., & Rutherford, T. F. (2022). Potential impacts and challenges of border carbon adjustments. Nature Climate Change, 12, 22–29. https://doi.org/10.1038/s41558-021-01250-z
Perdana, S., & Vielle, M. (2023). Carbon border adjustment mechanism in the transition to net-zero emissions: Collective implementation and distributional impacts. Environmental Economics and Policy Studies, 25, 299–329. https://doi.org/10.1007/s10018-023-00361-5
IPCC. (2006). 2006 IPCC Guidelines for National Greenhouse Gas Inventories. https://www.ipcc-nggip.iges.or.jp/public/2006gl/. Accessed 17 May 2023.
IPCC. (2013). Climate Change 2013: The Physical Science Basis. https://www.ipcc.ch/report/ar5/wg1/?msclkid=a4751bb1d00b11ec9c0c6348a5c8. Accessed 17 May 2023.
Bureau of Energy R.O.C. (2021). Electricity Carbon Emission Factor. https://www.moeaboe.gov.tw/ECW/english/content/Content.aspx?menu_id=207. Accessed 17 May 2023.
Acknowledgements
The authors thank the anonymous referees for comments that improved the content as well as the presentation of this paper. Thanks also to SkyTraq technology, Inc. Mr. Chuang-Yang, Lin for help with the simulation program development.
Funding
No funding was received to assist with the preparation of this manuscript.
Author information
Authors and Affiliations
Contributions
All authors contributed to the study conception and design. Material preparation, data collection and analysis were performed by C-CH and C-CL. The first draft of the manuscript was written by C-CH and all authors commented on previous versions of the manuscript. All authors read and approved the final manuscript.
Corresponding author
Ethics declarations
Conflicts of Interest
The authors have no relevant financial or non-financial interests to disclose.
Ethics Approval
All authors have approved to this submission to your esteemed journal.We agree that if accepted, the paper will not be published elsewhere in the same form, in English or in any other language, without the written consent of the Publisher.
Consent to Participate
All authors agreed with the content and that all gave explicit consent to submit and that they obtained consent from the responsible authorities at the institute/organization where the work has been carried out, before the work is submitted.
Consent for Publication
All authors agree to the publication and have obtained the consent of the responsible department of the institution/organization in which the work was performed.
Additional information
Publisher's Note
Springer Nature remains neutral with regard to jurisdictional claims in published maps and institutional affiliations.
Rights and permissions
Springer Nature or its licensor (e.g. a society or other partner) holds exclusive rights to this article under a publishing agreement with the author(s) or other rightsholder(s); author self-archiving of the accepted manuscript version of this article is solely governed by the terms of such publishing agreement and applicable law.
About this article

Cite this article
Hsu, CC., Lin, CC. The Optimization of Energy Consumption and CO2 Emission in the Product Hazardous Substances Report Making. Int. J. of Precis. Eng. and Manuf.-Green Tech. 11, 889–907 (2024). https://doi.org/10.1007/s40684-023-00572-x
Received:
Revised:
Accepted:
Published:
Issue Date:
DOI: https://doi.org/10.1007/s40684-023-00572-x