
Abstract
Learning involves a substantial amount of cognitive, social and emotional states. Therefore, recognizing and understanding these states in the context of learning is key in designing informed interventions and addressing the needs of the individual student to provide personalized education. In this paper, we explore the automatic detection of learner’s nonverbal behaviors involving hand-over-face gestures, head and eye movements and emotions via facial expressions during learning. The proposed computer vision-based behavior monitoring method uses a low-cost webcam and can easily be integrated with modern tutoring technologies. We investigate these behaviors in-depth over time in a classroom session of 40 minutes involving reading and problem-solving exercises. The exercises in the sessions are divided into three categories: an easy, medium and difficult topic within the context of undergraduate computer science. We found that there is a significant increase in head and eye movements as time progresses, as well as with the increase of difficulty level. We demonstrated that there is a considerable occurrence of hand-over-face gestures (on average 21.35%) during the 40 minutes session and is unexplored in the education domain. We propose a novel deep learning approach for automatic detection of hand-over-face gestures in images with a classification accuracy of 86.87%. There is a prominent increase in hand-over-face gestures when the difficulty level of the given exercise increases. The hand-over-face gestures occur more frequently during problem-solving (easy 23.79%, medium 19.84% and difficult 30.46%) exercises in comparison to reading (easy 16.20%, medium 20.06% and difficult 20.18%).
Introduction
Sir Richard Livingstone once said: “The test of successful education is not the amount of knowledge that pupils take away from school, but their appetite to know and their capacity to learn” (Livingstone 1941, p. 28).
Understanding learners’ capacity to guide their learning in school and beyond has been a key topic of discussion among educational researchers, policy-makers and practicing educators alike. The current education systems are based on the philosophy of an industrial society, i.e. “one-size-fits-all” (Watson et al. 2015). Personalization (“fit-for-everyone”) is the key to design systems which are capable of addressing the needs of individual students. More recently, there has been an increasing interest in developing robotic tutors (Gordon et al. 2016; Benitti 2012; Jones et al. 2015), e-learning and Intelligent Tutoring Systems (ITSs) (Andallaza et al. 2012; Woolf 2009; Woolf et al. 2009; D’Mello et al. 2005; Graesser et al. 2007; Litman and Forbes-Riley 2004) that would provide individualized teaching in multiple domains. Such systems often infer affective states based solely on facial expressions and are capable of personalization to some extent, but they also lack the required empathic capabilities, i.e. ability to fully interpret the emotions, moods and temperaments of learners.
Many experienced human teachers often recognize students’ affective states in a classroom and/or one-to-one tutoring situation (Lepper et al. 1993). Teachers are effective at utilizing this powerful information to determine individual student’s requirements, to identify who requires help and support, and to adjust the pace and/or the content of the learning material. However, existing learning technologies (e.g. robotic tutors and intelligent tutoring systems) hardly incorporate such techniques into their instructional strategies. Therefore, one of the main goals is to develop an algorithm/software which could automatically recognize various affective states and nonverbal behaviors occurring in a learning environment. Learning technologies such as robotic tutors; intelligent tutoring systems; the use of the internet and computers for e-learning; online learning and distance learning, play a significant role in facilitating learning and enhancing student’s educational performance. Thus, the automatic detection of the affective states would be beneficial to these technologies, which would link these behaviors to an individual’s requirements and be able to provide personalized support. This article aims to address this by investigating various nonverbal behaviors in depth and their significance in various learning contexts in a learning scenario.
Automatic detection of affective states from various body-languages and other nonverbal behavior is relatively underdeveloped in educational domains. We describe research to measure and support the affective dimension in this domain in ways that were not previously explored. The informed interventions to the affective states will encourage learning, provide help and support to motivate learners, and lessen the learners’ fear of humiliation and failures. In the following section, we review the previous work investigating the role of emotion and nonverbal behavior in a teaching and learning domain. We also discuss the prominent role of computer vision and machine learning for automatic recognition of affect and nonverbal behavior that could easily be integrated into modern learning technology to enhance the teaching and learning outcomes.
Related Research
There has been a great deal of related research in understanding student affect/emotions in educational contexts. To automate the understanding process, machine-learned computational models are recently being combined with theoretical developments and methodological advances in this context. This is feasible due to the advances in sensors, digital technologies and machine learning models, which automatically infer behavioral states associated with learning activities from machine-readable behavioral signals (e.g., facial expressions, body poses and movements, eye gaze). These behavioral states are often linked to student engagement. In this section, we attempt to provide the most related works covering the above topics.
Emotions/affects in Learning and Teaching
Conveying mental and affective information via body gestures and movements is historically well-researched and long-established (Darwin 1872/1998). In particular, unintentional body movements and gestures convey a great deal of useful information about the affect (McNeill 1992), as well as reactions to emotional situations (Wallbott 1998; Givens 2002). The concept of emotion, affect and behavior is often used interchangeably. For example, if affects and emotions are considered as weather that changes frequently; then behavior can be seen as a climate. There is no proven theory of emotion that explains which emotions are important in learning or identifies how emotion influences are learning (Picard et al. 2004). Emotion is often described as a spontaneous feeling derived from one’s circumstance, mood or relation with others and is often expressed via nonverbal cues such as tone of voice, body posture/movement, hand gestures and facial expression. Most studies of emotion do not include the phenomena observed in natural learning situations, such as interest, boredom or surprise.
Emotions and learning are symbiotic and vital in creating the setting in which learning takes place (Shuck et al. 2007). Our emotions are intertwined with cognition in guiding rational behavior, including memory and decision making (Woolf et al. 2009). Emotions are considered one of the 12 vital challenges for the field of cognitive science (Norman 1981). Recognizing and modeling student’s emotion and behavior has become increasingly important for effective learning and teaching. Tutors/teachers have valued the role of affect in learning. They have also recognized the emotional upsets that can interfere with their mental life. Students’ interests and active engagement are important in learning (Bransford et al. 2000) and they exhibit behavioral, emotional and cognitive engagements (Fredricks et al. 2004; Anderson et al. 2004). Students who are anxious, angry or depressed do not learn well (Perry 2006; Burleson and Picard 2004; Picard et al. 2004). Research suggests that in one-to-one tutoring, tutors often devote much time in achieving students’ motivational goals instead of their cognitive and informational goals (Lepper and Hodell 1989). Numerous studies have addressed emotions involved in learning (Dirkx 2006; Burleson and Picard 2004; Picard et al. 2004; Perry 2006; Reeve 2001; Wolfe 2006), as well as existing research also suggests that the emotion encountered within the learning experience implies the deep involvement of the learner’s psyche (Dirkx 2006).
There is a rich history of automatic detection of affect/emotions by analyzing facial expression using machine-learned computational models (Mehta et al. 2018; Fasel and Luettin 2003). More recently, it has been used in learning and teaching environments with the intention of recognizing and monitoring of students’ behavior to provide better interventions during learning (D’Mello et al. 2017; Bahreini et al. 2016; Bosch et al. 2015; Bosch and D’Mello 2014; D’Mello 2013). Much of the earlier work on facial expression-based affect detection is focused on six basic emotions of anger, fear, sadness, happiness, disgust, and surprise (see review in Calvo and D’Mello (2010) and Zeng et al. (2009)). Recent studies show that such basic emotions are less frequent in the context of learning (D’Mello 2013; Woolf et al. 2009) instead of such scenarios, students’ affective experience consists of learning-focused affective states such as anxiety, boredom, confusion, engaged concentration, frustration, and happiness. However, it is still unclear if these states can be detected with similar fidelity as the basic emotions since the relationships between emotion and facial expression have been thoughtfully designed for decades (Bosch et al. 2015). Similar relationships are mostly missing in the learning-focused affective states and still remains an open question.
It is well-known that facial expression conveys much more information about one’s emotions. However, mechanization of the facial expression faces technological challenges of accurate detection of faces in an unconstrained environment, resulting in low resolution faces with varying face poses, lighting conditions, occlusions by eyeglasses and makeup, make it very hard for machine learning algorithms for accurate recognition. Moreover, it has been shown that the position of hand at the different part of face convey different emotions in The Definitive Book of Body Language (Pease and Pease 2006). Similarly, Beattie argues that gestures reflect aspects of our thinking but in a different way to verbal language in his latest book Rethinking Body Language (Beattie 2016). Therefore, in many scenarios facial expression is often combined with other modalities such as hand movements, hand gestures, prosody (pitch and rhythm of voice) to recognize emotional expressions (Xiao et al. 2013; Zeng et al. 2009; Busso et al. 2007; Kaliouby and Robinson 2005; Meservy et al. 2005).
Head and Eye Movements and Nonverbal Behavior
Most of the existing research on affect recognition is based on facial expression (Calvo and D’Mello 2010; Zeng et al. 2009). In order to improve the performance of automatic recognition of emotions, head movements are often removed during the pre-processing of video/images (De la Torre and Cohn 2011). In everyday life, we encounter associations between head, eye movement, and emotional expressions (Karg et al. 2013; Cohn et al. 2004; Keltner 1995). Research suggests that ratings of human understanding of communication involving both face and body are 35% more accurate than the face alone in an experiment involving short observation (under 5 minutes) of expressive behavior (Ambady and Rosenthal 1992). Human interpretation of different social interactions in a variety of situations is most accurate when people can observe both the face and the body (Ekman and Friesen 1969). Research also suggests that in situations where the face and body expressions do not provide the same meaning, the facial expression recognition was biased towards the emotion expressed by the body language (Gelder 2009). In educational contexts, body gestures and postures are often used for examining teaching and learning (see review in Roth (2001)). Lately, there is significant progress in automatic detection of people, their body parts and facial landmarks (fiducial points) in images/videos (Cao et al. 2017; Ding and Tao 2016; Zhao et al. 2003). This has resulted in advancement of automatic recognition of emotions/behavior involving movements of various body-parts and facial landmarks. These movements are easier to access than other information. However, the communicative functions of head movements are overlooked and fairly unexplored by automatic affect recognition systems in learning and teaching environments. This study aims to address this issue.
There has been a significant interest in using eye-tracking in learning and teaching research. Most of the existing research is focused on analyzing eye-gaze (where one is looking) to understand student behaviors and processes by analyzing gaze patterns indicating attention (or lack thereof) to relevant interface elements (Zhan et al. 2016; Conati et al. 2013; D’Mello et al. 2012; Mathews et al. 2012). Such methods use special devices (eye-trackers) to record gaze. These eye-trackers estimate gazes from eye movements. In this study, we focus on relative eye movements to measure spatial spread without considering any specific interface elements and includes wandering eyes. The goal is to use eye motions to infer behaviors and its relationships to learning type (reading vs problem-solving) and topic difficulty that is yet to be explored. The proposed method is simple yet efficient and cost-effective that uses a webcam to infer such behaviors and can easily be integrated with the existing learning technologies.
Emotion-adaptive Intelligent Tutoring Systems (ITSs)
There is a significant advancement in sensor technologies, artificial intelligence (AI) and machine learning resulting in the development of more personalized educational systems. These systems are known as Intelligent Tutoring System (ITS). The adaptive nature of such a system is that it often uses real-time emotion/behaviour signals linking student engagement to adjust the teaching strategy and tries to imitate human teachers. This is called emotion-adaptive ITS and is a hot topic in ITS community (Mudrick et al. 2017; Forbes-Riley and Litman 2012; D’Mello et al. 2010; Woolf et al. 2009; Graesser et al. 2007; Arroyo et al. 2007; D’Mello et al. 2007; Johns and Woolf 2006). A subset of these ITSs focus on dialogue-based interaction by implementing the natural language processing and is comparable to the conversations that occur in human tutoring (Graesser et al. 2007; Arroyo et al. 2007; Johns and Woolf 2006). The goal is to comprehend natural language, formulate adaptive responses, and implement pedagogical strategies to help students learn.
A number of researches have recently focused on building ITS that detect and respond to affective states such as boredom, confusion, frustration, and anxiety (D’Mello et al. 2017; Kapoor et al. 2007; Arroyo et al. 2009; D’Mello et al. 2007; Mudrick et al. 2017; Forbes-Riley and Litman 2012; D’Mello et al. 2010; Woolf et al. 2009). Most of these systems use state-of-the-art sensing devices and machine learning algorithms to automatically detect students’ affect from the live sensor data by monitoring facial-features, speech contours, body pose, hand gestures, interaction logs, language, and peripheral physiology (e.g. electromyography, galvanic skin response). These emotion-adaptive ITSs then dynamically respond to these sensed affective states by altering their pedagogical and motivational strategies.
The above-mentioned advancement is narrowing the gap between human teachers and ITSs, but the gap is not closed, not even remotely so. This is mainly since there are no software tutors that possess the cognitive awareness of an actual human teacher, consistency in decision making in different learning context (e.g. students’ capability, classroom size, learning topics, etc.), sociodemographic factors (e.g. age, gender, race, etc.) and different educational environments (e.g. primary schools, colleges, universities, etc.). Moreover, many existing ITSs infer affective states by deploying computer vision techniques to recognize various upper-body gestures (e.g. Facial expression, body postures, etc.). Research on upper-body gesture recognition has made considerable headway in the computer vision community. However, in an educational setting, it is still in its infancy. This could be due to the challenge faced by computer vision researchers to provide a powerful standard language that can adequately and concisely describe human emotions.
Hand-over-Face (HoF) Gestures in Learning and Teaching
In natural conversations and social interactions, we often use our hands as a mean of nonverbal communication (see review (Rautaray and Agrawal 2015)), ranging from simple actions (e.g. pointing at objects) to more complex ones (e.g. expressing feelings). More habitually we put our hands near to our faces which is often partially covered and has been used as a key for inferencing affective states (Mahmoud and Robinson 2011). Pease and Pease (2006) attempt to identify the meaning conveyed by different HoF gestures in their book, The Definitive Book of Body Language (Fig. 1). It is suggested that different positions and actions of the hand occluding the face can imply different affective states.
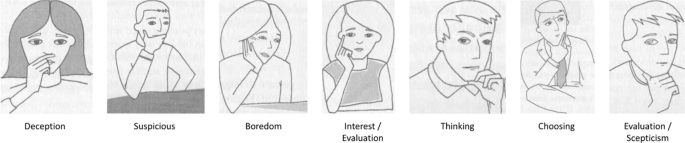
Different hand-over-face gestures presented in The Definitive Book of Body Language (Pease and Pease 2006). These images are taken from this book
In learning and teaching, researchers mostly focus on facial expressions as the main channel for emotional communication; however, Gelder (2006) suggests that there are similarities between how the brain reacts to emotional body languages and how facial expressions are recognized. HoF gestures are not redundant information; they can emphasize the affective cues communicated through facial expressions. Recently, computer vision algorithms have been developed to recognize HoF gestures in videos (Mahmoud et al. 2016), automatically. However, its implications for learning and teaching environment are unexplored. This study addresses this by looking into its association with learning context (e.g. reading vs problem-solving) and topic difficulty levels (e.g. easy, medium and difficult).
The aim of this study is not to explicitly associate HoF to an affective/emotional state, but rather to measure the frequency of its appearance in different learning activities and associated difficulty levels of the learning topics. In order to achieve this, algorithms/software for automatic recognition of the HoF gestures are required. One of the aims of this article is to develop such an algorithm. We propose a novel approach that uses state-of-the-art deep Neural Network (NN) for recognizing HoF gestures appearing in learning and teaching environment. These HoF gestures (position of the hand on various parts of the face) could be implicitly linked to seven different emotions (deception, suspicious, boredom, interest, thinking, choosing and skepticism) (see Fig. 1). This will enable an adaptive intelligent tutoring system to take appropriate corrective actions. For example, notifying the tutors/lecturers, simplifying the topic content, pace of delivery, etc. This will also provide meaningful insight into individual interactions/engagement to develop better personalized tutoring process. It is worth noting that not all of these gestures might appear in the context of learning. Therefore, in this study, we focus on high-level HoF gestures and their association with different learning activities and difficulty levels without differentiating the fine-grained HoF gestures (e.g. deception, boredom, etc.)
Approaches for Measuring Student Engagement
It is well-known that student engagement plays a critical role in learning. There is a significant advancement in conceptualizing students’ engagement as a complex multifaceted and multitemporal concept involving a diverse range of phenomena, ranging from instantaneous emotional states of interest and joy to long-term disposition about school (D’Mello et al. 2017). Due to the advancement of digital technologies the traditional measure of engagement (e.g. self-reports, questionnaire, interviews, teachers’ or psychologists’ introspective evaluations and checklists) are being replaced with novel digital measurements. Nonverbal cues such as facial expressions, head movements and body posture can indicate students’ frustration (Kapoor et al. 2007). Eye-gaze and head direction information can express user interest and engagement (Peters et al. 2010). Automatic measurement of behavioral engagement is carried out by analyzing facial expressions and facial textures in videos captured using a webcam (Whitehill et al. 2014). Trained coders provided ground-truth ratings of behavioral engagement using an ordinal scale of 1 (not engaged) to 5 (very engaged). To measure computer-enabled classroom engagement, Arroyo et al. (2009) used features consisting of facial expressions and head movements, body postures such as leaning forward, and movement variability, amount of physiological arousal, and pressure exerted on the mouse. These features are used to predict self-reported levels of interest, confidence, excitement, and frustration on 5-point scales using multiple regression models. Body postures and movements are used to measure interest (a component of engagement) by Mota and Picard (2003). In this work, the ground-truth annotations (high, medium, or low interest; taking a break; bored; and others) are provided by three teachers.
The above research suggests that digital measurement of gestures and body movements has significantly advanced the scientific study of student engagement. We propose a data-driven cause-effect approach (difficulty → affect → gestures) that capitalizes on the explosion of digital learning environments and advances in computer vision and machine learning techniques to automate the process. The novelty of our approach is that we explore the cause-effect relationships as an alternative solution to supervised machine learning algorithms.
Aims and Objectives
The overall aim of the study is the automatic detection of natural, unintentional body movements and gestures during computer-mediated learning in a natural teaching-learning environment and establishing relationships between these behaviors with learning task types and difficulties. Within this broad theme, the research consists of four specific objectives:
-
1.
To recognize HoF gestures automatically from low-quality images captured using a webcam;
-
2.
To measure unintentional, instantaneous, natural body movements and gestures such as HoF, facial expressions, head pose, head movements and eye gaze as classroom time progress;
-
3.
To investigate the cause-effect relationships between the above-mentioned behavioral measurements and the learning task types such as reading and problem-solving;
-
4.
To study the impact of three levels of difficulty (easy, medium and difficult) on the above-mentioned measurements within a learning context for computer science undergraduate students.
We address the above-mentioned objectives via a series of analysis involving head-and-shoulder video data captured during interactions of undergraduate computer science students with a laptop used in a natural teaching-learning environment. Our experimental setup for video data collection is natural, unobtrusive and without interfering the subject’s interaction with the learning materials. This results in naturally-evoked emotional states resulting in various body movements and gestures to ensure the validity and usability of the data. Moreover, the various movements and gestures are inferred using a data-driven approach. For example, HoF gestures are considered as one of the behavioral cues only after the data capture and is based on our observation of its frequent appearance while analyzing the video data.
Current Study Design
The existing literature review revealed that most of the studies are focused on detection of naturalistic affective/emotional states in a high degree of controlled environments such as a laboratory. Therefore, the generalizability of the proposed method within real-world scenarios including classroom and/or computer lab is uncertain. Moreover, the automatic detection of affective/emotional states are mostly focused on facial expression. By contrast, the literature on para-linguistic communication and social interaction emphasizes the importance of body language signals such as head movements, head pose, body posture, hand movements and HoF gestures in communication (Gelder 2009; Cook and Goldin-Meadow 2006; Ambady and Rosenthal 1992). Some relevant research has been done on understanding gestures, and posture in educational contexts (Kessell and Tversky 2005; Roth 2001) but this has been fairly unexplored and still in need of automatic computer categorization and validation.
The present study considers, the HoF gestures and head movements for automatic understanding of students’ engagement. The HoF gesture is explored by Whitehill et al. (2014) as one of the faces of engagement. However, this study has gone one step ahead by associating it with different learning types and difficulty level, as well as proposed a novel deep learning model for automatic recognition of HoF gestures. Videos of students’ head-and-shoulders are captured while they are engaged in a learning environment in which they are asked to solve exercises linked to the undergraduate computer science topics.
Scope of This Study
Predicting emotions or mental state from body movements and gestures is difficult and unexplored in educational systems. This is mainly because of the relationship between the gestures and the underlying mental states is context-dependent and uncertain. Therefore, in this study, we have developed a context-specific model for inferring affect via observable unintentional gestures (HoF, facial expression, head movements and eye gaze) performed by students in tutoring situations. In this scenario, context refers to learning types (reading vs problem-solving) and topic difficulty. The correlations between unintentional gestures and context are often strongly connected via hidden affect/mental states due to the cause-effect relationships (e.g. difficulty → affect → gestures). These hidden states are difficult to measure, and often multiple states are involved in producing gestures. Therefore, it is difficult to identify a particular affect causing a certain gesture. In this article, we take a more speculative approach to find the correlation between gestures and context without explicit measurement of affect or mental state due to the uncertain nature of affect-gestures relationships in an educational context. This allows us to uncover previously unknown or lesser-known relationships between unintentional gestures and learning activities/difficulty.
The goal is to develop a data-driven approach to automate the process of recognizing unintentional instantaneous gestures as well as gestures over time, to infer their influence (gestures \(\leftarrow \) affect \(\leftarrow \) difficulty) on learning activities/difficulty without explicit measurement of hidden affect or mental states. In educational contexts, affect or mental states are often considered via self-reports, interviews, teachers’ or psychologists’ observations and checklists. These techniques are not only cumbersome and labor-intensive, but also lack temporal resolution, which is required to grasp the interplay between engagement and learning.
The study also focuses on automating the process of finding cause-effect (e.g. difficulty → affect → gestures) relationships. The cause (difficulty) is linked to effect (gestures) via hidden affect/mental states, which are not often explicitly measurable. Our assumption is that there exists a set of hidden affect/mental states that link the learning context (e.g. topic difficulty) with the body gestures. In this study, both learning context and gestures are observable, as well as measurable. Our approach to establish a cause-effect relationship is by varying the cause (e.g. learning types, level of difficulty) and measure the respective effect, i.e. a change in body movements or gestures, then it can be inferred that the observed gestures and bodily movements are due to the possible causes (reverse engineering problem). Once we establish this cause-effect relationship, then during the inference if certain effects (instantaneous gestures and body movements) are observed, then one could reason out the possible causes of these effects. This would allow human tutors or Intelligent Tutoring Systems (ITS) to take the required appropriate corrective actions.
Experimental Methods and Materials
The following sections describe the subjects, topics and exercises, data recording procedure for capturing the video of head-and-shoulder (upper-body) of the individual subject while engaging with the learning topics and carrying out the given exercises. Afterwards, the video data is processed for automatic detection and tracking of faces, eye-gaze and emotional state to understand their nonverbal behavior in the domain of teaching and learning with a particular focus on student engagement.
Participant Population
An initial convenience sample of 9 participants was composed of undergraduate computer science students from Edge Hill University. All the subjects were male students and the experimental data for this study is recorded in two separate sessions: (1) five students in one session and (2) four in another session. The sample consists of five first year, one second year and three third-year undergraduate students. The participation in this study is voluntary and is not linked to any module and/or program/pathways. Ethical approval for the data capturing was sought from the respective ethics committee and all students signed an informed-consent form before participating in the experiments. Furthermore, all students gave written consent to the publication of their facial images.
Learning Topics and Exercises
The topics and the linked exercises are carefully designed to fit the undergraduate computer science students. To monitor nonverbal behavior linked to student engagement, we have selected learning topics based on the increased level of difficulty. To identify the appropriate level of difficulty, we consider easy, medium and difficult topics, and the respective linked exercises in the context of undergraduate computer science teaching and learning. We use five experienced computer science tutors’ introspective evaluations in which the topic difficulty is decided by one tutor and verified by four others. The easy learning topic is the manipulation (addition, subtraction, division and multiplication) of negative numbers. This topic-linked exercise is to compute the outputs of given arithmetic expressions involving negative numbers. The medium learning topic is the Fibonacci computation (Ball 2003), which is often used in the undergraduate computer science domain. The exercise is to compute a missing Fibonacci number in a sequence of three consecutive numbers. The final topic is a difficult one and is to find the Longest Common Subsequence (LCS) in two sequences. This is a classic computer science problem and is the basis of data comparison and often used in Bioinformatics (Hirschberg 1977). The exercise is to complete an LCS table consisting of six rows and five columns.
The students were given learning materials in advance and enough time to get familiar with the learning topics before carrying out the respective exercises. The experimental setup is based on lectorials, which are a 10-15 minutes mix of lecture (in our experiment, it is slides) and tutorial task, then changing quickly (Cavanagh 2011). It is suggested that this is appropriate for mathematics-based content as is the case for our topics. The total duration is 40 minutes (three lectorials covering three different topics in Table 1) in our experiments. This is based on the decline of student attention after 40 minutes of learning activities (Bligh 2002). The breakdown of the topics and the corresponding exercises are given in Table 1.
The learning materials provided are in the form of PowerPoint slides in a single presentation file. Students are required to go through these slides during the session. The exercises are embedded at the end of the respective topic. The order in which the topics and exercises appear in the slides, is presented in Table 1 from top to bottom row (i.e. topic 1 → exercise 1 \( \rightarrow \) topic 2 → exercise 2 → topic → exercise 3). At the end of each sub-session (learning topic and exercise duration), students were verbally informed to move to the next sub-session. These time points, i.e. start and end of each sub-session are recorded for the topic and exercise-specific analysis of the students’ engagement. It is noted that the research aim is to understand the nonverbal behavior linked to the student engagement rather than evaluating the capability of individual students for completing the given task, i.e. right or wrong answers and whether completed or not.
Experimental Setup for Video Data Capturing
The data capturing procedure was carried out in a classroom using a standard laptop with inbuilt webcam, which is normally positioned at the top-middle of the monitor. A video recording application was developed to capture the video of the head-and-shoulders of the students while working with a laptop. The laptop is placed on a desktop table (typical classroom setup), and the students were seated on chair to work on the laptop. The position of the laptop monitor placed in a such a way that it would capture the head-and-shoulder of the student (Fig. 2a). The recording software was working in the background without interfering with the subject’s laptop activities. The recording software was set to record video stream of standard resolution of 640x480 (width and height) and a frame rate of 15 (Fig. 3).

Experimental setup and data capturing

Some examples of hand-over-face gestures in our study
Video Data Processing and Measuring Nonverbal Engagement
A total of 9 videos (one for each participant) were recorded with a duration of approximately 40 minutes (\(\sim \)40x60x15 = 36,000 frames) each. Given the sheer volume of video data (\(\sim \) 4 hours of video with 320,000 images), it is difficult to annotate emotions, head pose and eye gaze. Therefore, we used the state-of-the-art IntraFace tool (De la Torre et al. 2015) for automatic detection and tracking of faces and the respective fiducial points in the videos. The tool also provides the frame-level recognition of five emotions (sad, happy, surprised, neutral and disgusted). It has been shown that the detection and recognition performance of the proposed algorithm is excellent and comparable to other state-of-the-art techniques developed over the past two decades (Shan et al. 2009). Most of these algorithms perform very well (accuracy > 95% on the Extended Cohn-Kanade dataset) in recognizing the above emotions by analyzing facial expressions in images containing the head-and-shoulder of a single person, as is the case in our experimental setup. The accuracy of the algorithm developed by De la Torre et al. (2015) is 96.4% and is superior to them. Moreover, the algorithm is computationally inexpensive to run in real-time using a webcam on a standard PC/laptop.
The HoF gestures involve different shapes of the hand positioned on various facial regions (Fig. 1), resulting in the occlusion of a significant portion of the face. It is well-known that such occlusions hinder the automatic recognition performance of above-mentioned five emotions (De la Torre et al. 2015). Therefore, the proposed HoF gesture recognition algorithm first separates the HoF images (Fig.3), and then the facial expression analysis algorithm is applied to the rest of the images for the automatic emotion recognition. This creates a clear distinction between HoF gestures and the facial expressions.
Hand-over-Face (HoF) Gestures Recognition
In this section, we mainly focus on the automatic recognition of hand-over-face (HoF) gestures from images. The goal is to develop a tool/classifier, which will assign a label (HoF or not) to a given image, automatically without human intervention and is a computer vision problem.
Computer vision-based emotion/behavior recognition often depends on three main steps: 1) feature extraction, 2) feature representation and 3) classification/recognition. Feature extraction involves image processing to extract features that reflect the intrinsic content of the images. These features are often based on color, texture and edges of objects. Feature representation is the process of organizing the above-mentioned image features in one single vector, commonly referred to as a feature vector. Finally, this feature vector is used for classifying images by applying machine learning algorithms. Over the last decade, various feature extraction and representation processes are often designed manually, widely known as feature engineering. Most commonly used handcrafted features are scale-invariant feature transform (SIFT) (Lowe 2004), spatio-temporal interest points (STIP) (Laptev 2005) and histogram of oriented gradients (HOG) (Dalal and Triggs 2005). These features dominated in this domain due to their superior performance. Recently, feature learning techniques are being developed to replace manual feature engineering. These techniques allow an algorithm to learn/discover such features from input images without relying on explicit algorithms. This is feasible due to the advancement of deep Neural Networks (NN) (Yosinski et al. 2014; Razavian et al. 2014), which outperformed handcrafted features in many important recognition tasks. Deep NN allows multiple processing layers to learn feature representations with multiple levels of abstraction, automatically from input images through a hierarchical learning process. Such models learn from very general (e.g. edges, color blobs or corners) to more complex features (e.g. shapes or high-level structures) as we move from the first to the last layer. In this paper, we explore both handcrafted features and deep NN feature representations to compare the recognition performance of HoF gestures.
For the learned feature representation, we use the state-of-the-art deep models such as VGG-16 (Simonyan and Zisserman 2014), Inception-V3 (Szegedy et al. 2016) and Inception ResNet-V2 (Szegedy et al. 2017). These models are trained on natural images in ImageNet dataset (Russakovsky et al. 2015) consisting of 1.2 million images with 1,000 classes. These models are used to extract the learned high-level features from the last layer. For handcrafted features, we have used the HOG (Dalal and Triggs 2005). The features are fed into a machine learning algorithm to perform the HoF recognition task. Two different machine learning algorithms are used for the performance comparison: 1) Standard linear Support Vector Machine (SVM) and 2) propose a novel deep NN (Fig. 4b) classifier.

The proposed deep Neural Network (NN) performs better than the SVM approach (except for HOG feature)
Linear SVM-based Recognition
For a baseline, we use linear SVM (Fan et al. 2008) algorithm, which is a discriminative classifier and is widely used for solving a variety of classification tasks. For HoF classification, the algorithm takes the image feature vectors and associated labels (HoF or not) as inputs and constructs a hyperplane or a set of hyperplanes in a high-dimensional feature space, during the training stages. The algorithm uses these hyperplanes to provide a binary output (HoF or not) for a given image feature.
Proposed deep Neural Network (NN) Based Classification
Recently, deep learning has repeatedly demonstrated its superior performance on a wide variety of visual recognition tasks. Inspired by this development, we propose a novel deep NN architecture for recognizing HoF gestures in images. The architecture consists of multiple processing layers involving Fully-Connected (FC), Dropout and Softmax layers (Fig. 4b). When a feature vector is fed into the model, it is processed at each layer as it moves from the first layer to the last layer. At each layer, a non-linear transformation is applied to generate the respective output. The transformation consists of Convolution, Pooling, Dropout, Batch Normalization (BN) or rectified linear units (ReLU) (Szegedy et al. 2017; Szegedy et al. 2016). The procedure continues until the final Softmax layer to produce the output consisting of the classification label of HoF or not. The number of layers and the dropout rate (Fig. 4b) are experimentally determined by considering the best performance on the HoF dataset. The model is trained using RMSProp optimizer (Tieleman and Hinton 2012), which is an effective gradient descent algorithm and is widely used to train a neural network.
Evaluation of HoF Gestures Recognition Model
In order to evaluate the proposed HoF recognition model, we use a subset of the original dataset and consist of 98,955 training and 59,980 testing images. This is mainly due to the large volume of the video data, significant imbalance in the amount of HoF frames versus the rest, and memory limitations (fit into 32 GB RAM and 8GB of GPU). The images within the subset are selected by using a sequential sampling process that chooses d desired images from a set of n images by considering the temporal position of images in a video sequence. The training images are sampled from six videos (from six students), which are randomly selected. Similarly, the testing images are sampled from the rest of the three videos considering the same sequential sampling process. The aim is to split the subset into student-wise training and testing images, so that the model can be tested on unseen students to ensure the real-world application. The HoF gesture labelling is done by two experienced computer science tutors. The criterion is whether participants’ hand appear over the face or not.
In this experiment, we use the default image size of 224 × 224 for VGG-16 and 299 × 299 for Inception-V3 and Inception ResNet-V2 models to extract the respective learned feature. We use the image size of 128 × 128 to extract the handcrafted HOG feature. These features are used by both the SVM and the proposed deep NN (Fig. 4b) for recognizing HoF. We use the well-known standard evaluation criteria of accuracy (ACC), Average Precision (AP) linking recall and precision, F1-measure (aka F1-score) and Area under Receiver Operating Characteristic (ROC) Curve (AUROC). ACC gives the percentage of correct predictions. It assigns equal cost to false positives and false negatives. Whereas, AP summarizes precision-recall curve. The F1-score \(\left (F1 = 2 \times \frac {R \times P}{R + P}\right )\) is the harmonic mean of precision and recall.
The performance of the proposed approach using the HoF dataset is shown in Table 2. It is evident that the performance using learned deep features (VGG-16, Inception-V3 and Inception ResNet-V2) is better than the handcrafted HOG feature for both SVM and the proposed deep NN. In SVM-based classification, the performance of Inception ResNet-V2 (Szegedy et al. 2017) is better (ACC: 80.17%) than the rest. The performance using the handcrafted HOG feature is 70.24% (ACC) and the learned deep features outperformed this by approximately 10%.
The performance using our deep NN (Fig. 4b) is better than the SVM except for the HOG feature. This shows the importance of the proposed deep NN. Out of all features, Inception-V3 (Szegedy et al. 2016) performed (ACC: 86.87%) better than the rest. The other metrics (AP, F-score and AUROC) are also far better than the rest. The performance comparison using ROC curve is shown in Fig. 4a.
Recently, Mahmoud et al. (2016) have used a multi-modal approach for classifying HoF gestures in videos. They reported that their multi-modal fusion approach achieved the classification accuracy of 83% by combing HOG (Dalal and Triggs 2005) and STIP (Laptev 2005) handcrafted features. Our approach uses uni-modal feature and performs better than Mahmoud et al. (2016). Moreover, our approach infers HoF gestures using images from webcams and is a challenging problem due to the low-quality and absence of temporal information. Furthermore, the HoF gestures appear naturally in a teaching-learning context whereas, the dataset used by Mahmoud et al. is recorded specifically for HoF gestures. Microsoft Kinect sensors with HD cameras are used to capture high-quality data in an experimental observation suite.
Other Emotions in Learning Environments
In classrooms, the emotional dimension often focuses on mental states that are relevant to students’ emotional involvement during learning activities such as enthusiasm, interest and enjoyment (Meyer and Turner 2002). There are six basic emotions (happy, sad, surprise, disgust, fear and anger), that are widely experienced in different human cultures (Ekman 1992). In this work, other than HoF gestures, we also look into emotions such as happy, sad, surprise, disgust, and neutral within a tutoring environment.
Facial Fiducial Points Detection for Measuring Head Movements
Most of the automatic face recognition systems rely on the detection and recognition of certain fiducial points or landmarks; for example, the eyes, the nose, the mouth etc. The position and spatial arrangements of these points in a given image are often used for recognizing faces (Chellappa et al. 1995). Using the IntraFace tool, we process each video and extract 12 fiducial points in every frame as shown in Fig. 5a. In our analysis, we will be using the relative positions of these points in frames to measure the head movements in the image plane.

Facial feature extraction using IntraFace tool: a–b 1-12 fiducial points, c Head pose measured in degrees using Pitch, Yaw and Roll, d spherical coordinates representing eye gaze angles 𝜃 and ϕ in degrees
The movements are measured in pixels and therefore, the change in distance between a subject and the camera would cause inaccurate measurement. To minimize this, we use the interocular distance to normalize the movements to make sure that we can measure them with the same gauge. Moreover, the accuracy of the interocular distance is based on the accurate location of both eyes in an image. The location accuracy is not a problem for the frontal view since the images captured using a laptop-screen mounted webcam mostly contains the head-and-shoulder of the participant. However, when there is an occlusion of one or both eyes, e.g. due to a hand-over-face gestures or the participant turning their head, then the interocular distance is not measurable. In this scenario, we use the most recent measured interocular distance of a given subject. This is due to the fact that while working with a laptop the distance between a given participant’s head-and-shoulder and the laptop-screen mounted webcam does not vary significantly.
Head Pose Measurements
The head pose is represented as pitch, yaw and roll angles in degrees. Movement around the longitudinal axis is termed roll, motion about the perpendicular axes is called yaw, and the motion about the lateral axis is called pitch. Their range is measured between -180 and 180 degrees and is shown in Fig. 5c. In our measurements, the relative pose in degrees will be used for measuring the head turns.
Eye Gaze Measurements
The eye gaze for both left and right eye is separately measured and represented using the spherical coordinates system. The IntraFace tool represents gaze using two angles in degrees. The first angle is called theta (𝜃) which represents the azimuth (with positive values when looking at the left of the screen), and the second one is named phi (ϕ) that shows the elevation concerning the horizontal plane (see Fig. 5d). Their range is between -180 and 180 degrees. If a face is detected in an image, then there will be four measurements (left eye: 𝜃 and ϕ; right eye: 𝜃 and ϕ) per face. Like in previous measures, we also use the relative gaze orientation (difference in 𝜃 and ϕ) information for measuring engagement with respect to eye movements.
Relations Between Nonverbal Behaviors and Student Engagement
As mentioned earlier, existing research has proved that the student engagement in a learning context is often exhibited by their nonverbal behavior patterns (e.g. body poses and movements, head and eye movements, facial expressions). These behavior patterns are captured and analyzed using machine learning algorithms to better understand the quality of engagement. In this section, we use a data-driven approach to establish relationships between instantaneous unintentional gestures (HoF, facial expressions, head movements and eye gaze) and learning activities/difficulty. This would provide an implicit link to student engagement.
There are 36,000 samples for every feature (head movement, eye gaze, emotion, etc.), i.e. one sample per frame and there are 36,000 frames per video file. To analyze and plot results, we use a window of one-minute (i.e. 900 frames for a frame rate of 15 frames/second). The average over this one-minute video clip (average over 900 samples) is used for our final analysis. Therefore, there are 40 samples/feature per video (40 minutes) which represent an average value over a one-minute video clip. We also consider the average value of nine students. All of our plots and results are based on this average value over 40 minutes.
Student Engagement as Study Time Progress
In our analysis, we formulate the movements as (a) acute (instantaneous) and (b) chronic (long-term). The acute movements are considered by measuring the changes in the current frame with respect to the frame obtained one-second before, i.e. if the current frame is fc than the difference in feature values is |fc − fc− 15| for a frame rate of 15 frames/second. The chronic movements are computed by measuring the difference in feature values in each frame and the mean feature values, which is computed by considering all frames within a given video. These mean values are computed per 40 minutes video representing the engagement activities of a single participant.
Head Movements
The head movements are measured using the 12 landmarks (fiducial points) as described earlier. Each landmark is represented as x, y position which is a pixel location in the image plane. For 12 landmarks, there are 24 positional values (12 times x, y position) for each frame. For acute head movements, we compute a displacement vector of dimension 24 by taking the absolute difference in positions of landmarks in the current frame and the respective positions in the fame obtained before 15 frames. The average displacement values are obtained by considering all frames within the one-minute video clip. Then, we consider the average over all students (9 students). Finally, we compute the average over 24 displacement values to represent a single value representing one-minute video clip. Similarly, we compute the chronic head movements, but the only difference is that displacement vector is considered by taking the absolute difference in positions of landmarks in the current frame and the respective mean positions computed over the whole video. Figure 6 shows the head movements as classroom learning and teaching progress.

Normalized head movements over a duration of 40 minutes learning activities and the respective trend lines
From Fig. 6, it is clear that both chronic and acute head movements are increasing over time. In our experimental setup, the difficulty level of learning topics and exercises increase over time. This links the behavioral engagement regarding head movements over time as the chronic head movement is significantly more as time progress. This implies during difficult task/exercises students’ heads tend to be more mobile. The severity of head movements could be linked to the sign of disengagement and apathy. This would provide a cue to the lecturer/tutor for taking appropriate steps to counter this. The other interesting observation is that this particular session is monotonic, i.e. students using a laptop for their learning and there is minimal interaction with their tutor and fellow students. It is well-known that the upper limit of the human brain’s capacity to pay focused attention to a lecture is about 20 minutes (Davis 2008). This means their boredom might be increasing due to this monotonic activity. The head movements could be a sign of this boredom. Over the 40 minutes duration, the average normalized chronic head movement (0.41) is more than the acute one (0.11).
Head Poses
The head poses are measured using the 3-dimension feature vector that includes pitch, yaw and roll angles in degrees. The relative head pose (or orientation) is measured the same way as described in the previous section for measuring head movements. We compute both acute head pose and chronic head pose for our evaluation and is computed using similar strategies described in the above head movements. Figure 7 shows these head poses over the study time. From this figure, it is observed that the relative pose for both the acute head pose and the chronic head pose increases over time. This is similar to the head movements shown in Fig. 6 and the same argument can be applied here as well, i.e. the higher changes in head poses can be observed as time progresses in a given monotonic learning activity. Also, the higher changes in head poses could be observed when the difficulty level of learning topics and exercise increases. The average values in degrees over 40 minutes duration across all students is provided in Table 3. It is noted that the relative yaw orientation is slightly more than the pitch but both are significantly more than the roll. This is due to students learning activity is carried out using a laptop and the relative roll orientation is more likely to be less because of the monitor size is small (19 inches) and fixed.

Head pose measured in degrees (pitch, yaw and roll) over 40 minutes and their respective trend lines (linear)
Eye Gaze
The gaze for each eye is measured using a 2-dimensional vector consisting of angles 𝜃 and ϕ and is described earlier. Both acute eye gaze and chronic eye gaze are computed similarly to the head movements by considering the relative orientations of 𝜃 and ϕ. The chronic eye gaze and acute eye gaze over time is presented in the respective Fig. 8a and b. From the figure, it is evident that relative gaze for both acute eye gaze and chronic eye gaze increases over time. This is aligned with the previous observation of head movements and head poses. This implies eye movement increases as time progress in a given monotonic learning activity. Moreover, the amount of eye movements could be linked to the difficulty level of learning topics and exercises, i.e. one could observe higher eye movements for a difficult problem and could be linked to boredom, disengagement and off-task behavior (Godwin et al. 2013). Over the 40 minutes duration, the average chronic and acute relative eye gaze in degrees across all students are presented in Table 3. The trend is maintained like in previous observations of head movements and head poses in which chronic movements are significantly more than the acute.

Relative eye gaze measured in degrees over a duration of 40 minutes and the respective trend lines (linear)
Emotions and HoF Gestures
In order to evaluate the emotional engagement of the learner, we automatically detect the important affective states (happy, sad, surprise, disgust, neutral and hand-over-face) of a learner. Each frame is labeled with either HoF gestures or an emotion (happy, sad, surprise, disgust and neutral) and associated probability. If a frame is assigned with multiple emotions, then we consider the emotion with the highest probability as the main one. Then the number of emotions within a one-minute video clip is computed by simply counting and then each emotion is represented as a percentage by dividing the total number of frames within the one-minute video clip. Finally, we compute the average of emotional appearance over all students. The six various emotions over time is shown in Fig. 9 and the average value over 40 minutes video across all subjects is presented in Table 4.

Average percentage of happy, sad, surprise, disgust and neutral emotions, and hand-over-face (HoF) gestures and their trend lines
From Fig. 9, it is clear that the emotion-neutral is decreasing as time progress whereas HoF is increasing. The rest of the emotions are approximately steady. We found that the HoF gestures is novel and quite frequent in a learning domain and has not been reported earlier. It is also observed that the least emotions (< 10%, Table 4) are happiness (5.64%), disgusted (7.46%) and surprise (2.45%). The similar observation in the recent studies (D’Mello 2013; Bosch and D’Mello 2014) shows these emotions are infrequent in a learning domain. However, in our study, the average emotion of sadness is 13.89%. This contradicts the above studies which show the sadness emotion is least likely to occur in a learning environment. This could be due to the inference in the above studies is based on affect judgments by students themselves, untrained and trained peers. Whereas, in our cases, we use computer vision and machine learning techniques for automatic detection of such emotions. Moreover, the detected emotions are linked to the context of the undergraduate computer science topics, and therefore there is a possibility of the appearance of context-dependent emotions.
Student Engagement Linked to Reading, Problem-solving and its Difficulty Level
In this section, we look into the nonverbal engagement associated with the specific task and their difficulty level. Earlier, it is mentioned that students are required to find solutions for given exercises. Before each exercise (Table 1), students were given learning materials covering that exercise topic. These learning materials are provided in the form of slides and students were given a fixed amount of time to go through these learning materials before attempting the exercises. The time spent on each exercise also fixed (Table 1).
Emotions and HoF Gestures
Figure 10 shows the neutral and disgusted emotions, as well as HoF gestures linked to different learning activities. Each column is associated with a specific topic - column 1: negative numbers (easy), column 2: Fibonacci computation (medium) and column 3: longest common subsequence (difficult). In each column, the top plot represents the emotions exhibited while students were going through the learning materials and the bottom plot shows while solving the respective linked exercise. From the figure, the neutral and HoF gestures are prominent.

Neutral and disgusted emotions, and hand-over-face gestures and their respective trend lines (linear) linked to reading and problem-solving activities with various difficulty level. From top to bottom, row 1: reading, row 2: problem-solving and from left to right, column 1: easy, column 2: medium and column 3: difficult
It is noted earlier that the emotion “disgusted” appears infrequent in learning domain (Table 4). It is clearly evident that the trend line slope of the HoF gestures gets steeper (bottom row: left-to-right) as the difficulty level increases, i.e. bottom-left (easy): slope = 0.0143, bottom-middle (medium): slope = 0.064 and bottom-right (difficult): slope = 0.0955. This implies students are more likely to move their hand over their face when they solve a difficult problem. The other noticeable observation is that the same slopes appear in the first row is very small (left-to-right: 0.0294, 0.0086 and 0.0002) except the first one. The high slope (0.0294) in the beginning could be linked to the beginning of the session and students are more inclined to engage towards the learning materials. Overall, it can be concluded that while engaging with reading, students are less likely to exhibit HoF gestures (first row - less than 25%) and when they switched to solving the problem, the HoF gestures increases significantly (can go up to 50% for the difficult task). This is clearly visible in Fig. 11, and the average values are presented in Table 5 (last column). As the HoF gestures increase the neutral emotion decreases (negative slope in the trend line) while solving the exercises (bottom row). However, it stays approximately at the same level (negligible slope) during reading. The HoF gestures appears more during problem-solving (Table 5) than reading learning materials. In both reading and problem-solving, it increases with the level of difficulty with the only exception in the level medium in problem-solving (Fig. 11 and Table 5). Similarly, the sadness, happy and surprised emotions are presented in Table 5. It is observed that these emotions are quite infrequent.

HoF gestures linked to reading learning materials, solving related exercises and their respective levels
Head Movements
Figure 12 displays both the chronic and acute head movements in reading and engaging with the problem-solving activity along with the respective complexity level (easy, medium and difficult). The respective average movement values are presented in Table 6. From both the Fig. 12 and Table 6, it is very clear that the chronic head movements during problem-solving are much higher than the respective values during reading. The normalized chronic movements during solving difficult problem (0.58) is much more than the respective medium (0.36) and easy (0.49) problem. The chronic movements during problem-solving involving three different difficulty (easy, medium and difficult) levels are much higher than the respective chronic movements during reading task. This suggests that the head dynamics is more prominent during a problem-solving activity if students find it difficult to solve. It is also observed that the value decreases while engaging with reading for the easy and the medium level topics (Fig. 12) but it increases in the difficult level. While engaging with the exercises, it increases for both the easy and the difficult level but decreases during the medium level. There is not much prominent change in the acute head movements during various levels of activity. This could be due to that the current measurement is compared to the previous measurement taken one second before. In the near future, we would like to explore this by considering multiple comparisons.

Normalized relative head movements (chronic and acute) and their respective trend lines (linear) linked to reading learning materials, solving related exercises and their respective level (easy, medium and difficult)
Head Poses
The relative head pose (pitch, yaw and roll) for both chronic and acute is measured in degrees. The average movements per activity are shown in Table 6. It is noticed that the same trend as in head movements, i.e. the chronic relative head pose is significantly more than the acute one and within the chronic, the relative head pose during problem-solving is more than during reading, and increases with the topic difficulty. In both head pose and head movements (Table 6), it is also observed that the measured chronic and acute values increase with the topic difficulty in each activity (learning and problem-solving) except in acute reading. However, in the acute reading the difference is very small (average relative head poses < 0.20 degree and average relative head movements < 0.01). The head poses linking learning task types and their difficulty level is shown in the supplementary figure (Fig. 13). It is observed that the relative chronic head poses during solving a difficult problem is higher than the rest. There are not any significant changes in the slope of the graph during solving difficult problem as the task progresses. A similar observation is observed for the relative acute head poses. In comparison to the head movements, there is not much difference between the chronic and the acute head pose, and could be due to the students are being engaged with a laptop which has a small display (19 inch) area. Thus, there is a little chance of significant change in head pose.
Eye Gaze
For both left and right eyes, the relative gaze movements are captured in two angles (𝜃 and ϕ) in degrees using spherical coordinates as described earlier. The average of chronic and acute gaze movements of both eyes are presented in Table 6. The observations are similar to the head movements, and head poses described in the previous section, i.e. the measured values in the chronic gaze movement is more than the respective acute. We have also provided the relative eye gazes linking task types and their difficulty level in the accompanying supplementary figure (Fig. 14). The similar trend as in head movements (Fig. 12) and relative head pose (Fig. 13) is observed. The measurements during the problem-solving are more prominent than the reading activity in both the chronic and acute measurements. It is also observed that within each activity, the gaze movements increase with the problem difficulties except the 𝜃 values (both left and right eyes) in the chronic reading. It is also noticed that the relative changes in degrees are more significant in the eye gazes than the head poses. This is mainly due to the students being engaged with a laptop which has a small display (19 inch) area. Thus, there is a little chance of significant change in head pose i.e. in such scenarios, the head and eye movements are more prominent than the relative head pose. Therefore, in such scenarios the head and eye movements are vital cues and more appropriate for emotion indicators.
Discussion
Increasing personalization (‘fit-for-everyone’) has emerged as a key challenge for teachers, researchers and educational institutions. Subsequently, many of the current learning technologies/tools are designed to measure learner’s engagement and their capacity by exploring their behavioral cues (e.g. emotions, effective states, body language). There is some extent of automation or semi-automation in monitoring such behavior in a classroom environment; however, most of such tools are focused on measuring engagement using traditional techniques such as self-reports, teachers’ introspective evaluations and checklists. These techniques are not only cumbersome and labor-intensive but also lack temporal resolution which is required to grasp the interplay between engagement and learning. Moreover, in some cases, it captures the students’ compliance rather than their engagement (Whitehill et al. 2014). More recently, (semi-)automated tools have been developed to monitor learner’s affective states (e.g. emotions) to understand effective student engagement (Bosch et al. 2015; Bosch and D’Mello 2014; D’Mello 2013; Calvo and D’Mello 2010; Woolf et al. 2009). These tools are mostly focused on facial expression as a key channel for modeling and recognizing affective states.
In this section, we will first discuss the limitation of the current study before discussing the implications of the major findings and for future work with automatic monitoring of nonverbal behavior for personalized education.
Limitations of the Current Study
Regarding participants, our sample of convenience consists of university students but has not included female learners, which is important as gender influences body language (Boker et al. 2011). This was because we had no volunteers from female students. It would have been helpful to the study to include a larger sample size with an equal number of male and female students from each year group. The detection and measurement of nonverbal behavior do not examine the students’ interest, capacity, prior subject knowledge or enthusiasm. Regarding detection and measurements, the study relies heavily on the automatic detection of faces and six basic emotions using the IntraFace tool (De la Torre et al. 2015). However, this tool is state-of-the-art, and the recognition performance is better in comparison to other techniques. The acquired facial landmark positions, head pose and eye movements are computed in the image plane and would have been advantageous if these measurements are carried out in real-world coordinates. Nevertheless, the real-world measurements would have been much more tedious, laborious and complicated since it requires sophisticated sensing technologies and specialized environments in which students might not display their natural behavior. Moreover, the proposed method uses a low-cost webcam fixed on a laptop and can be deployable in any environment. The distance of the head-and-shoulder from the laptop’s monitor is not a major issue since students were using the same laptop for their learning activity during the experiment. The used metric for detecting nonverbal behaviors linked to engagement is limited since it does not examine constructivist or active engagement.
Implications of the Current Study
In this study, we extend the prior research on affective state recognition in the context of learning and teaching (Whitehill et al. 2014; D’Mello 2013; Calvo and D’Mello 2010; Woolf et al. 2009) and is arguably the most in-depth study on this topic today. Extensive and ongoing research has examined what kind of affective states should be utilized for greatest effectiveness in a learning environment. Detecting nonverbal behaviors and how they should most effectively be used in a learning environment is important for appropriate intervention and in designing learning technologies for personalized learning. Furthermore examining nonverbal behaviors involving which body-part movements, how many movements, movements over time, HoF gestures, emotions and how these are related to different difficulty levels in learning topics would be most helpful in providing additional aid to learners striving to achieve these goals.
Computers/laptops are widely used in both mediated and self-directed learning in a classroom environment, as well as in distance learning and MOOCs. In this study, we focus on automatic monitoring of nonverbal behavior in such scenarios using a webcam attached to the monitor. We collected a video dataset consisting of students’ head-and-shoulder while reading and solving problems with the complexity of easy, medium and difficult. We automatically detected and tracked faces on these videos. Then, we analyzed various body-part movements, HoF gestures and emotions linked to this learning environment.
We identified behavior indicators in the form of acute (instantaneous) and chronic (long-term) body-parts (relative head movements, relative head poses, relative eye gazes) movements. We found that both acute and chronic movements increase as classroom time progresses. However, the chronic movements are significantly larger than the acute. We also identified a novel HoF gestures (21.35%) as a behavior indicator in this learning context. We evaluated these gestures during problem-solving activity with the three levels of difficulties (easy - 23.79%, medium - 19.84% and difficult - 30.46%). We found that these gestures are more frequent in problem-solving than engaged with a reading task (easy - 16.20%, medium - 20.06% and difficult - 20.18%). We also noticed the same trend in the chronic head movements, i.e. more significant movements during the problem-solving than engaged with reading. We observed that both the chronic head movements and the HoF gestures increased significantly with the difficulty of the learning topic and the linked exercise. We found the similar trend in relative head pose and eye gaze, but the increment was not as much as in the chronic head movements and the HoF gestures. We also looked into the appearance of other emotions such as happy, sad, surprise and disgust. These emotions appeared infrequently. This confirms a similar observation in the recent studies (Bosch and D’Mello 2014; D’Mello 2013). In this study, we carried out a detailed quantitative analysis of body-part movements and gestures/emotions change over time, learning types and the difficulty of the learning topics. This can be linked to the students’ engagement and can further be explored by the education researchers and technology developers to provide more efficient and appropriate support and interventions in a learning environment. Not only is this significantly helpful for the human teachers but can also be easily integrated into developing intelligent learning technologies to automate the monitoring process.
We identified both factors (passage of time and difficulty) that could influence the occurrence of certain behaviors. Nevertheless, we also measure instantaneous behavioral cues as time progresses within a given difficulty level and learning task (reading vs problem-solving). The general trend is that some of the instantaneous behavioral cues (e.g. HoF) increases as time progresses (see Figs. 10-12) even on a fixed difficulty level. In the case of a difficult task, the progression is much steeper (higher slope in Figs. 10 and 11) or the values are higher, i.e. the progression line is placed above the respective progression lines representing easier tasks (see Fig. 12). This has significantly helped in differentiating factors contributing to certain behavioral cues.
Future Directions and Implications for Technology-enhanced Teaching and Learning
The study described here contributes to our growing understanding of the nonverbal behavior indicators, which play a significant role in facilitating student engagement. The proposed method provides a collection of models, tools and metaphors to understand students’ behavior and can easily be incorporated into the modern learning technologies without requiring any specialized hardware. The proposed study quantitatively evaluates the body-part movements and instantaneous gestures/emotions over classroom time, specific to learning mode (i.e. reading vs problem-solving) and the relationships to the subject difficulty (easy, medium and difficult), to monitor student engagement. One of the future work is to explore the mixed emotions that simultaneously occur at a given time point to infer high-level emotions such as affective experiences (anxiety, boredom, confusion, engaged concentration and frustration) in an educational setting (D’Mello 2013; Woolf et al. 2009). The other future work is to explore and develop machine learning algorithms for the recognition of the fine-grained hand-over-face affective states in the context of learning and teaching and its relationships to the student engagement.
Conclusion
In this study, we have explored the variety of nonverbal behaviors (emotions, head movements, head pose, eye gaze, hand-over-face (HoF) gestures), which can easily be integrated with the modern learning technologies to recognize students affective states in real-time. The automatic detection of these behaviors uses a state-of-the-art computer vision technique applied to videos captured using a webcam. We propose a novel approach for HoF gestures recognition from still images. The approach is based on the state-of-the-art deep neural networks and achieved a classification accuracy of 86.87%. We have compared the performance of deep vs handcrafted features and shown that the deep features outperformed the handcrafted features. The proposed study also assesses the HoF gestures, various movements and emotions, and their relationships to the classroom behavior - (1) as classroom time progress, (2) while engrossed with learning materials, (3) during solving problems and (4) the content complexity level (easy, medium and difficult). We have found that there is a significant increase in HoF gestures when difficulty level of given exercises increases. We have also demonstrated a similar trend using upper-body gestures such as relative head poses, head movements and eye gazes. We have explained the importance of these behavioral cues linking learning activities involving reading and problem-solving with various levels of difficulties. We believe this finding will help in advancing the field of AI applications in developing learning technologies.
References
Ambady, N., & Rosenthal, R. (1992). Thin slices of expressive behavior as predictors of interpersonal consequences: a meta-analysis. Psychological Bulletin, 111 (2), 256.
Andallaza, T.C.S., Rodrigo, M.M.T., Lagud, M.C.V., Jimenez, R.J.M., Sugay, J.O. (2012). Modeling the affective states of students using an intelligent tutoring system for algebra. In Proc. International Workshop on Empathic Computing (IWEC).
Anderson, A.R., Christenson, S.L., Sinclair, M.F., Lehr, C.A. (2004). Check & Connect: The importance of relationships for promoting engagement with school. Journal of School Psychology, 42(2), 95–113.
Arroyo, I., Ferguson, K., Johns, J., Dragon, T., Meheranian, H., Fisher, D., Barto, A., Mahadevan, S., Woolf, B.P. (2007). Repairing disengagement with non-invasive interventions, (Vol. 2007 pp. 195–202).
Arroyo, I., Cooper, D.G., Burleson, W., Woolf, B.P., Muldner, K., Christopherson, R. (2009). Emotion sensors go to school. AIED, 200, 17–24.
Bahreini, K., Nadolski, R., Westera, W. (2016). Towards multimodal emotion recognition in e-learning environments. Interactive Learning Environments, 24(3), 590–605.
Ball, K.M. (2003). Fibonacci’s Rabbits Revisited, Strange Curves, Counting Rabbits, and Other Mathematical Explorations. Princeton: Princeton University Press.
Beattie, G. (2016). Rethinking body language: How hand movements reveal hidden thoughts. Routledge.
Benitti, F.B.V. (2012). Exploring the educational potential of robotics in schools. Computers & Education, 58(3), 978–988.
Bligh, D. (2002). What’s the use of lectures. Intellect, Exeter.
Boker, S.M., Cohn, J.F., Theobald, B.J., Matthews, I., Mangini, M., Spies, J.R., Brick, T.R. (2011). Something in the way we move: motion, not perceived sex, influences nods in conversation. Journal of Experimental Psychology: Human Perception and Performance, 37(3), 874–891.
Bosch, N., & D’Mello, S. (2014). Co-occurring affective states in automated computer programming education. In 12th International Conference on Intelligent Tutoring Systems Proc Workshop on AI-supported Education for Computer Science (AIEDCS) (pp. 21–30).
Bosch, N., D’Mello, S., Baker, R., Ocumpaugh, J., Shute, V., Ventura, M., Wang, L., Zhao, W. (2015). Automatic detection of learning-centered affective states in the wild. In Proc. International Conference on Intelligent User Interfaces (IUI ’15) (pp. 379–388). New York: ACM.
Bransford, J.D., Brown, A.L., Cocking, R.R. (2000). How People Learn: Brain, Mind, Experience and School. Committee on Developments in the Science of Learning, NRC Commission on Behavioral and Social Sciences and Education. Washington: National Academies Press.
Burleson, W., & Picard, R.W. (2004). Affective agents: Sustaining motivation to learn through failure and a state of stuck. In Workshop on Social and Emotional Intelligence in Learning Environments, 7th International Conference on Intelligent Tutoring Systems.
Busso, C., Deng, Z., Grimm, M., Neumann, U., Narayanan, S. (2007). Rigid head motion in expressive speech animation: Analysis and synthesis. IEEE Transactions on Audio, Speech, and Language Processing, 15(3), 1075–1086.
Calvo, R.A., & D’Mello, S. (2010). Affect detection: an interdisciplinary review of models, methods, and their applications. IEEE Transactions on Affective Computing, 1(1), 18–37.
Cao, Z., Simon, T., Wei, S.E., Sheikh, Y. (2017). Realtime multi-person 2d pose estimation using part affinity fields. In IEEE Computer Vision and Pattern Recognition (CVPR).
Cavanagh, M. (2011). Students’ experiences of active engagement through cooperative learning activities in lectures. Active Learning in Higher Education, 12 (1), 23–33.
Chellappa, R., Wilson, C., Sirohey, S. (1995). Human and machine recognition of faces: a survey. Proceedings of the IEEE, 83(5), 705–740.
Cohn, J.F., Reed, L.I., Moriyama, T., Xiao, J., Schmidt, K.L., Ambadar, Z. (2004). Multimodal coordination of facial action, head rotation, and eye motion. In Proc. 6th IEEE Int. Conf. Automatic Face Gesture Recognition (pp. 129–138). Seoul, Korea.
Conati, C., Jaques, N., Muir, M. (2013). Understanding attention to adaptive hints in educational games: an eye-tracking study. International Journal of Artificial Intelligence in Education, 23(1), 136–161. https://doi.org/10.1007/s40593-013-0002-8.
Cook, S., & Goldin-Meadow, S. (2006). The role of gesture in learning: Do children use their hands to change their minds? Journal of Cognition and Development, 7(2), 211–232.
Dalal, N., & Triggs, B. (2005). Histograms of oriented gradients for human detection. In IEEE Computer Vision and Pattern Recognition (pp. 886–893).
Darwin, C. (1872/1998). The expression of the emotions in man and animals. John Murray, London.
Davis, D. (2008). A brain-friendly environment for learning. Faculty Focus, http://www.facultyfocus.com/articles/instructional-design/a-brain-friendly-environment-for-learning/.
Ding, C., & Tao, D. (2016). A comprehensive survey on pose-invariant face recognition. ACM Transactions on Intelligent Systems and Technology (TIST), 7(3), 37.
Dirkx, J. (2006). Engaging emotions in adult learning: A Jungian perspective on emotion and transformative learning. New Directions for Adult & Continuing Education, 2006(109), 15–26.
D’Mello, S. (2013). A selective meta-analysis on the relative incidence of discrete affetcive states during learning with technology. Journal of Educational Psychology, 105(4), 1082.
D’Mello, S., Craig, S.D., Gholson, B., Franklin, S., Picard, R., Graesser, A. (2005). Integrating affect sensors in an intelligent tutoring system. In Affective Interactions: The Computer in the Affective Loop Workshop (pp. 7–13).
D’Mello, S., Picard, R.W., Graesser, A. (2007). Toward an affect-sensitive autotutor. IEEE Intelligent Systems, 22(4), 53–61.
D’Mello, S., Lehman, B., Sullins, J., Daigle, R., Combs, R., Vogt, K., Perkins, L., Graesser, A. (2010). A time for emoting: When affect-sensitivity is and isn’t effective at promoting deep learning. In International Conference on Intelligent Tutoring Systems (pp 245–254). Springer.
D’Mello, S., Olney, A., Williams, C., Hays, P. (2012). Gaze tutor: a gaze-reactive intelligent tutoring system. International Journal of Human-Computer Studies, 70(5), 377–398. https://doi.org/10.1016/j.ijhcs.2012.01.004.
D’Mello, S., Dieterle, E., Duckworth, A. (2017). Advanced, analytic, automated (aaa) measurement of engagement during learning. Educational Psychologist, 52(2), 104–123. https://doi.org/10.1080/00461520.2017.1281747.
Ekman, P. (1992). An argument for basic emotions. Cognition and Emotion, 6(3), 169–200.
Ekman, P., & Friesen, W. (1969). The repertoire of nonverbal behavior: categories, origins, usage, and coding. Semiotica, 1(1), 49–98.
Fan, R.E., Chang, K.W., Hsieh, C.J., Wang, X.R., Lin, C.J. (2008). Liblinear: a library for large linear classification. Journal of Machine Learning Research, 9, 1871–1874.
Fasel, B., & Luettin, J. (2003). Automatic facial expression analysis: a survey. Pattern Recognition, 36(1), 259–275.
Forbes-Riley, K., & Litman, D. (2012). Adapting to multiple affective states in spoken dialogue. In Proceedings of the 13th Annual Meeting of the Special Interest Group on Discourse and Dialogue, Association for Computational Linguistics (pp. 217–226).
Fredricks, J.A., Blumenfeld, P.C., Paris, A.H. (2004). School engagement: Potential of the concept, state of the evidence. Review of Educational Research, 74 (1), 59–109.
Gelder, B.D. (2006). Towards the neurobiology of emotional body language. Nature Reviews Neuroscience, 7(3), 242–249.
Gelder, B.D. (2009). Why bodies? Twelve reasons for including bodily expressions in affective neuroscience. Philosophical Transactions of the Royal Society of London Series B, Biological Sciences, 364(1535), 3475–3484.
Givens, D.B. (2002). The Nonverbal Dictionary of Gestures Signs & Body Language Cues from Adam’s-apple-jump to Zygomatic Smile. Spokane: Center for Nonverbal Studies Press.
Godwin, K.E., Almeda, M.V., Petroccia, M., Baker, R.S., Fisher, AV. (2013). Classroom activities and off-task behavior in elementary school children. In Proc. 35th Annual Meeting of the Cognitive Science Society (pp. 2428–2433). Germany: Berlin.
Gordon, G., Spaulding, S., Westlund, J.K., Lee, J.J., Plummer, L., Martinez, M., Das, M., Breazeal, C. (2016). Affective personalization of a social robot tutor for children’s second language skills. In Proc. of the Thirtieth AAAI Conference on Artificial Intelligence (pp. 3951–3957).
Graesser, A., D’Mello, S., Chipman, P., King, B., McDaniel, B. (2007). Exploring relationships between affect and learning with AutoTutor. In Proc. Artificial Intelligence in Education (pp. 16–23).
Hirschberg, D.S. (1977). Algorithm for the longest common subsequence problem. Journal of ACM, 24(4), 664–675.
Johns, J., & Woolf, B. (2006). A dynamic mixture model to detect student motivation and proficiency. Proceedings of the national conference on artificial intelligence, 21, 163.
Jones, A., Küster, D., Basedow, C.A., Alves-Oliveira, P., Serholt, S., Hastie, H., Corrigan, L.J., Barendregt, W., Kappas, A., Paiva, A., Castellano, G. (2015). Empathic Robotic Tutors for Personalised Learning: A Multidisciplinary Approach. Springer International Publishing.
Kaliouby, R., & Robinson, P. (2005). Real-time inference of complex mental states from facial expressions and head gestures. In Proc. Real-Time Vision for HCI (pp. 181–200).
Kapoor, A., Burleson, W., Picard, R.W. (2007). Automatic prediction of frustration. International Journal of Human-computer Studies, 65(8), 724–736.
Karg, M., Samadani, A.A., Gorbet, R., Kühnlenz, K., Hoey, J., Kulić, D. (2013). Body movements for affective expression: a survey of automatic recognition and generation. IEEE Transactions on Affective Computing, 4(4), 341–359.
Keltner, D. (1995). Signs of appeasement: Evidence for the distinct displays of embarrassment, amusement and shame. Journal of Personality and Social Psychology, 68(3), 441–454.
Kessell, A.M., & Tversky, T. (2005). Gestures for thinking and explaining. Proc. Annual Meeting of the Cognitive Science Society, 27, 2498.
Laptev, I. (2005). On space-time interest points. International Journal of Computer Vision, 64, 107–123.
Lepper, M.R., & Hodell, M. (1989). Intrinsic Motivation in the Classroom. San Diego: Academic Press.
Lepper, M.R., Woolverton, M., Mumme, D.L., Gurtner, J.L. (1993). Motivational Techniques of Expert Human Tutors: Lessons for the Design of Computer-based Tutors. Hillsdale: Lawrence Erlbaum Associates.
Litman, D.J., & Forbes-Riley, K. (2004). Predicting student emotions in computer-human tutoring dialogues. In Proc. 42nd Annual Meeting on Association for Computational Linguistics (p 351).
Livingstone, R. (1941). The future in education. Cambridge University Press.
Lowe, D.G. (2004). Distinctive image features from scale-invariant keypoints. International Journal of Computer Vision, 60(2), 91–110.
Mahmoud, M., & Robinson, P. (2011). Interpreting hand-over-face gestures. In Proc. International Conference on Affective Computing and Intelligent Interaction (pp. 248–255).
Mahmoud, M., Baltrušaitis, T, Robinson, P. (2016). Automatic analysis of naturalistic hand-over-face gestures. ACM Transactions on Interactive Intelligent Systems, 6(2), 19:1–19:18.
Mathews, M., Mitrovic, A., Lin, B., Holland, J., Churcher, N. (2012). Do Your Eyes Give It Away? Using Eye Tracking Data to Understand Students’ Attitudes towards Open Student Model Representations, (pp. 422–427). Berlin: Springer.
McNeill, D. (1992). Hand and mind: What gestures reveal about thought. University of Chicago press.
Mehta, D., Siddiqui, M., Javaid, A. (2018). Facial emotion recognition: a survey and real-world user experiences in mixed reality. Sensors, 18(2), 416.
Meservy, T.O., Jensen, M.L., Kruse, J., Burgoon, J.K., Nunamaker, J.F., Twitchell, D.P., Tsechpenakis, G., Metaxas, D.N. (2005). Deception detection through automatic, unobtrusive analysis of nonverbal behavior. IEEE Intelligent Systems, 20(5), 36–43.
Meyer, D.K., & Turner, J.C. (2002). Discovering emotion in classroom motivation research. Educational Psychologist, 37(2), 107–114.
Mota, S., & Picard, R.W. (2003). Automated posture analysis for detecting learner’s interest level. In 2003 Conference on Computer Vision and Pattern Recognition Workshop, (Vol. 5 pp. 49–49): IEEE.
Mudrick, N.V., Taub, M., Azevedo, R., Rowe, J., Lester, J. (2017). Toward affect-sensitive virtual human tutors: The influence of facial expressions on learning and emotion. In 2017 Seventh International Conference on Affective Computing and Intelligent Interaction (ACII) (pp. 184–189). IEEE.
Norman, D.A. (1981). Twelve Issues for Cognitive Science, (pp. 265–295). Hillsdale: Lawrence Erlbaum Associates.
Pease, A., & Pease, B. (2006). The definitive book of body language: How to read others’ attitudes by their gestures. Orion, London, England.
Perry, B.D. (2006). Fear and learning: Trauma-related factors in the adult education process. New Directions for Adult & Continuing Education, 2006(110), 21–27.
Peters, C., Asteriadis, S., Karpouzis, K. (2010). Investigating shared attention with a virtual agent using a gaze-based interface. Journal on Multimodal User Interfaces, 3(1-2), 119–130.
Picard, R.W., Papert, S., Bender, W., Blumberg, B., Breazeal, C., Cavallo, D., Machover, T., Resnick, M., Roy, D., Strohecker, C. (2004). Affective learning – a manifesto. BT Technology Journal, 2(4), 253–269.
Rautaray, S.S., & Agrawal, A. (2015). Vision-based hand gesture recognition for human computer interaction: a survey. Artificial Intelligence Review, 43(1), 1–54.
Razavian, A.S., Azizpour, H., Sullivan, J., Carlsson, S. (2014). Cnn features off-the-shelf: An astounding baseline for recognition. In IEEE CVPRW (pp. 512–519).
Reeve, J. (2001). Understanding motivation and emotion. Harcourt College, Fort Worth, TX.
Roth, W. (2001). Gestures: Their role in teaching and learning. Review of Educational Research, 71(3), 365–392.
Russakovsky, O., Deng, J., Su, H., Krause, J., Satheesh, S., Ma, S., Huang, Z., Karpathy, A., Khosla, A., Bernstein, M., Berg, A.C., Fei-Fei, L. (2015). Imagenet large scale visual recognition challenge. International Journal of Computer Vision, 115(3), 211–252. https://doi.org/10.1007/s11263-015-0816-y.
Shan, C., Gong, S., McOwan, P.W. (2009). Facial expression recognition based on local binary patterns: a comprehensive study. Image and Vision Computing, 27(6), 803–816.
Shuck, B., Albornoz, C., Winberg, M. (2007). Emotions and their effect on adult learning: a constructivist perspective. In Nielsen, S.M., & Plakhotnik, M.S. (Eds.) Proc. Sixth Annual College of Education Research Conference: Urban and International Education Section (pp. 108–113).
Simonyan, K., & Zisserman, A. (2014). Very deep convolutional networks for large-scale image recognition. arXiv:1409.1556.
Szegedy, C., Vanhoucke, V., Ioffe, S., Shlens, J., Wojna, Z. (2016). Rethinking the inception architecture for computer vision. In IEEE Computer Vision and Pattern Recognition (CVPR), pp 2818–2826.
Szegedy, C., Ioffe, S., Vanhoucke, V., Alemi, A.A. (2017). Inception-v4, inception-resnet and the impact of residual connections on learning. In AAAI (pp. 4278–4284).
Tieleman, T., & Hinton, G. (2012). Coursera: Neural networks for machine learning. http://www.cs.toronto.edu/tijmen/csc321/slides/lecture_slides_lec6.pdf.
De la Torre, F., & Cohn, J.F. (2011). Visual Analysis of humans: Facial expression analysis. In Proc. Visual Analysis of Humans: Looking at People (pp. 377–410).
De la Torre, F., Chu, W.S., Xiong, X., Vicente, F., Ding, X., Cohn, J.F. (2015). Intraface. In IEEE International Conference on Automatic Face and Gesture Recognition (FG), Ljubljana, Slovenia.
Wallbott, H.G. (1998). Bodily expression of emotion. European Journal of Social Psychology, 28(6), 879–896.
Watson, W.R., Watson, S.L., Reigeluth, C.M. (2015). Education 3.0: Breaking the mold with technology. Interactive Learning Environments, 23(3), 332–343.
Whitehill, J., Serpell, Z., Lin, Y.C., Foster, A., Movellan, J.R. (2014). The faces of engagement: Automatic recognition of student engagement from facial expressions. IEEE Transactions on Affective Computing, 5(1), 86–98.
Wolfe, P. (2006). The role of meaning and emotion in learning. New Directions for Adult & Continuing Education, 2006(110), 35–41.
Woolf, B. (2009). Building Intelligent Interactive Tutors: Student-Centered Strategies for Revolutionizing E-learning. San Francisco: Morgan Kauffman.
Woolf, B., Burleson, W., Arroyo, I., Dragon, T., Cooper, D., Picard, R. (2009). Affect-aware tutors: Recognising and responding to student affect. International Journal of Learning Technology, 4(3/4), 129–164.
Xiao, B., Georgiou, P.G., Baucom, B., Narayanan, S. (2013). Data driven modeling of head motion toward analysis of behaviors in couple interactions. In Proc. IEEE Int. Conf. Acoustic, Speech, Signal Processing (pp. 3766–3770).
Yosinski, J., Clune, J., Bengio, Y., Lipson, H. (2014). How transferable are features in deep neural networks? In Advances in Neural Information Processing Systems (NIPS) (pp. 3320–3328).
Zeng, Z., Pantic, M., Roisman, G.I., Huang, T.S. (2009). A survey of affect recognition methods: audio, visual, and spontaneous expressions. IEEE Transactions on Pattern Analysis and Machine Intelligence, 31(1), 39–58.
Zhan, Z., Zhang, L., Mei, H., Fong, P.S.W. (2016). Online learners’ reading ability detection based on eye-tracking sensors. Sensors 16(9). https://doi.org/10.3390/s16091457.
Zhao, W., Chellappa, R., Phillips, P.J., Rosenfeld, A. (2003). Face recognition: a literature survey. ACM Computing Surveys (CSUR), 35(4), 399–458.
Acknowledgements
We would like to thank our students for taking part in this study voluntarily.
Author information
Authors and Affiliations
Corresponding author
Additional information
Publisher’s Note
Springer Nature remains neutral with regard to jurisdictional claims in published maps and institutional affiliations.
Electronic supplementary material
Below is the link to the electronic supplementary material.
Rights and permissions
Open Access This article is licensed under a Creative Commons Attribution 4.0 International License, which permits use, sharing, adaptation, distribution and reproduction in any medium or format, as long as you give appropriate credit to the original author(s) and the source, provide a link to the Creative Commons licence, and indicate if changes were made. The images or other third party material in this article are included in the article's Creative Commons licence, unless indicated otherwise in a credit line to the material. If material is not included in the article's Creative Commons licence and your intended use is not permitted by statutory regulation or exceeds the permitted use, you will need to obtain permission directly from the copyright holder. To view a copy of this licence, visit http://creativecommons.org/licenses/by/4.0/.
About this article

Cite this article
Behera, A., Matthew, P., Keidel, A. et al. Associating Facial Expressions and Upper-Body Gestures with Learning Tasks for Enhancing Intelligent Tutoring Systems. Int J Artif Intell Educ 30, 236–270 (2020). https://doi.org/10.1007/s40593-020-00195-2
Published:
Issue Date:
DOI: https://doi.org/10.1007/s40593-020-00195-2