
Abstract
This paper examines older driver’s automotive trip (abbreviation: trip) characteristics which include trip frequency, trip length, destination distribution, and non-home-based (NHB) trips. A two-month experiment of 108 participants was carried out to collect GPS tracking data in Aichi Prefecture, Japan. To identify the effect of living area, a comparative analysis between older drivers and others is conducted in densely inhabited district (DID, i.e., urban) and other areas (non-DID, i.e., suburban, rural, etc), separately. The present study found that there was no significant difference between the trip characteristics of older drivers and others who were living in DID. Thus, we suggest that the education of safety driving and the recommendation of public transportation should be given to DID-living older drivers. However, the results of non-DID reflected that older drivers’ trip frequency, trip length, destination, and NHB trips rate were shorter and lower than others’. This implies that electric vehicles may be suitable for promotion among older drivers in suburban and rural area. Furthermore, the regression analysis confirmed that “older driver” was a significant independent variable on trip frequency, trip length, and NHB trips, and there were interaction effects between “older driver” and “living areas” on all trip characteristics.
Find the latest articles, discoveries, and news in related topics.Avoid common mistakes on your manuscript.
1 Introduction
According to United Nations World Population Prospects (UNWPP), Japan has entered the period of a super-aged society [1]. With the highest proportion of older adults in the world, the number of older drivers in this country reached 16 million in 2015, and is expected to surpass 20 million by 2030 [2]. Meanwhile, the consequential increase of older driver-related accidents has also been an inevitable problem. For instance, although the number of traffic accidents in Tokyo has reduced by more than 50 % in the last decade, the ratio of older driver in all accidents nearly doubled from 10.9 % to 20.4 %.
Increasingly, researchers began to concern the aging problem in the car society. Many studies reported that physical and mental changes that often come with aging can affect older adult’s travel behaviors. By a 5-year survey-based study on the relationship between health problems and risk ratio among older drivers, MacLeod et al. [3] suggested to provide more driving training and assistance to older adults. Delhomme et al. [4] found that older drivers have some driving characteristics, such as driving at a steady speed, conservative use of the accelerator, gear shifting, etc. Ross et al. [5] indicated that most older adults tend to overrate their driving ability. In their research, 85.14 % of older participants believed themselves as either good or excellent drivers regardless of their actual previous citation or crash rates. Meanwhile, aging may also change people’s living and activity areas. Tahara and Iwadare [6] concluded that “younger” elderly people tend to move out from metropolitan areas, as opposed to “older” elderly people who have a higher tendency to move into metropolitan areas. Benekohal et al. [7] summarized the effects of aging on older drivers’ travel characteristics, which included travel frequency, travel time, trip length, etc. It suggested that all these indicators decrease significantly as the age of the driver increases. Moreover, Rothe [8] associated the high accident ratio of elderly drivers with their prominently frequent around-home driving.
Home-based (HB) and non-home-based (NHB) trips, which play an important role in trip generation, are also important to understand driver’s trip characteristics. By HB and NHB trips, the complex driving activities can be converted into number of trips [9]. Because trips must be generated by certain purposes, like from home to work, home to shop, or school to home, HB and NHB reflected drivers’ driving intention and travel convenience. Rothe’s statistics [8] showed that the main trip purpose of middle-aged group is commuting and social, while that of elderly group is personal and family. On the other hand, one consensus is that living area could affect driver’s NHB rate. Victor and Ponnuswamy [10] estimated that NHB trips might constitute 10 %–15 % of the total trips in most urban areas. Through an improved calculation model, Schultz and Allen [11] confirmed that NHB trips accounts for 25 %–30 % of urban-living driver’s travel. Moreover, Gonzalez-Ayala’s report [12] concluded that the NHB rate in urban area is lower than that in rural area. About this phenomenon, Hildebrand et al. [13] explained that rural-living participants tend to chain more activities together because they live further away from their desired destinations. However, it should be noted that Hildebrand’s study only focused on older drivers who were living in rural area, and hence, the comparative analysis between older drivers and other age groups was not conducted.
Another feature of these studies is that most of them are mainly based on the questionnaire survey. Although self-report study is widely used, it is difficult to avoid participant’s subjective effects, such as exaggeration, concealment, bias, etc. [14]. Ross and Dodson [5] even recommended to abandon survey-based study on older drivers because their feeling is likely not related to actual driving proficiency. Considering the limited reliability of self-report from older drivers, some studies analyzed trip characteristics by the GPS-based travel diaries which were collected by on-vehicle device [15, 16]. However, they still lack the contrastive study of older drivers and others among urban and rural areas.
Although some studies [17, 18] focused on the consequences of aging-related driving habits change and suggested to improve transportation alternatives, it often lacked specific suggestions on transportation planning for older adults living in different areas. For instance, public transportation has many advantages in urban area, but its demand, cost, and efficiency may decrease in suburban area. Even in the same living area, whether older adults driving less than others is still unclear. On the other hand, the development of electric vehicles (EVs) is deeply affecting transportation planning in current years [19]. However, although some automobile companies have viewed older adults as potential users, the feature caused by living area has not been considered yet. Associated with some travel behaviors of older adults, transportation infrastructure planning models and related policy issues about EVs may be developed or improved.
The aim of this study was to evaluate the older adult’s trip characteristics by comparing with other age groups both in urban and rural area. The research objects included trip frequency, trip length, destination distribution, and NHB trips. It should be noted that the trip in this paper was limited to automotive trip which did not consist of bus, walk, or any other transportation mode. A 2011’s official survey [20] suggested that automotive trip accounted for about 67 % of all trips in the areas of this study. It could be further estimated that automotive trip occupied more than 83.75 % in the trips of this study’s participants who were holding driving licenses and vehicles [20, 21]. According to some research [22], it can be inferred that the automotive trip’s rate in suburban/rural is even higher than that in urban area.
Further aims of this study were to confirm whether the indicator of “older driver” could affect trip characteristics; and to identify the interaction impact factors with older driver on travel behavior. Except for the basic information such as gender, age, and address, this study mainly relied on probe vehicle (PV) data instead of questionnaire survey. The results may contribute to the improvement of driving assistant, driving training, and transportation plan for older drivers.
2 Data and terminology
121 Drivers were recruited in the data-collection experiment, which was carried out mainly in Aichi Prefecture, Japan from April 1 to May 31, 2013. Before the experiment, they were permitted to install data-collection devices in their vehicles and then fill in basic information survey. Due to machine faults or operation mistakes, there are 108 valid experiment subjects out of 121 participants. The following three broad categories of data were assembled in this study.
-
(1)
Driver’s characteristics (e.g., name, gender, age, address, etc.)
-
(2)
PV data (e.g., location, speed, date and time, engine on/off, etc.)
-
(3)
Region classification by population density (e.g., densely inhabited district or nondensely inhabited district, etc.)
Following the introduction of data, the terminology in this study will be given.
2.1 Driver’s characteristics
Driver’s characteristics were obtained by questionnaire survey before the experiments. Participants were asked 18 background questions. According to age (mean = 40.3; SD = 11), gender, and employment status, experimental subjects are categorized into different groups as shown in Table 1. The information of employment status is used in the judgment of commute trip which is engaged by only employee, student, or self-employed person. It must be admitted that older drivers (10, 9.3 %) and nonworkers (11, 10.2 %) make up a relatively small proportion of the whole sample. However, in order to ensure that the long experiment of data collection was carried out smoothly, the sample has to bias on workers and students who are below 60 years old. Table 1 also lists the population and proportion of the study area by each age group [23]. It should be noted that although female comprises a relatively higher proportion of older adults, they are fewer in this study because of the lower rate of female license-holding (30.02 %) in all older drivers [24].
2.2 PV data
The PV data were collected by in-vehicle devices which were equipped in each experimental car, separately. After starting the device, data were constantly sent from the moving car to the nearby base stations or receiving nodes. There are 78 channels which record the types of number, string, date, etc. Some of the data describe the road positions or environments, such as GPS (latitude, longitude, altitude, etc.) and road ID. Other data present vehicle’s moving information, such as fuel consumption (0.1 km/L), running speed (km/h), and engine speed (rpm). Data are eliminated, while engine is off or GPS data are invalid (e.g., driving in tunnel, on mountain road, or underneath the viaduct). It should be noted that once GPS signal is missed (e.g., after entering tunnel), localization estimation algorithm (LEA) embedded in the in-vehicle device will be operated automatically. Based on this algorithm, the vehicle is assumed in the extension line of the last-recorded direction at a constant speed which maintains the last-recorded speed. Considering the low credibility, the estimated records are also deleted in this study.
2.3 Region classification by population density
Based on the 2010’s population census conducted by Statistics Bureau of Japan [25], densely inhabited districts (DIDs) are designated in units of census basic unit blocks, and census enumeration districts if there are several census enumeration districts in a census basic unit block, and should coincide with the following criteria.
-
1.
A district containing basic unit blocks, etc., with a population density of 4,000 or more per square kilometer, such districts being adjacent to each other in a municipality
-
2.
A district consisting of the above adjacent basic unit blocks, etc., whose population is 5,000 or more at the time of the Population Census of Japan
Based on the definition above, DIDs could be viewed as urban areas, while non-DIDs represents rural areas, suburban areas, etc. Then, the address of each participant could be located into DID or non-DID areas.
2.4 Terminology
Following words and concepts should be clearly defined before discussing the methods and results of this research.
-
Older driver: driver who is 60 years old or older.
-
Trip: automotive trip (abbreviation: trip) which does not consist of bus, walk, or any other transportation mode.
-
Commute trip: trip from home to office/school. Discretionary trip: otherwise.
-
Peak periods (rush time): 7:00–10:00 and 15:00–20:00 on weekdays (Fig. 1).
Fig. 1 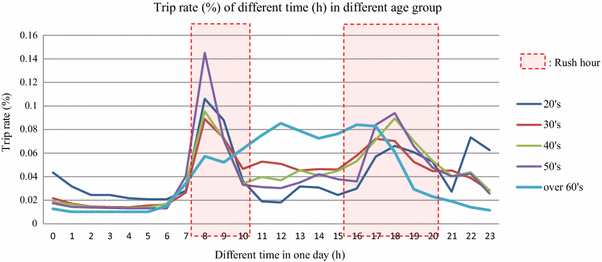
Sample distribution on time of day of trip
Off-peak periods: otherwise.
-
HB trip: a trip which has at least one end of the trip at the home of the trip maker.
NHB trip: otherwise.

3 Methods
3.1 Trip frequency and length
Participants are classified by DID-living or non-DID-living, which is hypothesized to affect trip frequency and length. The data of some frequently driving participants may have an excessively high influence on the results. To avoid this condition, after each driver’s trips per day are calculated, trip frequencies are further averaged by living area and age groups, respectively. About trips length, similar data process is operated. For the comparative analysis between older driver and others both in DID and non-DID, t test is used to evaluate whether there is significant difference among two age groups.
Since commute trips usually comprise a certain route in constant time, discretionary trips in off-peak periods are calculated (the same in the analysis of destination distribution and NHB rate) in this research. Each driver’s home can be located by comparing their address information and the PV data of the first most frequently visited destination. For driver who is working or is a student, the second most frequently visited destination (only lower than home) on weekdays is considered as his/her commute destination.
3.2 Destination distribution
Different from trip length, the analysis of destination distribution is expected to help understand older drivers’ driving range around home. Participants are also classified by age groups and living areas. Regardless of the origin, the distance from home to destination can be measured by GPS records. Considering that most trips might be distributed in a region not far away from home, this study further investigates the destination distribution in a radius of 5 km away from home.
3.3 NHB trips
By comparing the locations of trip’s end points (origin and destination) and driver’s home, each trip can be broadly classified as HB trips and NHB trips. Because the two age groups are mutually interdependent and have different sample sizes, Z-test is used to analyze the statistical significance between older drivers and others.
Regression model is used to identify the impact factors on all trip characteristics of this study. Because each GPS data point could be considered as a single sample case, and multiple samples with unequal sizes were collected from each person, a random effects regression model is constructed to consider unobserved heterogeneity among drivers [26, 27]. The model consists of 1 constant term (β 0) and 11 binary independent variables (X 1, X 2,…, X 11): one is gender, five are age, the other five are working/at school, living area, weekday, rush time, and commute trip. It should be noted that because the trip frequency is classified by person and day rather than trip or hour, it is described by Poisson’s regression model which is usually used for multilayer data. Meanwhile, for the same reason, the factors of rush time and commute trip are not included in the regression model of trip frequency. Furthermore, the interaction terms between the variable “Age (60 or older)” and the latter five factors are also added into the model. Through significance test, each variable’s effect on trip characteristics will be examined. Considering that there may exist an association between the interaction variables, the association is measured by a Pearson correlation coefficient (also referred to as “phi coefficient” for two binary variables) [28]. If two variables interact, they may or may not be associated. However, if two interaction variables are associated (correlation between them is high), one variable should be eliminated from the regression model because the interaction effect is deduced to be caused by the association. Furthermore, elasticity information reflects the responsiveness of dependent variable to an independent variable change, and it depends on where the calculation starts [29]. If the elasticity is less than 1, we can claim that the dependent variable is inelastic, and vice versa. Thus, the elasticity at each age group is calculated to confirm the responsiveness of dependent variables to age.
4 Results
4.1 Trip frequency and length
The average daily trip frequency and average trip length are shown in Tables 2 and 3, respectively. Sample size means the amount of trips (the same in destination distribution and NHB rate). It reflected that in DID area, both indicators of older drivers are almost the same as those of other participants. In contrast, the older drivers in non-DID area drive significantly less and shorter than participants who are younger than 60.
Considering the traffic environment in urban area, such as intersection of multiple directions, complex road network, a large number of pedestrians and nearly unpredictable traffic congestion, driving is often not a recommended transportation mode not only for older drivers but also for younger drivers [30]. On the other hand, urban areas usually provide more travel options which include bus, metro, taxi, and car-sharing. One possible reason why DID-living older drivers do not drive less or shorter than others is that the former have more free time to avoid rush hours. The relatively smooth traffic flow in off-peak period may increase their driving intention. Meanwhile, unlike moving from other region, aging is a gradual process which could not lead older adults to abandon their habit of driving immediately. As noted in the section of introduction, some physiological changes with aging are more easily to cause traffic accident. For the older drivers who are living in the DID area, the promotion of public transportation mode and the training of safety driving are therefore needed.
In some previous survey-based studies [31–33], most of rural-living older drivers claimed that giving up driving, so-called driving cessation, meant isolation for them. However, the data in this research show that older drivers living far from urban areas tend to reduce travel by driving. It can be inferred that older driver tends to buy a larger quantity of goods while shopping and hence drives less than others. Another possible reason is that the reduction of tour, entertainment, and socializing with aging may directly cut down both trip frequency and length. Meanwhile, in the long journey, middle-age people in family may be required to drive, and older adults are pleased to be passengers.
4.2 Destination distribution
Unlike trip length, destination distribution reveals the travel range around drivers’ home. Regardless of origins, all trips can be imaged as distributed in concentric circles. As trip frequency and length, Table 4 shows that there is no significant difference between two age groups in DID area. Meanwhile, non-DID-living older drivers’ travel range is smaller than others.
As noted in Sect. 4.1, more training and education should be given to DID-living older drivers for the prevention of accidents. On the other hand, since most of older drivers who are living in non-DID area inclined to drive near home, it should be further investigated and explained with the result of NHB trips in the next section.
4.3 NHB trips
NHB trips reflect the process of trips generation. Because driver, usually as trip planner, attempts to quantify the relationship between multiple activities and travel, a relatively high NHB rate means efficient travel plan. As shown in Table 5, the NHB rates of both age groups in DID area remains within the range between 25 % and 30 %, which is consistent with Schultz’s model [11]. However, in the non-DID area, the NHB rate of older drivers is significant lower than that of others. Moreover, older drivers’ NHB rate does not corroborate Gonzalez-Ayala’s conclusion [12] that NHB rate in urban areas was lower than that in rural areas. It should be noted that “z Stat” in Table 5 is the result of Z-test.
With the smaller driving range from home (Sect. 4.2), it can be inferred that older adults in non-DID do not prefer continuous driving to different positions far away from home. It reveals some older drivers’ life style: driving for single purpose around home, such as farming, social events, shopping in convenient store, etc; relying on other drivers or other transportation modes while going to a further destination.
4.4 Regression analysis
The result of regression analysis is shown in Table 6. If one older driver-related independent variable significantly affects the research object, the number will be in bold.
Trip frequency, length, and NHB trip, except for the destination distribution, are influenced significantly by older driver (X 6) even considering the interaction effect. As analyzed in the previous section, the interaction between older driver and living area is a significant influence factor on each travel behavior. Moreover, about the trip frequency, older driver also has a positive interaction effect (X 14) with the impact factor of weekday/weekend, which implies that older adults driving on weekday can increase the trip frequency. It accords with some reports [34, 35] and may be caused by their expectation of avoiding the traffic congestion during the weekends. As mentioned in Sect. 3, correlation between interaction variables is measured by Pearson correlation test. The correlation coefficients are −0.4922 (X 6 and X 7), −0.1751 (X 6 and X 8), 0.0566 (X 6 and X 9), −0.0186 (X 6 and X 10), and −0.0244 (X 6 and X 11), respectively. And all of them are nonsignificant at the 0.05 level. Thus, we can conclude that the interaction effects are not caused by the correlation between independent variables. The regression analysis also demonstrates that living area (X 8) plays an important role in the trip characteristics, which confirms that it is necessary to divide the participants of this research into DID-living and non-DID-living groups. Furthermore, the elasticity information is also computed and indicated by superscript “IE (inelastic)” or “E (elastic).” It shows that the responsiveness of each dependent variable to “Age (60 or older)” has high elasticity, which means that the change of the former is strongly influenced by the latter.
5 Conclusions
Through a two-month experiment of 108 participants in Aichi Prefecture, Japan, the present study primarily focused on older driver’s automotive trip characteristics which included trip frequency, trip length, destination distribution, and NHB trips. To confirm whether living areas (DID and non-DID) were relevant for older drivers’ trip characteristics, participants of this study were divided not only into age groups but also into living area groups.
At first, this study found that there was no significant difference between the trip characteristics of older drivers and others who were living in DID. Many reports have warned that some physiological and psychological changes with aging are easily to cause driving mistakes. The other unavoidable fact is that the complex traffic environment in urban area is one important reason for traffic accidents. Thus, we suggest that the education of safety driving should be given to DID-living older drivers. On the other hand, more convenient public transportation modes in DID, such as bus, metro, and taxi, should be further promoted for older adults.
Unlike the results in DID, trip characteristics had great difference between two age groups in non-DID. The results showed that older drivers’ trip frequency, trip length, destination, and NHB trips rate were shorter or lower than others. The first three indicators reflected that older drivers living in non-DID tended to drive less and travel in a relatively small range, while NHB trips demonstrated that most non-DID-living older drivers had a tendency to travel for fewer purposes. It should be noted that some previous studies claimed that the NHB rate of rural-living drivers was higher than that of urban-living drivers because the former lived further away from their desired destinations. However, in this study, this phenomenon was verified to exist only in the participants who were younger than 60. It reflected that aging might have greater effect on non-DID-living older drivers than living area. All these characteristics suggested that EVs might be suitable for promotion among older drivers in rural area, because EVs’ weaknesses of charging space/time and endurance ability are relatively easily to be accepted, while their advantages of cleaner and greener could be developed.
Furthermore, to identify the impact factors on all trip characteristics of this study, regression analysis was conducted. The results showed that “older drivers” was a significant independent factor on trip frequency, trip length, and NHB trips. Moreover, it had interaction effects with “living areas” on all trip characteristics during this study. It also confirmed the necessity of grouping not only by age but also by living area in this study.
However, the main limitations of this study were its small sample size (number of older drivers = 10) and limited geographic coverage (Aichi Prefecture, Japan). Therefore, caution should be exercised while extrapolating the results to general population. On the other hand, some hypotheses about the reasons of the phenomenon in this study may not be solid because they were assumed only based on PV data but lacking questionnaire survey. For instance, we can deduce that older drivers are living a retired life in rural areas, and therefore the need to travel is less, but in urban areas this age group can still be active. Thus, further survey-based research is needed to find out participant’s attitude to driving.
Future research will seek to analyze older drivers’ bio-information which could not be estimated by PV data. Biological data-collection device will be used in the experiment, and the data are expected to respect the correspondence between older drivers’ psychological characteristics and their travel behaviors. A larger group of elderly individuals is planned to be recruited in the further experiment. Similarly, more participants from other age groups will be tracked for the comparison of the results.
References
Population Division, United Nations (2015) World population prospects: 2015 revision. http://esa.un.org/unpd/wpp/. Accessed 15 Dec 2015
License Division, Traffic Bureau, National Police Agency, Japan (2014) Driving license statistic ver. 2014. https://www.npa.go.jp/toukei/menkyo/index.htm. Accessed 15 Dec 2015
MacLeod KE, Satariano WA, Ragland DR (2014) The impact of health problems on driving status among older adults. J Transp Health 1(2):86–94
Delhomme P, Cristea M, Paran F (2013) Self-reported frequency and perceived difficulty of adopting eco-friendly driving behavior according to gender, age, and environmental concern. Transp Res Part D 20:55–58
Ross LA, Dodson JE, Edwards JD et al (2012) Self-rated driving and driving safety in older adults. Accid Anal Prev 48:523–527
Tahara Y, Iwadare M (1999) Where the elderly move to: a review and a study of elderly migration flows in Japan. Komaba Stud Hum Geogr 13:1–53
Benekohal RF, Michaels RM, Shim E et al (1994) Effects of aging on older drivers’ travel characteristics. Transp Res Rec 1438(HS-042 017):91–98
Rothe JP (1990) The safety of elderly drivers: yesterday’s young in today’s traffic. Transaction Publishers, New Brunswick, p 120
Verma A, Ramanayya TV (2014) Public transport planning and management in developing countries. CRC Press, Boca Raton, pp 116–117
Victor DJ, Ponnuswamy S (2012) Urban transportation: planning, operation and management. Tata McGraw-Hill Education, Noida, p 23
Schultz G, Allen W (1996) Improved modeling of non-home-based trips. Transp Res Rec 1556:22–26
Gonzalez-Ayala S (1999) Estudio Integral de Transporte (III)/multimodal transportation study: development of travel demand and mobile source emissions models for base year 1996, Juarez. https://www3.epa.gov/ttn/catc/dir1/emis-06.pdf. Accessed 20 Oct 2015
Hildebrand E, Gordon M, Hanson T (2004) Understanding the travel behaviour of the rural elderly. In: Proceedings of the 39th annual conference of the Canadian transportation research forum: revolutions in transportation, Calgary, Canada, pp 1183–2770
McDonald JD (2008) Measuring personality constructs: the advantages and disadvantages of self-reports, informant reports and behavioural assessments. Enquire 1(1):1–18
Hanson T, Hildebrand E (2011) Revealed choice of a new generation: travel behavior of older drivers in rural New Brunswick, Canada. In: Transportation research board 90th annual meeting, Washington, DC
Hanson T, Hildebrand E (2011) Experiences with GPS travel diaries in rural older driver research. In: Transportation research board 90th annual meeting, Washington, DC
Harrison A, Ragland D (2003) Consequences of driving reduction or cessation for older adults. Transp Res Rec 1843:96–104
Mollenkopf H, Marcellini F, Ruoppila I et al (2005) Enhancing mobility in later life: personal coping, environmental resources and technical support; the out-of-home mobility of older adults in urban and rural regions of five European countries. IOS Press, Amsterdam
Kempton W, Letendre SE (1997) Electric vehicles as a new power source for electric utilities. Transp Res Part D 2(3):157–175
Ministry of Land, Infrastructure and Transport Japan (2011) A brief report of the 5th investigation on person trip in Chūkyō Metropolitan Area. http://www.cbr.mlit.go.jp/kikaku/chukyo-pt/persontrip/pdf/gaiyou05_02.pdf. Accessed 15 Oct 2015
Japan Automobile Manufacturers Association Inc (2011) Survey on automobile market trend, 2011. http://www.jama.or.jp/lib/invest_analysis/four-wheeled.html. Accessed 15 Oct 2015
Ogawa K (2003) An analysis of household car ownership in a local city and its suburban area. In: Research meeting on civil engineering planning, Japan, 2003. https://www.jsce.or.jp/library/open/proc/maglist2/00039/200311_no28/pdf/268.pdf. Accessed 15 Oct 2015
Home Page of Toyota City Government (2015) http://www.city.toyota.aichi.jp/shisei/tokei/1008302.html. Accessed 15 Oct 2015
License Division, Traffic Bureau, National Police Agency, Japan (2014) Driving license statistic ver. 2014. https://www.npa.go.jp/toukei/menkyo/index.htm. Accessed 15 Oct 2015
Statistics Bureau Japan (2015) What is a densely inhabited district? http://www.stat.go.jp/english/data/chiri/did/1-1.htm. Accessed 1 July 2015
Wooldridge JM (2005) Simple solutions to the initial conditions problem in dynamic, nonlinear panel data models with unobserved heterogeneity. J Appl Econom 20(1):39–54
Jaccard J (2003) Interaction effects in multiple regression, 2nd edn. Sage, California, pp 16–43
Warrens MJ (2008) Similarity coefficients for binary data. Proefschriftmaken.nl, Oisterwijk 2008
Gary S (2004) Simple linear regression. New York University, Stern School of Business. http://pages.stern.nyu.edu/~wgreene/Statistics/SimpleLinearRegressionCollection.pdf. Accessed 15 Jul 2015
Japan National Tourism Organization (2015) Driving a car. http://www.seejapan.co.uk/jnto_consumer/plan-your-trip/transportation/driving-a-car.aspx. Accessed 15 Oct 2015
Hassan H, King M, Watt K (2015) The perspectives of older drivers on the impact of feedback on their driving behaviours: a qualitative study. Transp Res Part F 28:25–39
Johnson JE (1998) Older rural adults and the decision to stop driving: the influence of family and friends. J Community Health Nurs 15(4):205–216
Adler G, Rottunda S (2006) Older adults’ perspectives on driving cessation. J Aging Stud 20(3):227–235
Maryland Department of Transportation, USA (2015) Older driver safety in Maryland. http://www.mva.maryland.gov/safety/_docs/FY15_Older_ProgramAreaBriefCombinedFinal1.pdf. Accessed 15 Oct 2015
National Institute on Aging, USA (2015) How aging affects driving. http://nihseniorhealth.gov/olderdrivers/howagingaffectsdriving/01.html. Accessed 15 Oct 2015
Acknowledgments
This research is partially supported by the Center of Innovation Program from Japan Science and Technology Agency, JST.
Author information
Authors and Affiliations
Corresponding author
Rights and permissions
Open Access This article is distributed under the terms of the Creative Commons Attribution 4.0 International License (http://creativecommons.org/licenses/by/4.0/), which permits unrestricted use, distribution, and reproduction in any medium, provided you give appropriate credit to the original author(s) and the source, provide a link to the Creative Commons license, and indicate if changes were made.
About this article

Cite this article
Zhao, Y., Yamamoto, T. & Morikawa, T. A comparative study of automotive trip characteristics between older drivers and others among densely inhabited district and other areas. J. Mod. Transport. 24, 177–186 (2016). https://doi.org/10.1007/s40534-016-0109-3
Received:
Revised:
Accepted:
Published:
Issue Date:
DOI: https://doi.org/10.1007/s40534-016-0109-3