
Abstract
Purpose
Tuberculosis (TB) is an infectious disease with a high global incidence and substantial disease burden. Monitoring disease activity and evaluating treatment response with conventional methods such as culture or chest x-ray is time-consuming and non-specific. Active TB lesions are typically highly FDG-avid and may be assessed on whole-body 18-fluorine-fluorodeoxyglucose positron emission tomography/computed tomography (FDG PET/CT). We hypothesized that FDG-PET or FDG-PET/CT is useful for evaluation of treatment response and outcome in TB-infected patients undergoing anti-tuberculosis therapy (ATT).
Methods
PubMed and Embase databases were searched and original studies with humans infected with Mycobacterium tuberculosis receiving ATT and a minimum of one FDGPET/CT or FDG-PET scan were included. Percentage change in maximum standardized uptake value (SUVmax) from baseline was assessed with a fixed-effects model using the inverse variance method supplemented by a Forest Plot. Publication bias and heterogeneity between studies was assessed with a Funnel plot and the I squared statistic, respectively.
Results
A total of 2048 articles were identified and nine were included in the review. Four studies were included in the meta-analysis. The estimated overall percentage change in SUVmax was − 54.38% (95% confidence interval − 57.81 to − 50.96) and the heterogeneity between studies was high (I 2 = 90.1%). Study design, protocol, sample size and ATT varied between studies.
Conclusion
Despite high heterogeneity there was a trend towards the usefulness of FDG-PET or FDG-PET/CT for evaluation of ATT response. Impending research is needed to further clarify the predictive value of FDG-PET/CT in tuberculous disease.
Introduction
Tuberculosis (TB) is an infectious disease caused by the acid fast bacillus Mycobacterium tuberculosis (M. tuberculosis) [1]. Though global incidence is declining TB remains a pandemic. With 10.4 million new cases in 2015 and an estimated 2–3 billion infected people of which 10–15% are likely to develop clinical TB, the disease burden is still substantial and caused 1.79 million deaths in 2015. TB counts amongst the top ten causes of deaths worldwide [1]. The advances in combating global TB are being compromised by the rise in multidrug-resistant TB (MDR-TB), extensively drug-resistant TB (XDR-TB), socioeconomic difficulties, and high prevalence of human immunodeficiency virus (HIV) in the endemic areas [1,2,3]. Extra-pulmonary TB (EPTB) is developing readily in patients with concurrent immunosuppression; it is seen in over 50% of patient with concurrent HIV infection [4]. Distribution of disease, treatment, and outcome are strongly correlated with poverty and most deaths are medically preventable [5]. Immigration and traveling are continuously introducing M. tuberculosis into the developed world and sustaining western prevalence [6,7,8].
TB spreads via respiratory droplets, and subsequently infects the lower airways and complementary lymphatic system [9]. The lungs are most susceptible, but TB infections may spread throughout the body, by either lymphatic or hematogenous dissemination [10,11,12]. This way TB may cause a broad spectrum of symptoms from vague constitutional symptoms to specific symptoms from focal organ-related disease. Host immune responses drive several of the pathophysiologic processes seen in TB. This is illustrated histologically by the presence of caseous necrosis, cells of Langerhans, and epithelioid histiocytes [13, 14]. The clinical course varies greatly and classification of tuberculous disease is extensive, relying on ethological and clinical parameters [15]. The clinical patterns concerning TB infections are diverse and will not be discussed further.
Diagnostics and treatment response evaluation of TB rely on indirect serological and immunological observation, alongside radiological assessment of abnormal tissue morphology, and direct light microscopy [16, 17], and it is as important as it is difficult [18,19,20,21]. A variety of factors influence the diagnostic approach, e.g. the broad spectrum of tuberculous disease and the limitations of current laboratory methods [22, 23]; a common denominator for problems relating to laboratory diagnostics and evaluation is the isolation of the bacteria itself [22]. Thus, the conventional chest x-ray (CXR) is currently the cornerstone in screening, diagnosis, and evaluation of TB, although there are normal findings in 15% of the diseased population, and even higher in concurrent immunosuppressed individuals [16]. CXR has further limitations, i.e. the limited topographical area and the potential lag time between disease activity and alterations in tissue morphology [15]. More advanced imaging modalities like computed tomography (CT) and magnetic resonance imaging are also used in TB diagnostics, especially for specific organ assessment in pulmonary TB as well as EPTB [15]. Thus, evaluation of TB is usually based on presence of acid-fast bacilli in sputum and radiological findings. However, only 20–55% of patients with active pulmonary TB have sputum containing acid-fast bacilli and radiographic changes are not always characteristic enough to form the basis of definitive diagnoses [21]. EPTB is especially difficult to diagnose and evaluate [24, 25]. Evaluating treatment response is especially challenging in immunocompromised patient. With morphologic imaging, this is due to relative tardiness or complete absence of usual imaging features. The various serological assays may be unable to differentiate active infection from latent disease, and reduced host response in immunocompromised patients as well as subsets of resistant strains may influence results [15, 26]. Recent studies have suggested that combined positron emission tomography/CT with 18-fluorine-fluorodeoxyglucose (FDG-PET/CT) might predict response to anti-tuberculous treatment (ATT) early [23, 27]. The extensive treatment regimen for TB comprises a combination of anti-tuberculous drugs and antibiotics over several months and is costly and inconvenient. Detecting early response could limit the time spent on futile medication when treating non-responders, and subsequently facilitate more rapid alterations of the treatment strategies, including swift and effective targeting of drug-resistant TB by early recognition of treatment failure to benefit both patients and health care facilitators.
The progressing drug resistance amongst strains of M. tuberculosis (MDR-TB and XDR-TB) calls for vigilance in clinical practice as infections by resistant strains tend to persist after completion of conventional ATT [1, 28]. Response evaluation is, therefore, of special importance in cases with highly suspected or proven drug resistance. The use of FDG-PET/CT has shown the ability to assess lesion activity in both MDR-TB and XDR-TB [22, 29]. Confirming MDR-TB by conventional laboratory methods may take from 6 to 16 weeks but still be unsuccessful in 30% of cases. In clinical settings with acute TB such lag time is not acceptable and may prove fatal [22]. FDG-PET/CT may provide more prompt assessment of lesions metabolic activity and subsequent changes over time.
The aim of this study was to evaluate the value of FDG-PET or FDG-PET/CT for treatment response and clinical outcome in TB infected patients.
Materials and methods
Preferred Reporting Items for Systematic reviews and Meta-Analysis (PRISMA) statement [30] were applied for this article. A review protocol was not elaborated and ethical review was deemed unnecessary.
Data source
The population, intervention, comparison, outcome (PICO) framework [31] of this study was to determine if FDG-PET or FDG-PET/CT can be used to evaluate treatment response in humans infected with TB. We performed a comprehensive search in Medline/PubMed and Embase databases for relevant articles using both subject headings and text words. The search was conducted on 7 March 2017. Keywords included “PET-CT”, “FDG” and “tuberculosis” along with their derivatives. The search was limited to human studies and English language papers. A full search strategy is provided in Online Resource 1. The results were collected, merged, and filtered using the computer software EndNote X8 (Clarivate Analytics, Philadelphia, PA).
Study selection
The selection of articles was conducted by two authors (HS, TS) individually using Covidence online software [32]. Inclusion criteria were original studies with humans infected with M. tuberculosis undergoing ATT with a minimum sample size of 10 patients. All subjects had to receive a minimum of one FDG-PET/CT or FDG-PET scan, and follow-up had to be evaluated using clinical outcome. Reviews, case reports, poster presentations, conference abstracts and other contributions not being original, peer-reviewed papers were excluded. The primary selection was based on article title and abstract. Full texts of the remaining articles were then appraised. Remaining articles were reviewed in detail by the authors and included in this review. Eligible studies were included in a meta-analysis if at least one post-baseline FDG-PET/CT or FDG-PET scan was also performed. Any discrepancies between reviewers were resolved by consensus and a third investigator (SH) when needed.
Obtaining supplementary data efforts and quality assessments
If data were missing, insufficient or equivocal, efforts were made to contact the corresponding author. The quality and risk of bias for each article were assessed using the QUADAS-2 tool [33].
Statistical analysis
Percentage change in maximum standardized uptake value (SUVmax) from baseline was meta-analyzed with a fixed-effects model using the inverse variance method, supplemented by a Forest Plot [34] in order to graphically display the point estimate and a respective 95% confidence intervals (CI) on a per-study basis as well as summarized across studies. The heterogeneity of the studies was assessed with the I-squared statistic [35], and publication bias was assessed visually with a Funnel plot [36, 37]. All analyses were done with STATA/MP 14.2 (StataCorp, College Station, Texas 77845 USA); for the meta-analysis, the metan package was applied.
Results
Medline/PubMed generated 480 results, Embase generated 1568 results, and the primary selection resulted in exclusion of 1927 articles not relevant to the subject (Fig. 1). Full text appraisal of 121 articles resulted in exclusion of 112, and the remaining nine papers were reviewed by the authors and included in this review.

PRISMA based flow chart [20]
The nine included articles (Table 1) were published between 2009 and 2016. Five (56%) articles were prospective cohorts, two (22%) were randomized controlled trials, one (11%) was a prospective observational study, and one (11%) was a retrospective case control study. One used PET, while eight used PET/CT. A total of 332 patients were included in these studies (range 19–131). Sixty-seven patients (20%) were lost to follow-up and thus 265 patients completed ATT according to study-protocol. All articles included in this review sought to assess the ability of FDG-PET or FDG-PET/CT to evaluate treatment response in patients with TB undergoing ATT.
Four studies [18, 21, 23, 25] presented change in SUVmax from baseline and were included in our meta-analysis (Fig. 2). The number of included patients in these studies ranged from 21 to 131, and the estimated overall percentage change in SUVmax was − 54.38% (95% CI − 57.81 to − 50.96). All patients in these studies were HIV negative and with few exceptions [25] without any concomitant malignancy. The article by Demura et al. [21] included patients infected with either M. tuberculosis or M. avium (MAC); therefore, a subgroup analysis was performed to only include patients infected with M. tuberculosis. In the study by Malherbe et al. [23], two patient cohorts were followed, one from South Korea (N = 14), and one from South Africa (N = 99). These groups were analyzed separately and indicated by “Malherbe 2016a-b”,respectively.

Forest plot on ∆SUVmax. CI confidence interval, ES estimate
The two articles by Sathekge et al. [22, 24] exclusively involved HIV positive patients and, by study design, patients underwent only one FDG-PET/CT. SUVmax and number of involved lymph nodes (LN) were compared with treatment outcome to investigate sensitivity and specificity of various cut-off values. Not including these studies in our meta-analysis was due to concomitant HIV infection, binary (responder/non-responder) classification of ATT response, and the presentation of only a single FDG-PET/CT scan.
The remaining three studies [27, 29, 38] presented only qualitative/nominative results. The sample size was between 19 and 35 patients. They were heterogeneous in design, type of TB, and comorbidities. The data presented were quantitatively insufficient and incompatible with the meta-analysis. The findings were illustrated using a variety of nominative scales categorizing ATT response. Corresponding authors of these articles were contacted and quantitative numerical data (SUVmax) were requested, however unsuccessful. The study by Coleman et al. [29] had macaques as primary subjects and humans were included from a parallel study; a subgroup analysis was, therefore, performed.
Assessing quality and risk of bias
Individual assessment of the included articles was performed using the QUADAS-2 tool (Fig. 4 and Online Resource 2). Assessment of each QUADAS-2 domain for individual articles and possible sources of bias is available as Online Resource 2. The Funnel plot (Fig. 3) illustrating meta-analyzed studies was asymmetrical. Three of the five study populations were outside the pseudo 95% confidence limit which indicates possible heterogeneity and publication bias. The PRISMA checklist is provided in Online Resource 3.

Funnel plot of the studies included in meta-analysis
Discussion
General statements of principal findings
The goal of this study was to evaluate treatment response and clinical outcome in TB-infected patients using FDG-PET or FDG-PET/CT. The literature search strategy and selection process resulted in nine articles.
The four studies included in the meta-analysis compared changes in SUVmax between baseline scans and follow-up scans. The results showed a pooled change in SUVmax of − 54.38% (95% CI − 57.81, − 50.96). This may indicate that FDG-PET or FDG-PET/CT could be useful for evaluation of disease activity and monitoring of treatment response in patients with various forms of TB. Three of the four studies included in the meta-analysis demonstrated clinical correlation between patient outcome and changes in SUVmax. The three studies by Chen et al. [38], Coleman et al. [29], and Stelzmueller et al. [27] all concluded that FDG-PET/CT was potentially beneficial when assessing ATT response, but only Chen et al. applied a consistent clinical outcome reference standard. The two articles by Sathekge et al. [22, 24] concluded that FDG-PET/CT may separate responders from non-responders by correlating SUV-data with sputum cultures, clinical course, and radiological assessment, but neither presented data on semi-quantitative changes to corroborate these conclusions.
Details on included studies
Malherbe et al. [23] followed two cohorts which showed overall decrease in SUVmax of − 52.04 (95% CI − 56.73, − 47.36) (2016a), and − 29.04 (95% CI − 52.21, − 5.88) (2016b), see also Fig. 2. The FDG-PET/CT results were compared with a sputum culture reference standard at month 6 and a correlation between lesion activity and detection of M. tuberculosis in sputum cultures was found. Also, overall clinical outcomes were correlated with FDG-PET/CT-findings: so-called mixed imaging responses (novel FDG-avid lesions or foci with increased intensity in follow-up scans) were more likely to have an unfavorable outcome, i.e. 12/20 (60%) patients with treatment failure or recurrent disease demonstrated this pattern compared to 21/76 (28%) cured patients. Similarly, 12/76 (16%) cured patients demonstrated a so-called resolved pattern (normalized FDG in all lesions on follow-up scans) compared to only 1/12 (8%) patients with recurrent disease, and none of the patients where treatment failed. The strength of the study lies in the large cohort size, but it is weakened by the lack of a standardized treatment protocol. In the study by Dureja et al. [18] changes in SUVmax between sequential scans were assessed along with visual analogue scale (VAS) score, erythrocyte sedimentation rate (ESR), Eastern Cooperative Oncology Group (ECOG) score [39], and reports of subjective improvement in patients with uncomplicated spinal TB. Results showed a pooled change in SUVmax of − 56.13 (95% CI − 62.21, − 50.05) which correlated with the clinical improvement on VAS score, but not the ESR, at 6, 12, and 18 months. The study concluded that SUVmax can be used as a quantitative biomarker for metabolic activity in spinal tuberculosis and that radiological findings correlated well with the clinical outcome. A weakness is the large attrition of patients during follow-up (N = 15). Martinez et al. [25] performed FDG-PET/CT scans at baseline and 1 month after ATT initiation and showed a pooled response in SUVmax of − 34.38 (95% CI − 48.71, − 20.05). No consistent reference standard was used during follow-up. The study concluded that change in SUVmax was a marker of chemotherapeutic effect, especially in patients with EPTB; 18/20 patients were considered cured clinically/serologically, and all displayed some decrease of SUVmax, whereas the remaining two patients with increased SUVmax later had their diagnoses revised to lymphoma and MDR-TB, respectively. The strength of this article was the homogeneity of the study population and scan protocol. The TB-infected patients in the study by Demura et al. [21] showed a pooled decrease in SUVmax of − 89.13 (95% CI − 100.00, − 73.90). The patients underwent both FDG-PET and high-resolution CT (HRCT) scan and changes were clinically evaluated. No other reference method was defined. The conclusion of the study was that FDG-PET/CT could be useful for diagnosis and monitoring of treatment response in patients with pulmonary TB. The strength of the articles was the homogeneity of the study population, treatment and scan protocol, but it was limited by the small study population due to the large attrition and the lack of clinical correlation.
Three studies [27, 29, 38] compared changes between two FDG-PET/CT scans using a variety of nominative scales. In the article by Chen et al. [38], 28 MDR-TB infected patients completed treatment and were classified as either treatment success (N = 24) or failure (N = 4) using sputum culture conversion as reference standard. FDG-PET/CT was the best method for early prediction of treatment results and long-term outcome, i.e. at 2 months FDG-PET/CT demonstrated 96% sensitivity for predicting treatment success, and 79% specificity for predicting treatment failure. Similar results were accomplished by CT, but not until the 6 months scan. No SUVmax values for individual patients were presented in the article. In the study by Coleman et al. [29], 19 patients infected with XDR-TB and treated with linezolid monotherapy were randomly assigned four different groups with different intervals between scans. Apart from scans at baseline and month 6, additional scans were performed 2 months prior to ATT initiation (N = 5) and after initiation of ATT at month 1 (N = 4) two (N = 4), and three (N = 5). One subject was excluded after baseline scan. SUVmax results were only graphically represented. The reference standard was sputum culture. Of the 19 subjects included in the study, all except two showed a consistent decrease in inflammatory activity. The study concluded that FDG-PET/CT imaging might be used to quantitatively measure early drug efficacy against TB in humans. Stelzmueller et al. [27] examined changes in lesion activity in 35 patients of which 13 had comorbidities. The scan protocol was not standardized and subjects received 2–6 scans. Outcome was defined by changes in lesion activity and categorized into groups accordingly with no definitive reference standard. Results were presented as remission of disease (N = 15), residual disease (N = 16), or progression of disease (N = 4). The study stated that FDG-PET/CT could be useful to evaluate response to therapy and help define duration of treatment, but urged the need for further studies to investigate this. The comorbidities could have confounded the results, whereas the retrospective study design and heterogeneity in the timing of scans could have introduced bias.
Sathekge et al. published two articles [22, 24] wherein they assessed SUVmax and number of involved lymph node (LN) bastions using FDG-PET/CT and CT, and they correlated findings with clinical outcome as responders (N = 28) and non-responders (N = 16). In both studies SUVmax and the number of involved (PET-positive) LN bastions were significantly higher in non-responders compared to responders. In their 2011 study, a cut-off of 5 FDG-avid LN bastions separated responders from non-responders with a sensitivity and specificity of 88 and 81%, respectively, and a negative predictive value of 93%. Other parameters like viral load and CD4 status remained non-significant. In their 2012 study, an SUVmax cut-off of 4.5 separated responders from non-responders with a sensitivity and specificity of 95 and 85%, respectively, whereas corresponding values for CT-based response evaluation were 88 and 66%, respectively. Reference standard used was sputum culture complemented by clinical assessment and radiological findings when needed. The studies concluded that FDG-PET/CT has the potential to become a valuable tool for visualizing number of involved LN bastions to separate responders from non-responders.
The nine articles are heterogeneous in design and patient selection, and, thus, not fully comparable. However, there is a consistent trend suggesting FDG-PET/CT may be used for evaluation of ATT response. A limited number of articles are published on this subject, with varying demographic populations, ethnicity, socioeconomics, and geographical origin across the studies. FDG-PET/CT might have the potential to shorten treatment time and individualize treatment protocol depending on lesion activity [21, 27]. Larger studies are needed to confirm this. When FDG-PET/CT was compared to other radiological modalities it was proven more sensitive [18, 27] with the earliest changes seen in scans taken 4 weeks after initiation of ATT [25]. Some tuberculous lesions do not shrink and can even grow during treatment regardless of efficacy. Thus, other imaging modalities that solely examine lesion morphology and not lesion metabolism might, therefore, be misleading [40]. In the early stages of disease, metabolic alterations in tissue are seen prior to macroscopic changes [15]; FDG-PET/CT has the potential to discover these early changes in lesion activity much earlier than other imaging methods [27]. A lower uptake of FDG, and subsequently lower SUVmax on follow-up scans, indicates that ATT is effective and the treatment strategy should be continued. Contrarily, unaltered or increased SUVmax suggests insufficient ATT response and advocates changes in treatment regimens [21]. FDG-PET/CT proves useful in evaluating activity and response to ATT, but a definite diagnosis based on culture and tissue is recommended [21]. An overall matter is the general applicability of SUVmax-based response evaluation which remains controversial. Potential problems could be related to FDG-injection which includes extravasation at injection site, decay between dose measurement and time of injection or residual activity in the syringe. By adhering to the EANM/EARL standards, these challenges could be overcome [41]. Patient factors, for example, body weight, tissue composition, and blood glucose level as well as technical issues such as organ or lesion movement during scanning could also affect results [42].
Comorbidities
Comorbid patients usually have a more progressive disease course and higher mortality [43, 44]. The risk of developing TB is much higher in HIV-infected individuals [1]. HIV co-infection impairs the ability of the immune systems to contain the TB infection and accelerates the clinical course of HIV [22]. Early detection of treatment failure is, therefore, especially important in this patient group. Our findings suggest that ATT evaluation by FDG-PET/CT shows similar response patterns (Fig. 2) regardless of site of TB and comorbidities, which may indicate that FDG-PET/CT could be used for assessment of different forms of tuberculous disease which was previously dependent on separate diagnostic approaches.
Strengths and weaknesses of the study
The strength of this review lies in the extensive literature search strings and article selection. The search terms were very broad and article selection was performed by two separate authors, which increased the likelihood of including all relevant papers. Corresponding authors of studies with lacking relevant data [27, 29, 38] were contacted. To maximize transparency, the PRISMA statement structure was applied and the included articles were assessed using the QUADAS-2 tool to identify possible sources of bias. Potential weaknesses of this study are the following:
-
i.
The considerable heterogeneity in the meta-analyzed studies (I 2 = 90.1%).
-
ii.
The potential risk of bias in included articles (Fig. 4 and Online Resource 2).
Fig. 4 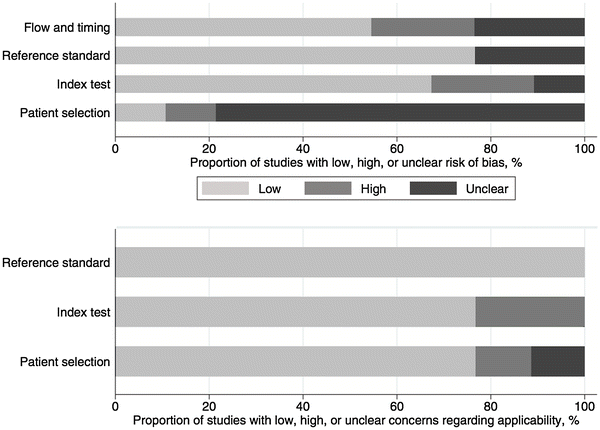
Graphical display of QUADAS-2 results [33]
-
iii.
The lack of a gold standard as well as inter-study inconsistency regarding diagnostic strategy and consensus regarding clinical outcome and definition of treatment response.
-
iv.
The assumed confounding roles of varying geographical and socioeconomic factors.
-
v.
The utilizing of only Medline/Pubmed and Embase databases; some gray literature may have been missed.
-
vi.
The significant variations in ATT protocols and manifestation of TB [pulmonary (N = 4), EPTB (N = 1), and both or unspecified (N = 6)] across studies. Furthermore, the FDG-PET/CT scans were performed within substantially variable timelines and intervals (Table 1). This may confound results in the given study and further render results less applicable to other TB in general.

Conclusion, unanswered questions and future research
The included articles indicate that FDG-PET or FDG-PET/CT is capable of evaluating tuberculous lesion activity, with special clinical significance in early ATT response evaluation. Further research is needed to clarify more precisely the clinical value of FDG-PET/CT in predicting the course of tuberculous disease and its potential for individual assessment of ATT response. This might facilitate a more optimized or personalized treatment regimen based on (semi)quantitative analysis, comorbidity, location, and dissemination of disease.
The included articles all identify FDG-PET/CT as a potential surrogate marker for ATT response with decreasing SUVmax indicating favorable clinical outcome. However, the precise predictive value, sensitivity, and specificity remain uncertain. Also, the most optimal time interval between baseline scan and response evaluation scan remains unclear and should be evaluated further. Finally, several variables may influence the results, so the establishment and evaluation of more standardized approaches is imperative.
Another matter to be addressed is the potential of novel quantification methods that may overcome the inherent weaknesses of SUV-based quantification. Clinically, a simple numerical cut-off value would be of practical importance for the clinicians to differentiate responders and non-responders and evaluate treatment response. However, establishing such dichotomous cut-offs of SUV-based measurements is probably not valid; we have previously addressed both the challenges in using SUV-based quantification, especially in response evaluation, and the potential of novel quantitative techniques. Assessment of global disease burden in essence presents the clinicians with a single number expressing the degree of disease activity either globally (systemic), or within a single organ while at the same time attenuating some of the difficulties with SUV, e.g. applying comparable regions of interest in sequential scans and partial volume correction [42, 45]. This may be of interest in TB, both locally in the lungs or systemically in disseminated EPTB. This has not yet been evaluated in TB, but results on lung inflammation and mesothelioma have shown the methodology to be feasible in the lungs [46, 47].
As mentioned, one of the inherent challenges of FDG is the relative non-specificity. This may impact the assessment of malignancy suspicious lung lesions in TB endemic areas and vice versa. In theory, multiple time point imaging enhances differentiation between benign and malignant tissue due to differences in FDG metabolism between cancer cells and inflammatory ones. However, several investigators have questioned the value of this time-consuming technique, and further studies are needed for clarification [48, 49].
These unclarified issues and controversies may all be addressed in a well-designed prospective multicenter study adhering to EARL standards. Although novel tracers are in the pipeline, the potential of FDG has not yet been fully explored, so currently the work should be focused on this ubiquitous tracer before too much efforts are invested in other tracers.
Rererences
WHO (2016) Global tuberculosis report 2016. http://apps.who.int/iris/bitstream/10665/250441/1/9789241565394-eng.pdf. Accessed 1 Feb 2017
Dheda K, Barry CE, Maartens G (2016) Tuberculosis. Lancet 387(10024):1211–1226. https://doi.org/10.1016/S0140-6736(15)00151-8
Zignol M, Dean AS, Falzon D, van Gemert W, Wright A, van Deun A, Portaels F, Laszlo A, Espinal MA, Pablos-Méndez A, Bloom A, Aziz MA, Weyer K, Jaramillo E, Nunn P, Floyd K, Raviglione MC (2016) twenty years of global surveillance of antituberculosis-drug resistance. N Engl J Med 375(11):1081–1089. https://doi.org/10.1056/NEJMsr1512438
Golden MP, Vikram HR (2005) Extrapulmonary tuberculosis: an overview. Am Fam Phys 72(9):1761–1768
Vitoria M, Granich R, Gilks CF, Gunneberg C, Hosseini M, Were W, Raviglione M, De Cock KM (2009) The global fight against HIV/AIDS, tuberculosis, and malaria: current status and future perspectives. Am J Clin Pathol 131(6):844–848. https://doi.org/10.1309/ajcp5xhdb1pnaeyt
Pareek M, Greenaway C, Noori T, Munoz J, Zenner D (2016) The impact of migration on tuberculosis epidemiology and control in high-income countries: a review. BMC Med 14:48. https://doi.org/10.1186/s12916-016-0595-5
Denholm JT, Thevarajan I (2016) Tuberculosis and the traveller: evaluating and reducing risk through travel consultation. J Travel Med 23(3). https://doi.org/10.1093/jtm/taw008
Castelli F, Sulis G (2017) Migration and infectious diseases. Clin Microbiol Infect 23(5):283–289. https://doi.org/10.1016/j.cmi.2017.03.012
Nicas M, Nazaroff WW, Hubbard A (2005) Toward understanding the risk of secondary airborne infection: emission of respirable pathogens. J Occup Environ Hyg 2(3):143–154. https://doi.org/10.1080/15459620590918466
Kosterink JGW (2011) Positron emission tomography in the diagnosis and treatment management of tuberculosis. Curr Pharm Des 17(27):2875–2880
Lawn SD, Zumla AI (2011) Tuberculosis. Lancet 378(9785):57–72. https://doi.org/10.1016/s0140-6736(10)62173-3
Sharma SK, Mohan A, Sharma A, Mitra DK (2005) Miliary tuberculosis: new insights into an old disease. Lancet Infect Dis 5(7):415–430. https://doi.org/10.1016/s1473-3099(05)70163-8
Kozakiewicz L, Phuah J, Flynn J, Chan J (2013) The role of B cells and humoral immunity in Mycobacterium tuberculosis infection. Adv Exp Med Biol 783:225–250. https://doi.org/10.1007/978-1-4614-6111-1_12
Ahmed HGE, Nassar AS, Ginawi I (2011) Screening for tuberculosis and its histological pattern in patients with enlarged lymph node. Pathol Res Int 2011:417635. https://doi.org/10.4061/2011/417635
Skoura E, Zumla A, Bomanji J (2015) Imaging in tuberculosis. Int J Infect Dis 32:87–93
Burrill J, Williams CJ, Bain G, Conder G, Hine AL, Misra RR (2007) Tuberculosis: a radiologic review. Radiographics 27(5):1255–1273. https://doi.org/10.1148/rg.275065176
Pottumarthy S, Wells VC, Morris AJ (2000) A comparison of seven tests for serological diagnosis of tuberculosis. J Clin Microbiol 38(6):2227–2231
Dureja S, Sen IB, Acharya S (2014) Potential role of F18 FDG PET-CT as an imaging biomarker for the noninvasive evaluation in uncomplicated skeletal tuberculosis: a prospective clinical observational study. Eur Spine J 23(11):2449–2454. https://doi.org/10.1007/s00586-014-3483-8
Méndez-Samperio P (2017) Diagnosis of tuberculosis in HIV co-infected individuals: current status, challenges, and opportunities for the future. Scand J Immunol n/a–n/a. https://doi.org/10.1111/sji.12567
Park IN, Ryu JS, Shim TS (2008) Evaluation of therapeutic response of tuberculoma using F-18 FDG positron emission tomography. Clin Nucl Med 33(1):1–3. https://doi.org/10.1097/RLU.0b013e31815c5128
Demura Y, Tsuchida T, Uesaka D, Umeda Y, Morikawa M, Ameshima S, Ishizaki T, Fujibayashi Y, Okazawa H (2009) Usefulness of 18F-fluorodeoxyglucose positron emission tomography for diagnosing disease activity and monitoring therapeutic response in patients with pulmonary mycobacteriosis. Eur J Nucl Med Mol Imaging 36(4):632–639. https://doi.org/10.1007/s00259-008-1009-5
Sathekge M, Maes A, Kgomo M, Stoltz A, Van de Wiele C (2011) Use of 18F-FDG PET to predict response to first-line tuberculostatics in HIV-associated tuberculosis. J Nucl Med 52(6):880–885. https://doi.org/10.2967/jnumed.110.083709
Malherbe ST, Shenai S, Ronacher K, Loxton AG, Dolganov G, Kriel M, Van T, Chen RY, Warwick J, Via LE, Song T, Lee M, Schoolnik G, Tromp G, Alland D, Barry CE, Winter J, Walzl G, Lucas L, Spuy GVD, Stanley K, Theart L, Smith B, Burger N, Beltran CGG, Maasdorp E, Ellmann A, Choi H, Joh J, Dodd LE, Allwood B, Kogelenberg C, Vorster M, Griffith-Richards S (2016) Persisting positron emission tomography lesion activity and Mycobacterium tuberculosis mRNA after tuberculosis cure. Nat Med 22(10):1094–1100
Sathekge M, Maes A, D’Asseler Y, Vorster M, Gongxeka H, Van De Wiele C (2012) Tuberculous lymphadenitis: FDG PET and CT findings in responsive and nonresponsive disease. Eur J Nucl Med Mol Imaging 39(7):1184–1190. https://doi.org/10.1007/s00259-012-2115-y
Martinez V, Castilla-Lievre MA, Guillet-Caruba C, Grenier G, Fior R, Desarnaud S, Doucet-Populaire F, Boue F (2012) (18)F-FDG PET/CT in tuberculosis: an early non-invasive marker of therapeutic response. Int J Tuberc Lung Dis 16(9):1180–1185. https://doi.org/10.5588/ijtld.12.0010
Ankrah AO, van der Werf TS, de Vries EFJ, Dierckx RAJO, Sathekge MM, Glaudemans AWJM (2016) PET/CT imaging of Mycobacterium tuberculosis infection. Clin Transl Imaging 4(2):131–144
Stelzmueller I, Huber H, Wunn R, Hodolic M, Mandl M, Lamprecht B, Schinko H, Fellner F, Skanjeti A, Giammarile F, Colletti PM, Rubello D, Gabriel M (2016) 18F-FDG PET/CT in the initial assessment and for follow-up in patients with tuberculosis. Clin Nucl Med 41(4):e187–e194. https://doi.org/10.1097/rlu.0000000000001102
Plan to combat extensively drug-resistant tuberculosis: recommendations of the Federal Tuberculosis Task Force (2009) MMWR recommendations and reports: morbidity and mortality weekly report. Recommendations and reports, vol. 58, no. (Rr-3). pp 1–43
Coleman MT, Chen RY, Lee M, Lin PL, Dodd LE, Maiello P, Via LE, Kim Y, Marriner G, Dartois V, Scanga C, Janssen C, Wang J, Klein E, Cho SN, Barry CE 3rd, Flynn JL (2014) PET/CT imaging reveals a therapeutic response to oxazolidinones in macaques and humans with tuberculosis. Sci Transl Med 6(265):265ra167. https://doi.org/10.1126/scitranslmed.3009500
Moher D, Liberati A, Tetzlaff J, Altman DG (2009) Preferred reporting items for systematic reviews and meta-analyses: the PRISMA statement. BMJ 339:b2535. https://doi.org/10.1136/bmj.b2535
Schardt C, Adams MB, Owens T, Keitz S, Fontelo P (2007) Utilization of the PICO framework to improve searching PubMed for clinical questions. BMC Med Inform Decis Mak 7(1):16. https://doi.org/10.1186/1472-6947-7-16
Babineau J (2014) Product review: covidence (Systematic Review Software) 35(2):4. https://doi.org/10.5596/c14-016
Whiting PF, Rutjes AW, Westwood ME, Mallett S, Deeks JJ, Reitsma JB, Leeflang MM, Sterne JA, Bossuyt PM (2011) QUADAS-2: a revised tool for the quality assessment of diagnostic accuracy studies. Ann Intern Med 155(8):529–536. https://doi.org/10.7326/0003-4819-155-8-201110180-00009
Harris RJ, Bradburn MJ, Deeks JJ, Harbord RM, Altman DG, Sterne J (2008) Metan: fixed- and random-effects meta-analysis. Stata J 8(1):3–28
Higgins JP, Thompson SG, Deeks JJ, Altman DG (2003) Measuring inconsistency in meta-analyses. BMJ 327(7414):557–560. https://doi.org/10.1136/bmj.327.7414.557
Egger M, Smith GD, Schneider M, Minder C (1997) Bias in meta-analysis detected by a simple, graphical test. BMJ 315(7109):629–634
Sterne JAC, Harbord RM (2004) Funnel plots in meta-analysis. Stata J 4:103–117
Chen RY, Dodd LE, Lee M, Paripati P, Hammoud DA, Mountz JM, Jeon D, Zia N, Zahiri H, Coleman MT, Carroll MW, Lee JD, Jeong YJ, Herscovitch P, Lahouar S, Tartakovsky M, Rosenthal A, Somaiyya S, Lee S, Goldfeder LC, Cai Y, Via LE, Park SK, Cho SN, Barry CE 3rd (2014) PET/CT imaging correlates with treatment outcome in patients with multidrug-resistant tuberculosis. Sci Transl Med 6(265):265ra166. https://doi.org/10.1126/scitranslmed.3009501
Oken MM, Creech RH, Tormey DC, Horton J, Davis TE, McFadden ET, Carbone PP (1982) Toxicity and response criteria of the Eastern Cooperative Oncology Group. Am J Clin Oncol 5(6):649–655
Tian G, Xiao Y, Chen B, Xia J, Guan H, Deng Q (2010) FDG PET/CT for therapeutic response monitoring in multi-site non-respiratory tuberculosis. Acta Radiol 51(9):1002–1006. https://doi.org/10.3109/02841851.2010.504744
Boellaard R, Hristova I, Ettinger S, Sera T, Stroobants S, Chiti A, Bauer A, Tatsch K, Verzijlbergen F, Oyen W (2013) EARL FDG-PET/CT accreditation program: feasibility, overview and results of first 55 successfully accredited sites. J Nucl Med 54(supplement 2):2052
Hess S, Blomberg BA, Rakheja R, Friedman K, Kwee TC, Høilund-Carlsen PF, Alavi A (2014) A brief overview of novel approaches to FDG PET imaging and quantification. Clin Transl Imaging 2(3):187–198. https://doi.org/10.1007/s40336-014-0062-2
Rao VK, Iademarco EP, Fraser VJ, Kollef MH (1998) The impact of comorbidity on mortality following in-hospital diagnosis of tuberculosis. Chest 114(5):1244–1252
Lin C-H, Lin C-J, Kuo Y-W, Wang J-Y, Hsu C-L, Chen J-M, Cheng W-C, Lee L-N (2014) Tuberculosis mortality: patient characteristics and causes. BMC Infect Dis 14(1):5. https://doi.org/10.1186/1471-2334-14-5
Basu S, Zaidi H, Salavati A, Hess S, Carlsen PF, Alavi A (2014) FDG PET/CT methodology for evaluation of treatment response in lymphoma: from “graded visual analysis” and “semiquantitative SUVmax” to global disease burden assessment. Eur J Nucl Med Mol Imaging 41(11):2158–2160. https://doi.org/10.1007/s00259-014-2826-3
Marin-Oyaga VA, Salavati A, Houshmand S, Pasha AK, Gharavi M, Saboury B, Basu S, Torigian DA, Alavi A (2015) Feasibility and performance of an adaptive contrast-oriented FDG PET/CT quantification technique for global disease assessment of malignant pleural mesothelioma and a brief review of the literature. Hell J Nucl Med 18(1):11–18. https://doi.org/10.1967/s002449910162
Salavati A, Borofsky S, Boon-Keng TK, Houshmand S, Khiewvan B, Saboury B, Codreanu I, Torigian DA, Zaidi H, Alavi A (2015) Application of partial volume effect correction and 4D PET in the quantification of FDG avid lung lesions. Mol Imaging Biol 17(1):140–148. https://doi.org/10.1007/s11307-014-0776-6
Sathekge MM, Maes A, Pottel H, Stoltz A, van de Wiele C (2010) Dual time-point FDG PET/CT for differentiating benign from malignant solitary pulmonary nodules in a TB endemic area. S Afr Med J 100(9):598–601
Chen S, Li X, Chen M, Yin Y, Li N, Li Y (2016) Limited diagnostic value of dual-time-point (18)F-FDG PET/CT imaging for classifying solitary pulmonary nodules in granuloma-endemic regions both at visual and quantitative analyses. Eur J Radiol 85(10):1744–1749. https://doi.org/10.1016/j.ejrad.2016.07.016
Author information
Authors and Affiliations
Contributions
HS, TS acquisition, analysis, and interpretation of data; drafting and revising the manuscript; final approval. OG conception of the work; meta-analysis of data; interpretation of data; revising the manuscript; final approval. SH (corresponding author): conception of the work; interpretation of data; revising the manuscript; final approval. All authors agree to be accountable for all aspects of the work in ensuring that questions related to the accuracy or integrity of any part of the work are appropriately investigated and resolved.
Corresponding author
Ethics declarations
Conflict of interest
The authors did not receive financial support from any organization for the submitted work and have no other relationships or activities that could appear to have influenced the results. This article does not contain any studies with human or animal subjects performed by the any of the authors.
Electronic supplementary material
Below is the link to the electronic supplementary material.
Rights and permissions
About this article

Cite this article
Sjölander, H., Strømsnes, T., Gerke, O. et al. Value of FDG-PET/CT for treatment response in tuberculosis: a systematic review and meta-analysis. Clin Transl Imaging 6, 19–29 (2018). https://doi.org/10.1007/s40336-017-0259-2
Received:
Accepted:
Published:
Issue Date:
DOI: https://doi.org/10.1007/s40336-017-0259-2