
Abstract
Two different types of cellulose nanocrystals, derived from water hyacinth fibers and microfibrillated cellulose (MFC), were prepared using an acid hydrolysis treatment. These cellulose nanocrystals (CNCs) were further used as barrier enhancing fillers for polyurethane (PU) blended with 25 wt% of poly(vinylidene dichloride) (PVDC). The aim of this study was to investigate the effects of types and concentration of CNCs on mechanical, optical and barrier properties of polymer composite films. The feasibility of applying the obtained composite films as an encapsulating material for enhancing the lifetime of dye sensitized solar cells (DSSC) was also of interest. The acid hydrolysis of the MFC-yielded rod-shaped cellulose nanocrystals (CNCm) while the acid-hydrolyzed water hyacinth led to a formation of spherical-shaped cellulose nanocrystals (CNCw). Regardless of the types of CNCs, the optical transparency of the composite films was maintained well above 60%. According to results in this study, the most efficient film with the lowest water vapor transmission rate of 0.0517 g m−2 day−1 was the PU/PVDC film reinforced with 0.1 wt% of CNCm. The encapsulants made from this composite could prolong the lifetime of the DSSC devices for up to 14 days, with the normalized PCE value of 0.78. Overall, this work showed that the considerations of the barrier properties of the polymer encapsulants alone are insufficient to ensure that the system would be effective. An interfacial adhesion between the encapsulants and the electrodes, as well as some side reactions between polymers and chemicals inside the fabricated cell, should also be taken into account.
Introduction
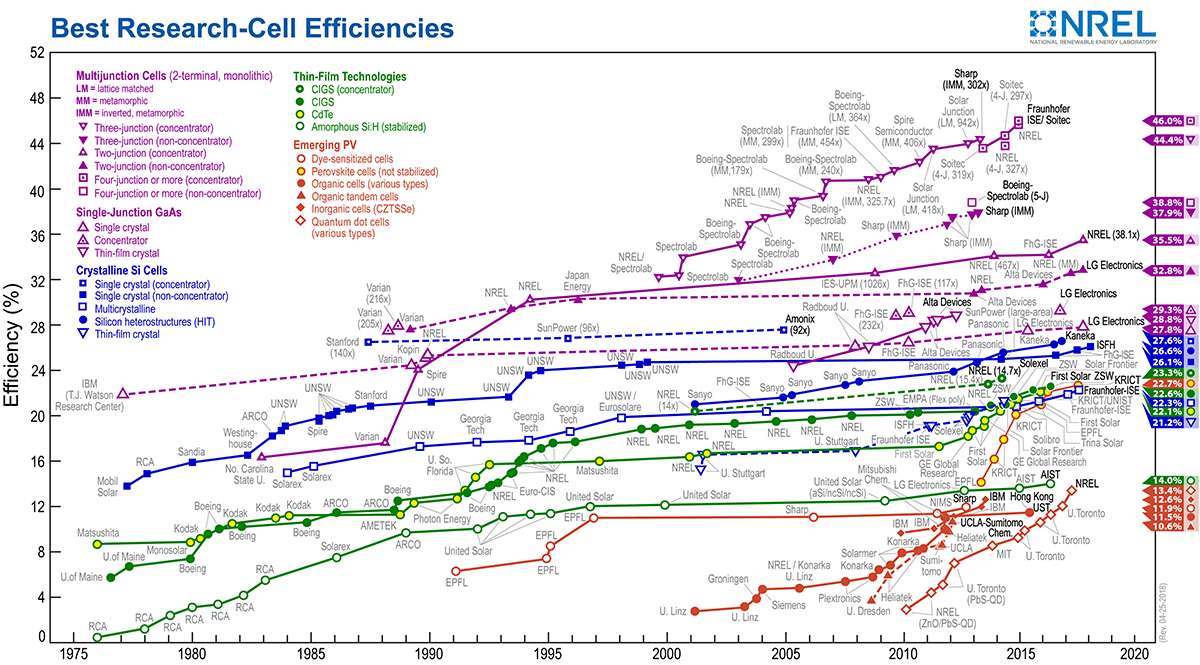
On the basis of the types of photoactive materials and their fabrication technology, photovoltaic cells can be classified into three main categories: the silicon-based technology, the compound semiconductor-based technology (such as CIGS and CdTe), and the new emerging solar cells technology. In the development of the new emerging (or the next generation) solar cells, there is a triangle of research topics to be considered, (1) the enhancement of their performance, (2) the reduction of their production process and material costs and (3) the improvement of their lifetime and durability. At the present time, the best global research cell efficiency values for organic photovoltaics (OPVs), the dye-sensitized solar cells (DSSC) and the perovskite solar cells (PSC), certified by the National Renewable Energy Laboratory (NREL), of 11.5%, 11.9% and 22.7% were reported, respectively [1]. However, the issue of lifetime improvements in these new generation solar cells is still a major challenge [2]. This is related to the moisture and oxidation stability of the materials underneath the cells [3]. In this regard, an encapsulation is one possible approach that can be used to enhance the lifetime of these devices. Generally, encapsulation techniques can be categorized into three main types [4] (1) the use of the metal/or glass lid technique, (2) thin film encapsulations using hybrid organic/inorganic materials and (3) the use of the polymer barrier film for lamination and encapsulation. The advantages of the last technique include its relatively less expensive processing cost and mechanical flexibility of the encapsulant. At the present time, polymer encapsulants for OPV, such as the Ossila’s product, are known to be commercially available [5]. However, it should be noted that this thermosetting polymer is a kind of UV curable epoxy-based resin. This was originally designed and developed for use with the OPV and not for the DSSC. This is an important issue since both the DSSC dye and the electrolyte are susceptible to photocatalytic attack, and so they can be degraded upon an exposure to UV light during the encapsulation process [6]. Besides, OTR and WVTR values of many polymer based encapsulants have yet to be further reduced, for the sake of a longer lifetime of the devices. Therefore, the development of high performance encapsulants for various types of solar cells is still interesting and deserves consideration.
In our earlier work, the use of polyurethane (PU)/CNC composite as an encapsulating material for the dye-sensitized solar cell, was explored [7]. The PU resin was mixed with a hardener and CNCs derived from bacterial cellulose (B-CNC). The lowest WVTR value of the PU composite (54.2 g m−2 day−1) was obtained using 1.5 wt % of the esterified B-CNCs. Even though the above value is still much higher than the ideal WVTR value (< 10−6 g m−2day−1) of the encapsulation material required for the new generation solar cells [8], it was found that the lifetime of the DSSC encapsulated with the PU/B-CNC composite film could be prolonged for more than 4 months (with the normalized power conversion efficiency of 0.8 maintained). This was not the case for the bare DSSC (without encapsulation) which was degraded within a couple of days. Nevertheless, to further improve the barrier properties of this polymer composite, a kind of hydrophobic polymer namely poly(vinylidene dichloride) (PVDC) was used for blending with PU. According to our previous preliminary study [9], PU/PVDC blends were partially miscible, depending on the blending ratios. A high percentage of visible light transmittance (above 80%) through the blend film could be maintained when the PVDF content was no greater than 25%. The water vapor transmission rate through the blend films also decreased with increasing the PVDC content. Notably, the WVTR value of PVDC is intrinsically low (in the range of 0.9–3.4 g m−2 day−1) in comparison with that of other polymers [10]. However, in terms of oxygen permeability, the OTR value of PVDC is still considerably high (1.2–2.3 g m−2 day−1) for the organic electronic and solar cell applications. To further enhance the barrier properties of the PU/PVDC encapsulating films, specific approaches might be used, for instance coating with a more hydrophobic layer [11], development of an organic/inorganic multilayered film [12] and introduction of a tortious pathway within a polymer matrix film [13]. The mixing of barrier enhancing fillers with polymers to generate a tortious pathway is an interesting method. With this approach, the reduction of the OTR and WVTR through polymer films can be expected. For example, our earlier work showed that, by mixing MFC with either EVA [14] or Surlyn [15], transparent composite films with lower WVTR and OTR values were obtained. Other types of nanomaterials such as clay (MMT), ZnO, and TiO2 have also been used as fillers to enhance the barrier properties of EVOH [16], PVA [17], and Surlyn/EVOH blends [18]. From the above work, WVTR values in the range of 2×10⁻³–3×10⁻⁵ g m−2 day−1 were achieved, depending on the type and concentration of the fillers.
In the present work, the use of CNCs as barrier enhancing fillers for the PU/PVDC blend film was studied. Two different sources of cellulosic fibers were used for preparing the CNCs. These are the microfibrillated cellulose (MFC) and the cellulose derived from water hyacinth. It is worth mentioning that the water hyacinth is a kind of floating water weed which interfered with water treatment, irrigation, and water supply. In this regard, rather than utilizing the plant weed as raw material for producing agricultural fertilizers, animal feed, building materials, ethanol and reducing sugar [19], it would be interesting and useful if this material can be value added. Even though the preparation, characterization and applications of CNCs from water hyacinth were reported by several authors [20,21,22,23,24], however, to the best of our knowledge, the efficacy of water hyacinth based CNCs, in serving as a barrier enhancing filler, particularly in the PU/PVDC blend, has not been studied and reported. In this regard, owing to their differences in terms of origin and cellulose compositions, it was hypothesized that the geometry and dimensions of the CNCs obtained from water hyacinth and MFC using the acid hydrolysis could be different. This might affect the properties of the polymer composites. The aim of this work was to investigate the effects of the types and concentration of CNCs on mechanical, optical, and barrier properties of PU/PVDC blend film. The lifetime of dye sensitized solar cells, encapsulated with the developed PU/PVDC/CNC composite films was also examined.
Experimental
In this study, a kind of room temperature curable polyurethane (PU) was used for blending with PVDC. The PU resin consists of two main reagents, the acrylic-based polyol, and the isocyanate-based hardener. The acrylic polyol (SETALUX 1184SS-51) was supplied from NUPLEX. It contains 2.0% of OH content with an acid value range between 2.5 and 4.7 mg KOH g−1. The hardener used for reacting with the polyol was an aliphatic polyisocyanate (HDI biuret) (Desmodur ® N75MPA/X from Bayer MaterialScience) with an NCO content of 16.5%. Poly(vinylidene chloride) (PVDC, R204) was purchased from the Asahi Kasei Chemical Corporation. The microfibrillated cellulose (MFC), available in a form of sludge (10 wt% in water), was purchased from Daicel FineChem Ltd. (Tokyo, Japan). The water hyacinth plant (Eichhonia crassipes) was collected from the Chao Phraya River, Bangkok, Thailand, at Universal Transverse Mercator (UTM) coordinate of (14.1203336, 100.527595).
Preparation of cellulose nanocrystals
200 g of MFC were dispersed in acetone for 6 h, and subsequently dried in an oven at 80 °C until reaching a constant weight. The fibers were then ground with a high speed mixer for 5 min to disintegrate the fibers. Next, 20 g of the pretreated MFC was reacted with 200 ml of the sulfuric acid (64 wt%) at 45 °C for 30 min. After that the acid-treated MFC suspension was diluted with de-ionized water. The treated fibers were isolated from the liquid phase by centrifugation for 30 min. Finally, the products were purified in a dialysis tube. For preparing CNCs from the water hyacinth plant, the collected water hyacinth was washed with tap water for several times. Afterward, the rod (trunk part of the plant) was isolated from the root and leaves, before cutting into small pieces (about 1 inch long). These were further ground into smaller pieces (see Fig. 1), using a high speed mixer for 5 min. The resulting fibers were then washed with methanol before drying in an oven at 80 °C until reaching a constant weight. This cycle was repeated twice to promote more disintegration of the fibers. Next, the fiber was treated with a solution of sodium hydroxide (4 wt%) at 85 °C for 6 min, followed by bleaching with hydrogen peroxide (4 wt% in aqueous). After that, an acid hydrolysis process was carried out as follows. 1 g of the fibers was reacted with 100 ml of the sulfuric acid (H2SO4) solution (50 wt%) at 50 °C, for 30 min. Notably, the above condition was also much milder than what is normally used for preparing reduced sugar from a plant [25]. According to our experience, it was found that if the concentration of the acid was greater than this, no cellulose products were obtained. As from these, the products obtained from the acid hydrolysis of water hyacinth fibers and the MFC were denoted as CNCw and CNCm, respectively.

Photographs of various forms of water hyacinth during the preparation a the cut and ground fibers, after washing with methanol, b the NaOH-extracted and H2O2-bleached fibers, c An aqueous solution of the acid-hydrolyzed celluloses d A solution casted film of the water hyacinth-based cellulose nanocrystals
Preparation of PU/PVDC blend and composites
The acrylic polyol was dried in a vacuum oven at 60 °C prior to mixing with the aliphatic polyisocyanate, at a weight ratio of 1/4, using tetrahydrofuran (THF) as a solvent. The polyurethane was then mixed with PVDC at a weight ratio of 25/75 w/w [9]. Likewise, for preparing the PU/PVDC/CNC composites, a suspension of the acid-hydrolyzed celluloses (2 wt% in THF) was prepared by a solvent exchange process. After that, a given amount of the CNC suspension was added to the solution of the PU/PVDC. The concentration of the CNCs in the polymer composite system varied from 0.05 to 1.0 wt%. Finally, the mixture was casted onto a Teflon mold, and was dried at room temperature. The thickness of the films was approximately 300 µm.
Characterizations and testing
The crystal structure and degree of crystallinity of the cellulose fibers and CNCs were determined by an X-ray diffraction (XRD) technique, using an X-ray diffractometer (PANalytical, X’Pert PRO) with Cu Kα radiation (λ = 0.15406 nm). The diffractometer was operated at 30 kV, 40 mA, and the sample was scanned over a 2θ range of 5–60°. To determine the crystallinity index (Xc) of the celluloses, the following equation was used:
where I002 and Iam are the peak intensities of crystalline and amorphous materials, respectively.
Functional groups on the surface of the fibers and CNCs were monitored using a Fourier transform infrared spectrometer (Thermo instrument, iS5 model) in an ATR mode. The cellulose film was cast and then dried at 100 °C for 12 h. The spectra were scanned over the wavenumber ranging between 550 and 4000 cm−1. A similar procedure and a testing mode were also used for the analysis of the composite films.
The TGA experiment was carried out with a NETZSCH instrument (STA 409PC/4/H Luxx). About 10 mg of the sample was used, and the TGA experiment was scanned over temperatures ranging between 35 °C and 800 °C, under a nitrogen gas atmosphere and at a heating rate of 20 °C min−1.
Mechanical properties of the nanocomposite films were determined using a universal testing machine (Shimadzu Autograph AG-I). Dumbbell-shaped specimens were prepared by cutting the dried films with a die, in accordance with the ASTM D638 standard. The gauge length used was 50 mm and a tensile test was carried out at a crosshead speed of 50 mm min−1, using the 5 kN load cell. At least five specimens were tested for each material, and the average values of Young’s modulus, tensile strength at break, and elongation at break were calculated.
The morphology of the original fibers and polymer composites was examined using a scanning electron microscope (Nova NanoSEM 450, FEITM) equipped with a secondary electron detector. The sample preparation of CNCs was prepared by dropping an aqueous CNC suspension (0.1 wt%) onto the stub coated with carbon tape. For the polymer composites, the specimens were prepared by cryogenic fracturing, and were dried before coating with Au.
The optical properties of the polymer composite films, described in terms of light transmittance, were determined by a UV/visible spectrophotometer (Shimadzu UV-3100). The spectra were recorded over wavelengths ranging between 300 and 2000 nm. The transmission of light through the polymer films was integrated over a wavelength range of 400–1100 nm [26]. The percentage of visible light transmittance was determined in accordance with the ISO 9050 standard method.
The barrier property of the polymer nanocomposite films was evaluated by measuring the water vapor transmission rate (WVTR), in accordance with the ASTM E96-93 standard method, with some modification. Experimentally, the polymer film was cut into a 2 × 2 cm2 square piece. After that the specimen was dried in a vacuum oven at 50 °C for 24 h. The dried specimen was then placed on top of the pre-cut aluminum foil. The aluminum foil mask containing the film was then attached to the top of a conical flask, which was filled with 20 ml of distilled water. The setup system (the water filled container and the Al foil mask with the film) was weighted and placed in an oven at 40 °C with a relative humidity of 20% for 24 h. After that the system was weighed again. At least three specimens were tested for each material. The WVTR value was determined using the following equation:
where W is the mass of H2O loss from the container (g), T is the thickness of the film (mm), t is the duration of the measurement (day), and A is the effective area of the film (m2).
Fabrication, encapsulation, and testing of dye sensitized solar cells
Dye-sensitized solar cells with a configuration of FTO/TiOx/TiO2/Dye (N719)/Pt/FTO were prepared. The electrolyte solution used was HI-30 purchased from Solaronix. The dye used was N719, which was dissolved in co-solvents comprised of 5 ml of anhydrous acetonitrile and 5 ml of tert-butanol. An ethylene–acrylic acid copolymer (Surlyn from DuPont) was used as a sealant, for the fabrication of the dye sensitized solar cells. More details concerning the fabrication process can be found in our earlier report [7]. After fabrication, the devices were encapsulated with polymer composite films (containing 0.1 wt% of the CNCs) by a dip-coating technique, at a speed of 1 mm min−1. The encapsulated cells were then cured and dried at room temperature for 24 h. After that they were kept under ambient conditions before carrying out a current density–voltage (J–V) test. J–V characteristics of the various cells, both at the initial stage and after kept storage for various times, were measured using the Keithley 2400 source meter under 1.5 AM. The light source was generated by a solar simulator (Newport 91150 V model, 1000 W, Xenon lamp) equipped with a 1.5-G air mass filter. The active area of the DSSC was 0.4 × 1.0 cm2.
Results and discussion
Characterizations of the prepared cellulose nanocrystals
Figure 2 shows XRD patterns of the celluloses before and after the acid hydrolysis treatment. The characteristic XRD peaks at (2θ) = 15.6° 22.5° and 34.1° were noted from the XRD patterns of both the MFC and the water hyacinth. This corresponds to the 110, 002 and 004 crystal planes of the Cellulose I [27]. The percentages of crystallinity of MFC and water hyacinth were 88.26 and 86.20, respectively. After treating with acid, an intensity of the XRD peak at (2θ) = 22.5° increased, compared to that of (2θ) = 15.6°. This was due to the removal of the amorphous phase of cellulose. This resulted in the higher percentage of the crystallinity of the acid hydrolyzed MFC and the acid hydrolyzed water hyacinth to 95.12 and 94.84, respectively.

XRD patterns of the water hyacinth fibers (W fiber), the microfibrillated cellulose (MFC), the W-based cellulose nanocrystals (CNCw), and the MFC-based cellulose nanocrystals (CNCm)
Figure 3 shows FTIR spectra of the various types of the fibers. The characteristic FTIR absorption peaks at 3332 and 2882 cm−1, representing the vibration frequencies of O–H (stretching) and C–H (symmetrical stretching) can be noted, respectively. The spectrum of water hyacinth fiber shows the peak at 1724 cm−1, corresponding to a carboxylic of lignin or hemicellulose. The above result suggested that even after treating it with an alkaline solution, the extracted water hyacinth fibers still contained hemicellulose and lignin phases. The above features were not the case for the commercial grade MFC used in this work. In addition, both the MFC and the water hyacinth show the FTIR absorption peaks at 1623 cm−1 and 1610 cm−1, respectively. This could be ascribed to the vibration of C=C and possibly some adsorbed water. The peak at 890 cm−1 (C–H rocking vibration of the cellulose structure) can also be noted. After treating MFC with the acid, the FTIR spectrum of the product was similar to that of the original fibers. However, in the case of acid hydrolyzed water hyacinth, the FTIR absorption peak at 1202 cm−1 and 1240 cm−1, corresponding to the C–O–C (symmetric stretching), and C−O (stretching) bonds in lignin, disappeared. The syringyl lignin was removed after the acid hydrolysis [28].

FTIR spectra of the water hyacinth fibers (W fiber), the microfibrillated cellulose (MFC), the W-based cellulose nanocrystals (CNCw), and the MFC-based cellulose nanocrystals (CNCm)
Figure 4 shows TGA thermograms of the original cellulose fibers and CNCs obtained from these cellulose sources. The first transition occurred over a temperature range between 75 and 125 °C, and could be ascribed to the dehydration of adsorbed water molecules. After that, the second transition temperature of about 220 °C, attributing to the decomposition of the hemicellulose was found from the water hyacinth fibers [29]. The decomposition temperature at this transition for the MFC and CNCs was higher (about 260 °C for MFC and CNCw and 300 °C for the CNCm). These discrepancies show that the untreated water hyacinth fiber contains pectin, lignin and hemicelluloses, which have lower decomposition temperature [30] than the MFC and CNCs. Next, the third transition occurred during a temperature range between 270 °C and 390 °C, corresponding to the decomposition of the cellulose phase. Above 500 °C, the percentage weight of the residue remained in the samples reached a plateau. This represents the carbonaceous materials [31]. Notably, the percentage of the residue weight from a TGA thermogram of the water hyacinth fiber was relatively greater than those of the MFC. This implies that the water hyacinth used in this study contained less amount of cellulose than the MFC. According to the literature, cellulose content in water hyacinths is versatile, ranging from 18 to 43% [32,33,34]. This might be due to the different origins of the biomass and the growth conditions. Furthermore, the above thermograms also show that the residual weight of the CNCw was lower than that of the water hyacinth fibers (before the acid hydrolysis). This was due to the fact that hemicellulose was further removed during the acid treatment. Likewise, the residual weight of the CNCw was greater than that of the CNCm. Again, this can be ascribed to the different source and composition of the original fibers.

TGA thermograms of the water hyacinth fibers (W fiber), the microfibrillated cellulose (MFC), the water hyacinth-based cellulose nanocrystals (CNCw), and the MFC-based cellulose nanocrystals (CNCm)
Figure 5 shows SEM images of the products obtained from the acid hydrolysis of both water hyacinth fibers and MFC. Rod-shaped nanocrystals were obtained from the acid hydrolysis of the MFC. The average crystal length, diameter, and aspect ratio of the cellulose derived from MFC were 1.7 µm, 194 nm and 10.08, respectively. On the other hand, the acid-hydrolyzed water hyacinth yielded a kind of spherical-shaped CNCs, with the average diameter size of 78.5 nm. It was believed that the different morphologies of the acid-hydrolyzed products were attributed to the different types and compositions of the two fibers. As mentioned above, the results from an XRD analysis (Fig. 2) indicated that the water hyacinth contained less percentage of crystallinity than the MFC. Consequently, the amorphous phase of the water hyacinth could be significantly destroyed by the acid, and thus the spherical-shaped CNCs were obtained.

SEM images of the acid-hydrolyzed water hyacinth (left) and the acid-hydrolyzed MFC (right)
Structural properties of the PU/PVDC composites
Noteworthy, it is also possible to develop a kind of flexible DSSC devices using the FTO-coated poly(ethylene naphthalate) (PEN) substrate in combination with the use of polymeric gel electrolyte. In this regard, mechanical properties of the developed composite materials deserve a consideration. Figure 6 shows typical stress–strain curves of the PU/PVDC and the composite films containing different types and concentrations of the CNCs. From the curves, it can be seen that the neat PU/PVDC blend film was considerably strong and tough, taking into account the slope, the ultimate stress and the strain at break of the profiles. After compounding it with CNCs, the stress–strain curves changed significantly. The slope of the curve increased which corresponded to the increase of the tensile modulus of the material. The above improvement was obtained at the expense of percentage elongation of the polymer composites (Table 1). These changes were caused by a reinforcing effect of the CNCs. Tensile strength values of the composites did not drop when the CNCs were added. This implies that the interfacial adhesion between the CNCs and polymer matrix was considerable. This could be attributed to the polar interaction between the hydroxyl groups of the CNCs and the urethane groups of the polymer matrix. However, in overall, the tensile toughness of the polymers decreased with the concentration of CNCs. It was also noted that the tensile properties of the composite films reinforced with CNCw were comparable to those reinforced with CNCm if the concentration of the CNCs was kept below 0.5 wt%. However, as the concentration was further increased, the tensile modulus and tensile toughness of PU/PVDC reinforced with CNCw were greater than those of the PU/PVDC/CNCm analogue. The discrepancies could be ascribed to the different shapes and dimensions between the two types of the CNCs, leading to different reinforcing efficacies.

Stress–strain curves of PU/PVDC composite films containing different types of CNCs
Figure 7 shows SEM images of the composite films containing a low concentration (0.05–0.30 wt%) of the CNCs. Some traces of the CNCm embedded in the polymer matrix were noted. In addition, the presence of the de-bonded or pull-out area between the CNC and the polymer matrix could also be observed. This might be due to the different thermal shrinkages between the cellulose and polymer matrix phase, induced by the cryogenic fracturing during the specimen preparation. The above observation was less apparent in the case of PU/PVDC composite films containing the same concentration (0.05–0.30 wt%) of CNCw. In this latter case, the presence of water hyacinth based CNCs cannot be clearly seen from the fracture surface of the composites. It was apparent that CNCw were more compatible with the polymers matrix than the CNCm. At the higher concentration (0.5–1.0 wt%) of the CNCs, it is noteworthy that cross-sectioned surfaces of the composites films were not homogeneous, regardless of the type and concentration of the CNCs (Fig. 8). Some porous areas containing highly agglomerated particles could be found. These porous areas were also unevenly distributed throughout the polymer matrix phase. A consideration of SEM images of the specimens at the higher magnification (see inset in the Fig. 8) revealed that these areas represented the polymer-coated CNCs. Besides, an EDX dot map (Fig. 9) shows that a distribution of Cl atoms corresponded to the distribution of the porous area, whereas the dot map of the N atoms resembled the dense film area. In other words, the porous area was a PVDC-riched phase, whereas the dense film area was a polyurethane-rich phase. In our opinion, the uneven distribution of particles might possibly be related to the fact that PU and PVDC were not completely miscible. According to the chemical structures, PVDC molecules are more hydrophobic than the PU. This is due to the fact that PU molecules contain urethane linkages and some isocyanate and hydroxy groups at the chain ends. PVDC is known to be partially miscible with PVC [35], whereas the PU is incompatible with PVC [36]. Hence, in relation to this study, it was possible that the PU and PVDC were phase separated, and the CNCs might be resided within one phase.

SEM images of PU/PVDC composite films containing different types and concentrations of cellulose nanocrystals; a 0.05% CNCw, b 0.1% CNCw, c 0.3% CNCw, d 0.05% CNCm, e 0.1% CNCm and f 0.3% CNCm

SEM images PU/PVDC film reinforced with a 0.5 wt%, b 1.0 wt% of CNCw, c 0.5 wt% and d 1.0 wt% of CNCm

SEM image, EDX spectra, and X-ray dot map of Cl and O Kα of the PU/PVDC film reinforced with 0.5% of CNCw
In terms of barrier properties, the WVTR of the PU/PVDC blend films (without reinforcement) measured in this study was 0.162 g m−2 day−1. The value lied between those of the neat PU and PVDC films (0.504 and 0.139 g m−2 day−1, respectively). After applying CNCs into the blend film, the WVTR value of the polymer composite films changed with the concentration of CNCs in a non-linear fashion (Fig. 10). Initially, the WVTR values dropped rapidly when a small amount (0.05–0.1 wt%) of the CNCs was added. This can be explained in light of the tortious model [13]. In this study, the lowest WVTR value of 0.0517 g m−2 day−1 was measured from the polymer blend system containing 0.1% of CNCm. However, when the concentration of the CNCm was further increased above 0.3 wt%, the WVTR values rose again. It is possible that the higher the concentration of CNCm, the greater the voids and porous area between the cellulose and polymer matrix phase. The above effect was less pronounced for the CNCw-based encapsulation system. In this latter case, the WVTR values initially dropped to the lowest value of 0.1352 g m−2 day−1 when 0.1 wt% of the filler was added. When the concentration of CNCw was further increased, the WVTR values only gradually increased. This could be ascribed to the different dimensions and percentage of cellulose compositions within the two types of CNCs. Herein, it was found that CNCw contained less amount of cellulose content than the CNCm analogue. In this regard, it was possible that CNCw could adsorb less moisture than the CNCm analogue. Besides, since the dimensions of CNCw were smaller than the CNCm, the increase of the voids between polymer and the cellulose nanocrystals could be less obvious.

Water vapor transmission rate (WVTR) and percentage visible light transmittance of PU/PVDC composite films as a function of CNC concentrations
Despite the improvement of barrier properties, it was interesting that transparency of the composite films could be maintained with the introduction of CNCs. Figure 10 shows that by using CNCw as a filler, a visible light transmittance of the film in the range of 75–81% was obtained. On the other hand, transmittance in the range of 73–90% could be achieved, only if the concentration of CNCm used for mixing with PU/PVDC was kept below 0.5 wt%. If the concentration of CNCm was increased above 0.5 wt%, the visible light transmittance dropped significantly. In our opinion, these discrepancies can be attributed to the different geometries and the intrinsic reflective indices between the two types of CNCs. Nevertheless, on the basis of the results from WVTR and visible light transmittance tests, the polymer composite films containing 0.1 wt% of CNCm and 0.1 wt% of CNCw were selected for further used as encapsulants for the DSSC devices in the next part.
Performance and lifetime of the DSSC encapsulated with PU/PVDC composites
Last but not the least, the performance and lifetime of the DSSC encapsulated with the developed composite films deserve consideration. Figure 11 shows typical I–V curves of some representative DSSC devices, with and without encapsulation. From the above curves, the fill factor and power conversion efficiency (PCE) values of the various cells were calculated (Table 2). An initial power conversion efficiency of the bare DSSC (without encapsulation) was 2.0%. After encapsulation, the PCE values of the cells in the range of 1.92%–2.04% were obtained. These values are still comparable to that of the bare DSSC cell. This indicated that the presence of encapsulating films did not interfere with the performance of the device. In term of the stability and lifetime of the cells, changes in the normalized PCE values of the various DSSC cells as a function of time, are illustrated in Fig. 11. The normalized PCE of the bare DSSC dropped rapidly to 0.5 within 3 days. Moreover, if the neat PVDC (without blending with PU) was used as an encapsulant, the stability of the DSSC was still poor. On the other hand, if the neat PU was used as an encapsulant, the normalized PCE of the cell above 0.86 could be maintained, even after 7 days of storage time. The above discrepancies can be explained in the light of the better interfacial adhesion between the PU and the glass substrate. Due to the intrinsic hydrophobicity of the PVDC, the interfacial adhesion between the PVDC and the glass substrate was poor (as shown in Fig. 12). In fact, the above statements were in agreement with the results from a cross-cutting test, which indicated that a fraction of the PVDC film remaining on the glass substrate was zero, whereas that of the PU film, undergoing similar test, was 100%. As a result, the poor adhesion between the PVDC film and the glass substrate could lead to some leakage of the liquid electrolyte inside the fabricated cell. The electrolyte leakage was thought to be one of the main factors contributing to the failure of DSSC. This was related to the degradation of the TiO2/dye/electrolyte interface as a side effect [37].

Changes in the normalized power conversion efficiency of the DSSCs, encapsulated with different types of PU/PVDC/CNC composites, as a function of storage time

Cross-sectional SEM images of the DSSC cells encapsulated with; a PVDC, b PU, c PU/PVDC, d PU/PVDC/CNCm. The top layer represents the encapsulants, whereas the bottom layer is the glass substrate
Using the PU/PVDC blend for encapsulation, it was found that the performance of the DSSC device increased, compared to that encapsulated with the neat PU. This was due to the compromise between the barrier and adhesion properties of the system. However, after 14 days, the PCE value of the cell encapsulated with the PU/PVDC film, rapidly dropped to about 0.085% (equivalent to the normalized PCE of 0.53). This change was accompanied by our observation that the area around the holes of the device was discolored (see Fig. 13). Of note, these small holes were premade, by drilling the FTO glass. These were used as the ports for injecting the liquid electrolyte into the cell, prior to completing the fabrication and encapsulation. Moreover, our control experiments, involving an immersion of the free-standing neat PVDC film (without blending) into the liquid electrolyte, revealed that the color of the standalone PVDC film also turned black after 14 days. That was not the case for the neat PU film immersed in the same liquid. In this regard, it was believed that the liquid electrolyte was in direct contact and interacted with the PVDC phase (in the PU/PVDC based encapsulant) at the open area around the holes. Notably, according to the technical data sheet from the supplier [38], the electrolyte contains several ingredients including a redox couple (iodide/tri-iodide), lithium salt, pyridine and acetonitrile. In relation to this study, it was possible that the pyridine base acting as a catalyst induced the degradation of the PVDC phase in the encapsulant [39]. In this regard, some possible degradation mechanisms including the dehydrochlorination and crosslinking led to the discoloration and reduction of mechanical properties of the polymer [40]. Finally, these factors contributed to the degradation of the optical, mechanical, and barrier properties of the PU/PVDC encapsulant. The above changes account for the eventual reduction of the power conversion efficiency values of the encapsulated solar cells. In terms of the effects of the CNC type, during the first 7 days, it was found that the normalized PCE value of the DSSC encapsulated with PU/PVDC/CNCm composites was comparable to those encapsulated with the PU/PVDC (without any reinforcement). However, after 14 days, the normalized PCE values of the latter device system dropped significantly, whereas that of the former device system was more stable. In other words, the degradation of PU/PVDC encapsulating film could be suppressed by adding the CNCm. This could be related to the presence of the CNCs in the composite films, capable of retarding the diffusion of liquid electrolyte towards the PVDC phase of the film. Last but not the least, it was observed that the performance of the DSSC encapsulated with the PU/PVDC/CNCm was also superior to that of the PU/PVDC/CNCw analogue. In our opinion, one possible explanation includes the fact that the water hyacinth is capable of acting as an efficient adsorbant for dyestuff, textile effluent, and heavy metals [41]. Therefore, in this study, it is possible that the CNCw reacted with Ru-based N719 dye in the cell. This destroyed the dye composition and interrupted the working mechanism of the dye sensitized solar cell. Apart from that, it might be possible that the above effect was attributed to a relatively low WVTR value of the PU/PVDC/CNCm composite film, compared with that of the PU/PVDC/CNCw film (Fig. 10).

Photographs of the DSSC devices encapsulated with PU/PVDC film (left) and with the neat PU film (right), after storage for 14 days. The yellow color represents the Kapton tape, whereas the dark color reflects a discoloration of the PVDC phase
Conclusions
This work demonstrated that the moisture barrier property of PU/PVDC film (75/25%w/w) can be improved by adding a suitable amount of CNCs into the polymers matrix. At low concentration of CNCs (0.1–0.3 wt%), the properties of the polymer composite films containing CNCs hydrolyzed from MFC were slightly better than those containing the CNCs prepared from the water hyacinth fibers. However, when the concentration of the CNCs was further increased above 0.3 wt%, the barrier and optical properties of the composite system containing water hyacinth-based CNCs were more superior. The discrepancies were ascribed to the different compositions, geometries and dimensions of the two types of CNCs. In this study, the most efficient film with lowest water vapor transmission rate (0.0517 g m−2 day−1) was the PU/PVDC film reinforced with 0.1% of CNCm. The optical transparency of the films, described in terms of percentage visible light transmittance values, was maintained well above 75% when the concentration of the CNCs was kept below 0.5 wt%. In general, these PU/PVDC composite films reinforced with CNCs might be used as moisture barrier film for packaging applications. However, for solar cell encapsulation, considerations of the barrier properties of the polymer encapsulants alone are insufficient to ensure that the system will be effective. An interfacial adhesion between the encapsulating film and the electrodes should be controlled and optimized. In addition, the interaction between polymers and chemicals inside the fabricated cell should also be taken into account. In this study, we found that PVDC poorly adhered to the glass substrate, and that could also interact with the chemical ingredient in the liquid electrolyte. This leads to a degradation of the encapsulating materials over time. Nevertheless, in this study, it was found that the PU/PVDC composite film reinforced with 0.1% of CNCm could prolong the lifetime of the DSSC device for up to 14 days, with the normalized PCE value of 0.78.
References
NREL, Research cell efficiency record, [Online]. Available at: https://www.nrel.gov/pv/assets/images/efficiency-chart.png (2018) Accessed 12 February 2018
Gevorgyan, S.A., Madsen, M.V., Roth, B., Corazza, M., HÖsel, M., Søndergaard, R.R., Jørgensen, M., Krebs, F.C.: Lifetime of organic photovoltaics: status and predictions. Adv. Energy Mater. 6(2), 1–17 (2016)
Niu, G., Guo, Z., Wang, L.: Review of recent progress in chemical stability of perovskite solar cells. J. Mater. Chem. A. 3(17), 8970–8980 (2015)
Yu, D., Yang, Y.Q., Chen, Z., Tao, Y., Liu, Y.F.: Recent progress on thin-film encapsulation technologies for organic electronic devices. Opt. Commun. 362, 43–49 (2016)
Encapsulation epoxy for photovoltaics and OLEDs, [Online]. Available at: http://www.ossila.com/products/pv-oled-encapsulation-epoxy(2018) Accessed 12 February 2018
Matthew, C., Daniel, B., Trystan, W., David, W.: Photocatalytic oxidation of triiodide in UV a-exposed dye-sensitized solar cells. Int. J. Photoenergy (2012). https://doi.org/10.1155/2012/524590
Yuwawech, K., Wootthikanokkhan, J., Wanwong, S., Tanpichai, S.: Polyurethane/esterified nanocellulose composites as a transparent moisture barrier coating for encapsulation of dye sensitized solar cells. J. Appl. Polym. Sci. (2017). https://doi.org/10.1002/app.45010
Seethamraju, S., Rammamurthy, P.C., Madras, G.: Encapsulation for improving the efficiencies of solar cells. In: Viswanathan, B., Subramanian, V.R., Lee, J.S. (eds.) Nanostructure science and technology; materials and processes for solar fuel production, p. 23. Springer, Heidelberg (2014)
Yuwawech, K., Deetuam, C., Wootthikanokkhan, J.: A feasibility of developing transparent barrier coating for dye sensitized solar cells from polymer composites based on PVDC/PU reinforced with cellulose nanocrystals. The International Polymer Conference of Thailand (PCT-7) (2017)
Technical Bulletin No. 110 Gas Barrier Properties of Resins, [Online]. Available at: http://www.evalevoh.com/media/36916/tb_no_110.pdf(2018) Accessed 12 February 2018
Syed, J.A., Tang, S., Meng, X.: Super-hydrophobic multilayer coatings with layer number tuned swapping in surface wettability and redox catalytic anti-corrosion application. Sci. Rep-(UK) 7, 4403 (2017)
Seo, S.W., Jung, E., Chae, H., Seo, S.J., Chung, H.K., Cho, S.M.: Bending properties of organic–inorganic multilayer moisture barriers. Thin Solid Films 550, 742–746 (2014)
Bharadwaj, R.K.: Modeling the barrier properties of polymer-layered silicate nanocomposites. Macromolecules 34(26), 9189–9192 (2001)
Yuwawech, K., Wootthikanokkhan, J., Tanpichai, S.: Enhancement of thermal, mechanical, and barrier properties of EVA solar cell encapsulating films by reinforcing with esterified cellulose nanofibers. Polym. Test. 48, 12–22 (2015)
Lertngim, A., Phiriyawiruta, M., Wootthikanokkhan, J., Yuwawech, K., Sangkhun, W., Kumnorkaew, P., Muangnapoh, T.: Preparation of Surlyn films reinforced with cellulose nanofibres and a feasibility of applying the transparent composite films for organic photovoltaic encapsulation. R. Soc. Open. Sci. 4(10), 170792 (2017)
Seethamraju, S., Ramamurthy, P., Madras, G.: Flexible poly(vinyl alcohol-co-ethylene)/modified MMT moisture barrier composite for encapsulating organic devices. Rsc. Adv. 31, 12831–12838 (2013)
Seethamraju, S., Ramamurthy, P., Madras, G.: Ionomer based blends as water vapor barrier materials for organic device encapsulation. Acs. App. Mater. Inter. 5, 4409–4416 (2013)
Kopanati, G.N., Ramamurthy, P.C., Madras, G.: TiO2/EVOH based reactive interlayer in surlyn for organic device encapsulation. Mater. Res. Express. 3, 025302 (2016)
Ganguly, A., Chatterjee, P.K., Dey, A.: Studies on ethanol production from water hyacinth-A review. Renew. Sust. Energ. Rev. 16(1), 966–972 (2012)
Joshua, A.T., Mario. D.J., Soma, C., Nina, R. In: Fabrication and characterization of water hyacinth nanocellulose fiber polymer hydrogel nanocomposites in potential wound dressing application. 30th Philippine Chemistry Congress 47(19), 15–17 (2015)
Sundari, M.T., Ramesh, A.: Isolation and characterization of cellulose nanofibers from the aquatic weed water hyacinth: eichhornia crassipes. Carbohyd. Polym. 87(2), 1701–1705 (2012)
Asrofi, M., Abral, H., Kasim, A., Pratoto, A.: Characterization of the microfibrillated cellulose from water hyacinth pulp after alkali treatment and wet blending. IOP Conference Series: Mater. Sci. Eng. 204, 102018 (2017)
Devi, R.R., Dhar, P., Kalamdhad, A., Katiyar, V.: Fabrication of cellulose nanocrystals from agricultural compost. Compost Science & Utilization. 23(2), 104–116 (2015)
Asrofi, M., Abral, H., Kasim, A., Pratoto, A.: XRD and FTIR studies of nanocrystalline cellulose from water hyacinth (Eichhornia crassipes) fiber. J. Metastab. Nanocryst. 29, 9–16 (2017)
Harun, M.Y., Radiah, A.B.D., Abidin, Z.Z., Yunus, R.: Effect of physical pretreatment on dilute acid hydrolysis of water hyacinth (Eichhornia crassipes). Bioresource. Techno. 102(8), 5193–5199 (2011)
Cazanderna, A.W., Pern, F.J.: Encapsulation of PV modules using ethylene vinyl acetate copolymer as a pottant: a critical review. Sol. Energy Mater. Sol. Cells 43, 101–181 (1996)
Ju, x, Bowden, M., Brown, E.E., Zhang, X.: An improved X-ray diffraction method for cellulose crystallinity measurement. Carbohydr. Polym. 123(4), 76–81 (2011)
Abral, H., Kadriadi, D., Rodianus, A., Mastariyanto, P., Arief, I.S., Sapuan, S.M., Ishak, M.R.: Mechanical properties of water hyacinth fibers–polyester composites before and after immersion in water. Mater. Des. 58, 125–129 (2014)
Thi, B.T.N., Thanh, L.H.V., Lan, T.N.P., Thuy, N.T.D., Ju, Y.H.: Comparison of some pretreatment methods on cellulose recovery from water hyacinth (Eichhornia crassipe). JOCET. 5(4), 274–279 (2017)
Muchanyereyi, N.M., Kugara, J., Zaranyika, M.F.: Surface composition and surface properties of water hyacinth (Eichhornia crassipes) root biomass: effect of mineral acid and organic solvent treatment. Afr. J. Biotechnol. 15(21), 897–909 (2016)
Jitendra, K.P., Hitoshi, T., Antonio, N.N., Hyun, J.K.: Handbook of Polymer Nanocomposites. Processing, Performance and Application, Volume C: Polymer Nanocomposites of Cellulose Nanoparticles. Springer, Heidelberg (2014)
Kumar, P., Barret, D.M., Delwiche, M.J., Stroeve, P.: Method for pretreatment of lignocellulosic biomass for efficient hydrolysis and biofuel production. Ind. Eng. Chem. Res. 48(8), 3713–3729 (2009)
Saputra, A.H., Hapsar, M., Pitaloka, A.B.: Synthesis and characterization of CMC from water hyacinth cellulose using isobutyl-isopropyl alcohol mixture as reaction medium. Contem. Eng. Sci. 8(33), 1571–1582 (2015)
Istirokhatuna, T., Rokhati, N., Rachmawaty, R., Meriyani, M., Priyanto, S., Susanto, H.: Cellulose isolation from tropical water hyacinth for membrane preparation. Procedia Environ. Sci. 23, 274–281 (2015)
Bandyopadhyay, P.K., Shaw, M.T.: High damping poly (vinyl chloride)/polyurethane blends by tailoring the molecular structure of polycaprolactone-based polyurethanes. J. Vinyl. Technol. 4, 142–145 (1982)
Pigłowski, J., Łaskawski, W.: Compatibility of poly(vinyl chloride)/polyurethane blends. Macromol. Mater. Eng. 82(1), 157–170 (1979)
Mastroianni, S., Asghar, I., Miettunen, K., Halme, J., Lanuti, A., Brown, T.M., Lund, P.: Effect of electrolyte bleaching on the stability and performance of dye solar cells. Phys. Chem. Chem. Phys. 13, 6092–6100 (2014)
Iodolyte HI-30, [Online]. Available at: http://www.solaronix.com/notes/Note_Iodolyte_HI-30.pdf(2018) Accessed 12 February 2018
Kudryavtsev, Y.P., Varfolomeeva, O.B., Litovchenko, G.D., Sladkov, A.M.: Dehydrochlorination of polyvinylidene chloride. Bull. Acad. Sci. USSR. Ch + . 32(1), 170–172 (1893)
Hsieh, T.H.: Effects of oxygen on thermal dehydrochlorination of poly(vinylidene chloride). Polym. J. 31(1), 948–954 (1999)
Priya, E.S., Selvan, P.S.: Water hyacinth (Eichhornia crassipes)–An efficient and economic adsorbent for textile effluent treatment–A review. Arab. J. Chem. 10(2), S3548–S3558 (2017)
Acknowledgements
The authors would like to thank Mr. Alongkorn Nukulpakdi, from the RPSC Chemicals Co. Ltd., for his kind suggestions and supports in regards to the PU resin.
Funding
This work has been supported by the Nanotechnology Center (NANOTEC), NSTDA, Ministry of Science and Technology, Thailand, through its program the Center of Excellence Network. The authors acknowledge the financial support provided by King Mongkut’s University of Technology Thonburi through the “KMUTT 55th Anniversary Commemorative Fund”.
Author information
Authors and Affiliations
Corresponding author
Additional information
Publisher's Note
Springer Nature remains neutral with regard to jurisdictional claims in published maps and institutional affiliations.
Rights and permissions
Open Access This article is distributed under the terms of the Creative Commons Attribution 4.0 International License (http://creativecommons.org/licenses/by/4.0/), which permits unrestricted use, distribution, and reproduction in any medium, provided you give appropriate credit to the original author(s) and the source, provide a link to the Creative Commons license, and indicate if changes were made.
About this article

Cite this article
Yuwawech, K., Wootthikanokkhan, J. & Tanpichai, S. Transparency, moisture barrier property, and performance of the alternative solar cell encapsulants based on PU/PVDC blend reinforced with different types of cellulose nanocrystals. Mater Renew Sustain Energy 7, 21 (2018). https://doi.org/10.1007/s40243-018-0128-6
Received:
Accepted:
Published:
DOI: https://doi.org/10.1007/s40243-018-0128-6