
Abstract
Nitinol is a shape memory and superelastic alloy, respectively, and stainless steels are widely used materials in medical engineering, e.g., for implants and medical instruments. However, due to its high price and poor machinability, there is a high demand for dissimilar welding of nitinol components to stainless steel. During welding of titanium-containing alloys, like nitinol, to ferrous metals like stainless steel, intermetallic phases between titanium and iron may form. These phases are brittle and lead to rapid crack formation and/or inferior mechanical properties of the joint. In this study, superelastic nitinol wires are butt-welded with stainless steel wires by means of micro electron beam welding, providing good quality weld seams. Due to a very accurate beam alignment and fast beam deflection, the composition and the level of dilution in the weld metal can be precisely controlled, resulting in a significant reduction of fraction of intermetallic phases. The experiments show that it is possible to produce sound welds without the presence of any cracks on the surface as well as in the cross sections.
1 Introduction
Nitinol is a nearly equiatomic alloy, consisting of nickel and titanium. It acts as a shape memory or a superelastic alloy, depending on its exact composition and heat treatment. For medical purposes, there is a high demand for materials with mentioned properties, for example, for small implants like stents or for tools like guide wires or other intravascular interventional devices. Superelastic alloys like SE508 are often applied, taking advantage of the high elastic deformation of up to 8% at a stress level between 400 and 500 MPa [1,2,3].
However, due to numerous contradictory requirements, e.g., regarding superelasticity, deformability, tensile strength, or for cost reasons, it is often necessary to join different materials for specific purposes.
Whenever possible, welding is the process of choice as other joining methods have several drawbacks. Mechanical joining methods like screwing or crimping do not provide for gap-free parts, so that these parts are hard to sterilize and crevice corrosion can occur. Soldering, brazing, or gluing are sometimes problematic because of the missing biocompatibility of alloys, fluxes, and chemicals needed for these processes. In addition, the strength of the joint is much lower as compared to the base material [3].
Beam welding is a promising technology, but many challenges with regard to welding parameters to be selected as well as to process control and their effects on the strength and corrosion resistance prevail. Several research studies have been conducted with a focus on weldability of nitinol [4, 5]. Similar welding, especially laser beam welding, of nitinol is possible, allowing for tensile strengths higher than 800 MPa (or even higher with a post-weld heat treatment). Thus, laser welding is a state of the art in medical technology; however, dissimilar welding of nitinol proved to be extremely challenging, needing further research and analysis with an emphasis on the accuracy and reproducibility of the welding process. It is considered a very challenging welding task with many obstacles to overcome to achieve joints with the required properties regarding strength, ductility, and functionality [4, 5].
In this article, it will be shown that micro electron beam welding is a promising technology for establishing sound welds between nitinol and stainless steel without using a filler material.
2 Material basics
2.1 Nitinol
As already mentioned above, nitinol is a nearly equiatomic intermetallic phase, consisting of titanium and nickel. Nitinol can either be superelastic (SE) or it shows the shape memory effect (SME). Just a little deviation in the alloy composition of a few tenths of a percent in a range from 49 ÷ 51 at −% nickel leads to fundamental differences in terms of material properties. Figure 1 depicts the binary phase diagram of nickel and titanium. Because of the difference in composition, transition temperatures can change significantly—from approximately – 25 °C in the case of superelastic alloys to + 80 °C or even higher, which is the reason for either the SE or the SME behavior [3, 7].
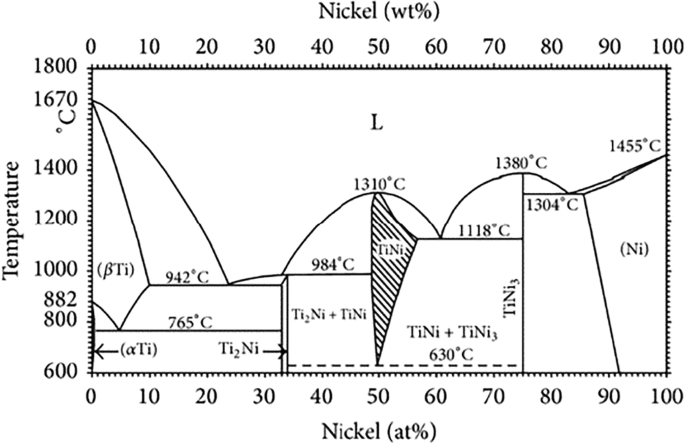
Equilibrium Ti-Ni phase diagram [6]
Table 1 summarizes the characteristics of different nitinol alloys. Figure 2 shows a stress-strain diagram for the commercially available superelastic NiTi alloy SE508.

Stress-strain diagram for nitinol alloy SE508 [9]
The superelastic effect shows a plateau tension at approx. 500 MPa at 20 °C, but it is depending strongly on the temperature. Whereas the stress plateau is at approx. 550 MPa at 30 °C with a maximum superelastic strain of 7%, the stress plateau decreases to 400 MPa at 5 °C with a superelastic strain of max. 6%. At − 30 °C, which is slightly lower than the characteristic transition temperature (load free), the SE effect degrades after one cycle as the material is not superelastic at this temperature (− 30 °C < austenite finish temperature, Af) [10].
In addition to its characteristic smart properties, the corrosion resistance and biocompatibility due to its high titanium content is very good [1]. However, nitinol also has some serious disadvantages: it is very expensive due to the high purity level required, the strict specifications for the actual alloy composition, and the complex thermomechanical processing routes needed to provide for good functional properties. Thus, high-cost and in many cases extremely limited machinability (by conventional milling or similar processes) are major roadblocks towards a widespread industrial application [11, 12].
2.2 Stainless steels
Stainless steels for medical purposes are iron-based alloys containing approx. 18% chromium. Nickel is added to obtain an austenitic microstructure, which provides for different mechanical properties as compared with ferritic or martensitic microstructures, e.g., superior formability. Due to the high chromium content, a thin passive layer protects the surface from corrosion and prevents the release of nickel. Nickel leaching is a problem in medical technology due to possible allergies. Small amounts of elements like titanium or niobium can further increase the corrosion resistance (most importantly in terms of intercrystalline corrosion). Austenitic steels are widely used for medical devices. The main reasons are the good machinability, the low price, the steam sterilizability, as well as sufficient corrosion resistance and biocompatibility. Table 2 shows the properties of two stainless steels, whereas 1.4310 steel is typically used for wires or springs and 1.4404 for machined parts [1, 8].
3 State of the art in beam welding of nitinol to stainless steel
Many challenges prevail considering fusion welding of nitinol and stainless steel without filler. Figure 3 shows an isothermal section from the ternary phase diagram of the complex Fe-Ni-Ti system at 900 °C, where five different types of intermetallic phases with partly ceramic character can be found at. Especially intermetallic phases, which are rich in Fe (Fe2Ti) and Ti (NiTi2), are very brittle and already can promote cracking upon solidification [15, 16]. Therefore, they have to be avoided in the weld material. More information about the phase system can be found in [3] and [17].

Ternary phase diagram of the Fe-Ni-Ti system at 900 °C according to Van Loo et al. [14]
P.C. Hall used a pulsed Nd:YAG laser for butt welding of nitinol to stainless steel wires [18]. He used wires with diameters from 0.019 to 0.025 in. (483 to 584 μm). Without filler material, it was impossible to join the wires (Fig. 4a). By using nickel filler material, the virtually cracked and defect-free weld seams as shown in Fig. 4b were produced. A high energy input is needed to melt the wires’ large width of the weld seam. The ultimate tensile strengths of the specimens welded with nickel filler material were measured between 483 and 586 MPa, so that the general superelastic plateau stress level of the nitinol could be reached in some cases [18].

Cross section of a pulsed Nd:YAG laser weld seam between stainless steel and nitinol wires without filler material (a) and nickel foil used as filler material (b) [18]
Although the tensile strength of the welds made with nickel foil is adequate for some purposes, welded specimens are not suitable for medical applications due to the release of nickel [1].
H. Gugel also used a pulsed Nd:YAG laser for butt welding of nitinol and stainless steel wires with a smaller diameter of 100 μm without filler material. Spot size of the used laser beam was 90 μm. One single pulse was used for welding. In contrast to the experiments performed by Hall, a beam displacement of 85% to the nitinol wire led to weld seams with a good surface quality and only little weld defects in the cross section. The ultimate tensile strength of this weld seam was 625 MPa in average, so that the specimen reached the general superelastic plateau stress level of about 500 MPa [3].
Pouquet et al. found out that solidification cracking can be reduced by producing a weld metal with > 40% Ni or Fe and < 45% Ti, since the Ni3Ti phase is more ductile than other phases. This can be achieved by a precise beam alignment on one of the joining parts [19].
4 Materials and methods
The aim of the experiments in the present study was joining of wires with larger diameters without the usage of nickel-based filler material. For these investigations, the micro electron beam welder SEM108, manufactured by pro-beam AG & Co. KgAA (Gilching, Germany) and JSC Selmi (Sumy, Ukraine) at the Department for Cutting and Joining Manufacturing Processes, was used. The welding machine is based on a scanning electron microscope, which was equipped with a new beam generation head for higher beam currents (up to 20 mA at 60 kV acceleration voltage) and new beam deflection coils for higher maximum deflection speeds. In combination with a high-speed deflection control system, deflection frequencies up to 5 MHz can be attained. It is possible to achieve beam diameters around 30 μm at 1 mA beam current. An oil-free turbopump vacuum system with pressures down to 10−6 mbar provides an almost oxygen- and hydrocarbon-free welding atmosphere. In addition, industrial-type process logic control (PLC) and computerized numerical control (CNC) systems were retrofitted.
Wires with a diameter of 500 μm and a length of 100 mm, made of nitinol SE508 and stainless steel 1.4310 in work-hardened condition (~ 2000 MPa ultimate tensile strength), were used as welding specimens. Glue was employed to fix both wires in a special fixture, so that they were positioned accurately with virtually no gap (in between both wires) for butt welding. A groove at the joining position ensured a free forming of the seam root. Figure 5 depicts a detailed view onto the fixture; Table 3 gives an overview of the used welding parameters. The parameters were chosen based on preliminary studies to allow for welding of the whole wire in one pass in keyhole mode welding without rotating the wires.

Welding fixture with fixed wires (a) and virtually gap-free positioned wires (b)
For reasons mentioned in the state of the art, two parameter sets with displacements on both the nitinol and the stainless steel wire were chosen for the following experiments. In addition, reference welding processes using similar materials were conducted. For tensile testing, a Zwick/Roell Z020 universal testing machine was used. The crosshead displacement was set to 0.5 mm/min. Wires of 50 mm were clamped on both sides, so a free wire length of 100 mm was tested. Nominal strains were calculated from displacement data. Optical microscopy and electron microscopy were used to analyze the microstructural evolution of both welding partners following the welding processes. For optical microscopy, the samples were ground mechanically to 4 μm grit size, mechanically polished with a 0.1-μm colloidal SiO2 polishing suspension and etched with V2A etchant (10 s at 70 °C). Polarized light was used for optical microscopy employing a Leica DM2700. In the case of scanning electron microscopy (SEM), a Philipps CamScan MV 2300 system was employed being equipped with backscattered electron (BSE), energy-dispersive spectroscopy (EDS), and electron backscatter diffraction (EBSD) units. The SEM was operated at 20 kV. The working distance (WD) was set to 35 mm in the case of the EDS measurements and 20 mm in the case of EBSD measurements. Samples were ground mechanically down to 5 μm grit size. For microstructure analysis via EBSD, samples were additionally vibration-polished for 3 h with a 0.02-μm colloidal SiO2 polishing suspension. Hardness measurements were conducted using a KB 30S Vickers hardness measuring system with a force of 0.9807 N (HV 0.1) and a dwell time of 15 s.
5 Results and discussion
Applying the aforementioned parameter sets, it was possible to produce crack-free weld seams for nitinol and 1.4310 steel dissimilar welds. Figure 6a depicts a BSE image of a welded specimen and 6b an optical micrograph. Macroscopically, no defects could be found on the welded surfaces.

Surface of the weld seams: electron-optical image (backscattered electrons) (a) and optical micrograph (b)
In Fig. 7, a welded joint cross section using parameter “1c” from Table 3, which means welding with a beam axis displacement of 150 μm to the steel wire, is shown. Stainless steel is on the right hand side and nitinol on the left hand side. From Fig. 7, the size of the welding zone can be deduced. It ranges from around 400 to 670 microns in the plane of view (it has to be considered that depending on the actual plane analyzed, the overall width of the weld seam may differ by up to 20%).

Cross section of a sample welded with parameter “1c”
Figure 8 depicts EDS elemental mappings for the entire weld zone of a companion sample welded with the parameters mentioned above, revealing the expected characteristic features. The width of the weld seam is slightly different as compared with the cross section in Fig. 7, affected by sample preparation leading to slight differences of the plane of view (as already discussed above). As indicated in the SE image in Fig. 8, the steel is located on the right hand side. Fe, Mn, and Cr are significantly enriched in this region, as can be deduced from each elemental mapping in Fig. 8. On the left hand side, Ni and Ti are significantly enriched and, thus, the pure nitinol wire is present here as indicated in the SE image. In the fusion zone, a fairly good mixture of all probed elements is obvious, with a little exception in the middle of the weld seam.

EDS elemental mapping obtained from the weld zone
In addition to the EDS elemental mappings, in Fig. 9, the results of an EDS line scan analysis are shown. The scan reveals the local evolution of the elements of both welding partners across the entire weld zone. At around 650 microns, the evolution of the line scan reveals an inhomogeneity as the Ti and Ni content rises significantly. From both analysis, i.e., the elemental mappings as well as the line scan, an increase of Ni and Ti becomes obvious between 600 and 700 μm (reference point defined in Fig. 9). This increase indicates an inhomogeneous distribution of the main elements brought in by the nitinol welding partner. All major elements of the steel welding partner are reduced in this region. A possible explanation is that in the middle of the weld seam, i.e., the point of highest welding depth, the lowest heat per unit volume is introduced, and, thus, both the convective flow around the keyhole and the Marangoni flow are less pronounced, eventually resulting in less intensive mixing of the elements. Further details may be derived from an additional consideration of the microstructural evolution in the weld zone as will be considered in the following.

SE image of the weld zone (a) and EDS line scan obtained from the weld zone (b)
From the EBSD inverse pole figure map (Fig. 10a) and the phase map (Fig. 10b), two main aspects can be deduced. First, the grain size in the weld zone seems to be significantly enlarged as compared with the base material on the right and left sides of the weld seam. This can be seen on the right hand side in Fig. 10b, indicated by white arrows. Furthermore, grain growth seems to be even more pronounced on the Ni and Ti rich side (left hand side), as the grain appears more globular compared with the microstructure in the weld zone area near the steel (right hand side). Thus, second, on the Fe, Cr, and Mn rich side (right), grain growth seems to occur in a different manner (marked with a white oval) compared with the Ti and Ni rich side. In direct comparison with the EDS mappings in Fig. 8, the chemical inhomogeneity in the middle of the weld zone, i.e., the partial enrichment in Ni and Ti, seems to be linked to a change in local solidification. This can be deduced from the EBSD result, focusing on regions to the left and to the right from the center of Fig. 10. Differences in the locally prevailing solidification modes, i.e., columnar vs. equiaxed, may be related to the different thermo-physical properties of austenitic Ni-Ti and austenitic steel. Due to the differences in thermal conductivity and thermal capacity and slight differences in chemical composition, epitaxial growth seems to be promoted locally (Fig. 10).

EBSD analysis of the weld zone of parameter 1c. Inverse pole figure map in TD direction (a) and phase map (b). In both cases, image quality (IQ) is superimposed
In addition to the microscopic analysis, microhardness tests were conducted on the samples. Figure 11 shows an exemplary microhardness profile of a sample welded with parameter set “1b.” The hardness measurements reveal a significant increase in hardness throughout the weld zone, i.e., on both the 1.4310 and nitinol sides. It is supposed that the formation of very fine intermetallic phases dispersed in the entire welding zone may have a significant impact on the hardness, since it is more than twice as high as in the base materials. All samples show similar values in the case of hardness following welding; however, the gradients, especially on the nitinol side, are very high and seem to be somehow affected by the actual welding parameters.

Microhardness tests on sample welded applying parameter set “1b”
All welded samples were mechanically tested focusing on the ultimate tensile strength (UTS). The results are shown in Fig. 12. In general, the UTS of samples welded with a beam displacement to the stainless steel joining partner (parameter set 1a–1d) show higher UTS values as compared with samples with a beam displacement to the nitinol side (parameter set 2a–2e). Specimens welded with a beam alignment on the steel side of 0.15 mm (“1b”) and 0.2 mm (“1c”) show the highest UTS. These two samples reached the superelastic stress level defined up to about 550 MPa. Nevertheless, none of the samples showed any superelastic stress plateau, which is a characteristic feature of nitinol (Fig. 13).

Ultimate tensile strength (UTS) of welded samples (red line shows the superelastic plateau strength of the nitinol material used)

Stress-strain diagram of welded reference materials and a dissimilar welded sample using parameter set “1c”
Figure 13 shows the stress-strain diagrams of reference weldings in similar materials, i.e., upon nitinol-nitinol and 1.4310-1.4310 welding (Fig. 13a), and an exemplary curve for a dissimilar weld (nitinol-1.4310) using parameter set “1c” (Fig. 13b), since the highest ultimate strength was found for this condition (Fig. 12). The joints of the similar materials show obviously plastic deformation before failure. Especially in the case of the Ni-Ti–Ni-Ti welded wire, the characteristic stress plateau is seen in the welded condition (at a stress level of about 530 MPa), providing for strain at failure > 7%. For the 1.4310, only minor plastic deformation can be seen before failure and the UTS of the initial condition is not met. This behavior can be rationalized based on the initial condition itself and the local effects of welding. The initial wire is characterized by very high UTS due to the fact that it has been supplied in work-hardened condition. As can be derived from microhardness tests and further microstructure characterization (not shown for brevity), all microstructural features stemming from cold work are vanished. Furthermore, significant grain growth is seen. Thus, during tensile testing, all deformation is localized in the narrow weld zone, which is significantly lower in strength as compared with the surrounding as-received high-strength wire. This localization of deformation and damage within a very limited volume of the overall wire sample tested leads to both a decrease in strength as well as elongation at failure (Fig. 13a).
Upon dissimilar welding of nitinol and 1.4310, premature brittle fracture occurred in the elastic regime at the stress level, where the onset of the superelastic plateau would have been expected (Fig. 13b). Since the microstructural evolution of the Ni-Ti–Ni-Ti welded reference seems not to be detrimental in the case of tensile loading (as can be deduced from Fig. 13a), i.e., stress-induced martensitic transformation sets in slightly above 500 MPa, further aspects need to be taken into account here. The premature fracture of the sample welded with the parameter set “1c” may be attributed to two aspects: the characteristic microstructure revealed by EDS and EBSD maps (cf. Figs. 8, 9, and 10) and intermetallic phases that formed upon dissimilar welding of nitinol and steel. Obviously, the evolution of microhardness contradicts the grain growth seen, since a smaller grain size is supposed to be characterized by higher hardness values. The increased hardness in the weld zone and, thus, the increase of the overall material strength and brittleness, respectively, are an important factor for assessing the dominant fracture mechanism. The overall increase in hardness only can be rationalized by the formation of intermetallic phases (Fe2Ti and NiTi2), which have been numerously reported in literature, e.g., in [16,17,18,19]. It needs to be pointed out that the local hardness scattering seen in Fig. 11 is supposed to be related to the individual grains featuring a different orientation (grains in the weld seam are in some areas larger than the size of the hardness indents). Analysis of fractured samples revealed that general differences seen in the UTS values for “type 1” and “type 2” samples can be correlated to the individual failure sites. In “type 2” samples, failure is seen at different locations within the weld seam while in the case of “type 1” samples, failure is always seen at the boundary layer between the weld seam and the nitinol wire (Fig. 14). As the “type 1” samples, where beam offset is on the stainless steel, showed higher UTS, the focus of analysis was on these samples. Values obtained indicate that the onset level of martensitic transformation in the nitinol wire leads to immediate failure of the welded structure. As analysis of local strain evolution was beyond the scope of present work, future tests will have to substantiate the following assumption: the weld seam represents a microstructural notch. Such kind of microstructural notch leads to a local increase of stress and, thus, eventually to the onset of martensitic transformation in this area. Due to the steep gradients in hardness and the presence of embrittling intermetallic phases as well as strain incompatibilities due to the non-optimized gradient, premature failure sets in immediately. In the stress-strain curve, however, no traces of initial transformation can be derived as transformation only affects a very small volume of the entire wire. Analysis by means of digital image correlation (DIC) to be conducted in follow-up work and will further shed light on the prevailing deformation and damage mechanisms.

Sample of “type 1,” failed at the boundary layer between nitinol and the weld material (left). Sample of “type 2”, failed in the weld material (right)
6 Conclusions
The present results clearly reveal that it is possible to use the micro electron beam technology to join nitinol to stainless steel wires with a diameter of 0.5 mm, avoiding any process-induced cracks. The strength values determined are very similar to values obtained by laser welding using nickel filler material, where the related nickel release, however, is a detrimental factor hindering any use in medical applications.
In the present study, the majority of specimens failed at the interface between the weld seam and nitinol upon tensile testing. The reasons are strain and damage localization, promoted by welding-induced changes of microstructure in combination with evolution of brittle intermetallic phases. These characteristic changes eventually lead to gradients in hardness in the weld seam and to pronounced differences in local deformation behavior across the whole wire. A beam offset to the nitinol wire, which provided for superior properties upon laser welding of wires with a smaller diameter, does not lead to improved performance upon electron beam welding. Welding parameters such as beam power, feed rate, and beam offset influence the strength of the weld more effectively than rapid beam deflection. In general, a lower heat input results in better strength values. Upon further research in this field, micro electron beam welding seems to be a promising approach for production of medical devices made from nitinol and steels with higher weld quality.
References
Wintermantel E (ed) (2009) Medizintechnik. Life science engineering; Interdisziplinarität, Biokompatibilität, Technologien, Implantate, Diagnostik, Werkstoffe, Zertifizierung, Business, 5th edn. Springer, Berlin
Duerig T, Pelton A, Stöckel D (1999) An overview of nitinol medical applications. Mater Sci Eng A 273-275:149–160
Gugel H (2011) Laserschweißen artgleicher und artfremder Materialkombinationen mit Nickel-Titan Formgedächtnislegierungen. Dissertation, Ruhr-Universität Bochum
Deepan Bharathi Kannan T, Ramesh T, Sathiya P (2016) A review of Ssimilar and dissimilar micro-joining of nitinol. JOM 68:1227–1245. https://doi.org/10.1007/s11837-016-1836-y
Mehrshad Mehrpouya AG, Mohammad E (2018) Laser welding of NiTi shape memory alloy: a review. J Manuf Process 31):162–186. https://doi.org/10.1016/j.jmapro.2017.11.011
Massalski TB, Okamoto H, Subramanian PR, Kacprzak L (1990) Binary alloy phase diagrams, vol. 3, ASM International, 2nd edn, Materials Park, Ohio
Kaack M (2002) Elastische Eigenschaften von NiTi Formgedächtnis-Legierungen. Dissertation, Ruhr-Universität Bochum
Zuckschwerdt K, Roos E, Greitmann MJ et al (2001) Schweißen von NiTi-Formgedächtnislegierungen mit hochlegierten Stählen. DVS-Berichte 216:21–24
Johe R (2009) Tensile testing of nitinol tubes and wires with higher strain rates. JMEPEG 18:836–842
Youn SH, Jang YS, Han JH (2011) Development of a three-axis hybrid mesh isolator using the pseudoelasticity of a shape memory alloy. Smart Mater Struct 20(7):75017
Haider W, Munroe N (2011) Assessment of corrosion resistance and metal ion leaching of Nitinol Alloys. J Mater Eng Perform 20(4):812–815
Weinert K, Petzoldt V (2004) Machining of NiTi based shape memory alloys. Mater Sci Eng A 378(1-2):180–184
Deutsche Edelstahlwerke GmbH (2015) Werkstoffdatenblatt 1.4404, Witten
Deutsche Edelstahlwerke GmbH (2016) Werkstoffdatenblatt 1.4310, Witten
Vannod J (2011) Laser welding of nickel-titanium and stainless steel wires: processing, metallurgy and properties. Dissertation, École Polytechnique Féderale de Lausanne
Wang G (1997) Welding of nitinol to stainless steel. Proceedings of the Second International Conference on Shape Memory and Superelastic Technologies, 131–136
Cacciamani G, de Keyzer J, Ferro R, Klotz UE, Lacaze J, Wollants P (2006) Critical evaluation of the Fe–Ni, Fe–Ti and Fe–Ni–Ti alloy systems. Intermetallics 14(10-11):1312–1325
Hall PC (2004) Laser welding nitinol to stainless steel. In: Pelton AR, Duerig TW (eds.) SMST-2003. Proceedings of the International Conference on Shape Memory and Superelastic Technologies, 219–228
Pouquet J, Miranda RM, Quintino L, Williams S (2012) Dissimilar Laser welding of NiTi to stainless steel. Int J Adv Manuf Technol 61:205–212
Acknowledgments and funding
Open Access funding enabled and organized by Projekt DEAL. The Department for Cutting and Joining Manufacturing Processes, University of Kassel (tff), the Natural and Medical Sciences Institute, University of Tubingen (NMI), and the Institute of Materials Engineering, University of Kassel (IfW), would like to thank the accompanying committee for their excellent support. The research project (AiF-No. 19.282N) of the DVS e.V. was funded through the program for the promotion of the “Industrial Community Research (IGF)” by the Federal Ministry of Economic Affairs and Energy through the AiF. This assistance is gratefully acknowledged. T. Niendorf acknowledges financial support by Deutsche Forschungsgemeinschaft (project No. 398899207).
Author information
Authors and Affiliations
Corresponding author
Additional information
Publisher’s note
Springer Nature remains neutral with regard to jurisdictional claims in published maps and institutional affiliations.
Recommended for publication by Commission IV - Power Beam Processes
Rights and permissions
Open Access This article is licensed under a Creative Commons Attribution 4.0 International License, which permits use, sharing, adaptation, distribution and reproduction in any medium or format, as long as you give appropriate credit to the original author(s) and the source, provide a link to the Creative Commons licence, and indicate if changes were made. The images or other third party material in this article are included in the article's Creative Commons licence, unless indicated otherwise in a credit line to the material. If material is not included in the article's Creative Commons licence and your intended use is not permitted by statutory regulation or exceeds the permitted use, you will need to obtain permission directly from the copyright holder. To view a copy of this licence, visit http://creativecommons.org/licenses/by/4.0/.
About this article

Cite this article
Hellberg, S., Hummel, J., Krooß, P. et al. Microstructural and mechanical properties of dissimilar nitinol and stainless steel wire joints produced by micro electron beam welding without filler material. Weld World 64, 2159–2168 (2020). https://doi.org/10.1007/s40194-020-00991-3
Received:
Accepted:
Published:
Issue Date:
DOI: https://doi.org/10.1007/s40194-020-00991-3