
Abstract
With ambitious renewable energy capacity addition targets, there is an ongoing transformation in the Indian power system. This paper discusses the various applications of variable generation forecast, state-of-the-art solar PV generation forecasting methods, latest developments in generation forecasting regulations and infrastructure, and the new challenges introduced by VRE generation. Day-ahead NWP-based GHI forecasting are validated against ground measurements from single and multiple sites in India. Recommendations for improving overall the forecasting infrastructure in India are presented.
Introduction
Power produced from solar and wind resource-based generators is variable in nature. The inherent uncertainty and variability in solar radiation and wind speed resource cause fluctuations in power generation from these resources. When the share of such VRE becomes significant, various stakeholders’ face several new challenges in managing and operating an electrical power system efficiently, e.g. complexity in load-generation balancing within a control area [64]. Power forecasting is one key tool in this regard, which directly supports in better operation and management of electric network [100]. Generation forecasts can be at various spatial aggregation levels like control area-level aggregated forecasts, useful for net load forecasting, reserve dimensioning, ramp management, uncertainty handling, etc. [9, 10, 27, 91, 92, 112], whereas site-specific or nodal/pooling transformer station-level aggregated forecasts are useful for bidding in power exchange or ancillary service market, congestion management, reactive power support potential forecast, etc. [53, 64, 76, 85, 129, 129]. Generation forecasts can also be for various forecast horizons, minutes-ahead, hours-ahead, day-ahead, or longer-term basis [20, 73, 83]. Generation forecast has usage not only for TSO, but also for DSO in the domain of active distribution networks [46, 114. The appropriateness of the generation forecast method and input data source depends on the forecast lead time and resolution suitable for the particular application. Very short-term forecasts of the order of minutes ahead at a high temporal resolution can be obtained from machine learning [99, 106] and sky imager-based predictions [74, 128]. Machine learning techniques such as ANN, SVR, ([37, 38, 39,40,42], fuzzy logic, and wavelet approach [37,38,39,40, 42,43,44,45] have already been successfully applied in various fields. Various configurations of sky imagers have also been reported in the literature for solar irradiance applications [30, 88]. Satellite image-based forecasts are suitable for the forecast lead time of 30 min to 4 h ahead, and has been widely applied [50, 58]. However, NWP-based forecasts provide the most reliable predictions at the day-ahead stage [79]. In India, the concept of VRE forecasting has been introduced for some time and is undergoing the initial evolution phase. This paper focuses on solar power forecasting and aims at, after briefly reviewing the applications of VRE forecasting and the methods to generate this forecast, documenting the recent evolution of solar power forecasting in the scope of Indian power system and other power systems of various countries, facing similar challenges in grid integration of solar PV and wind resources.
This article is a combination of review analysis and original research efforts, and makes the following contributions, (i) It reviews the applications of generation forecasts in various decision-making processes relevant to the stakeholders in electric power system and the ongoing developments in generation forecasting regulations and infrastructure in various power systems, including the Indian power system, (ii) it reviews the various forecasting techniques and points out potential applications, feasible within the regulatory infrastructure, (iii) it presents a case study of single-site forecasting as well as aggregated forecasting for the State of Rajasthan in India, based on ECMWF NWP model output, (iv) finally, it discusses scope for further improving forecasting activities in India.
Review of forecasting applications and solar PV generation forecasting methods
Solar PV power generation introduces variability into the electricity grid. The output from such generation units have a maximum generation limit that varies throughout the day even when it is accurately predictable (under clear sky) and this characteristic of solar PV output is referred to as its temporal variability. However, even the maximum generation limit is not always known with reliability, and this aspect is referred to as its uncertainty [34]. This situation could arise due to the presence of cloud structures or change in aerosol content, which enhances the spatial variability of irradiance and consequently results in the deviation of the actual solar PV power output predicted from the prediction. Solar PV power forecasting finds utility in various applications such as, UC and ED, reserve setting, residual load forecast, congestion management, active distribution network management, and VPP operation. Solar PV power output forecasts of different spatio-temporal resolutions are broadly speaking, necessary for the following stakeholders, (i) TSO (ii) Plant owner/ operator (ii) VPP operator or trader or aggregator and (iv) DSO.
Relevance of generation forecast to different stakeholders in the electricity industry
For a power system in which power generation from RE has priority feed-in, estimating the residual or net load forecast is important for the TSO. In order to generate net load forecast, control area-level aggregate generation forecast is necessary. Residual or net load forecast can be used by the TSO to schedule the dispatchable generators in order to supply the net load. It is also useful for ascertaining that sufficient ramping capability is available to compensate for the ramps in net load. The uncertainty information associated with net load can be used as an input into reserve requirement estimation [96]. Nodal (pooling station level) forecasts are useful to the TSOs for both intra- and inter-control area congestion forecast and management [57]. Power markets are also affected by network bottlenecks and hence can utilize nodal forecast information [7] for cases where power markets set nodal energy prices [63, 87]. Individual power plant-level generation forecast and its associated uncertainty can be of use to the TSO, in cases where gross pool mechanism [47] is followed or mandated by regulation, for scheduling the generators.
Steep ramps in solar PV plant power output during morning and evening times can lead to increased cycling of the dispatchable generation units, and put more stress on the power system [89]. Flexibility is necessary in order to deal with power ramps, and the requirement of flexibility also needs to be inferred from ramp forecasts or ramp alerts [86]. Many authors have described a trinity of metrics, namely, ramp rate, ramp magnitude and energy, for quantifying the ramp in power from VRE units [123].
Plant-level PV generation forecast information is useful to the plant operator for scheduling the expected generation with the grid operator. For solar PV plants participating in day-ahead power market, day-ahead generation forecast is a vital source of information for placing bids [129]. Intra-day or imbalance markets provide opportunity to the solar PV plant operators or their traders to revise their bids based on updated and more accurate intra-day forecasts [64]. Apart from single-valued deterministic forecast, forecast uncertainty information can be utilized to optimize the bids for power in the day-ahead and intra-day markets. This is especially the case when differential penalties are applied for over and under generation [23, 129].
VRE units, such as solar PV, are increasingly being expected to provide ancillary services to the grid operator, similar to conventional generating units. The ability of solar PV plants to provide ancillary services has already been documented in literature [29, 80] and demonstrated in field test [85]. Wind turbines are already being used for providing negative tertiary reserve. The role of accurate generation forecast and its uncertainty information is crucial here [53].
VPP is an aggregator of generation units, and in certain cases load entities as well. According to [107], “a VPP aggregates the capacity of many diverse DERs, creates a single operating profile from the composites of the parameters characterizing each DER and incorporates the impact of the network on aggregate DER output. A VPP is a flexible representation of a portfolio of DER that can be used to make contracts in the whole-sale market and to offer services to the system operator”. [105] defined VPP as “a portfolio of DERs, which are connected by a control system based on information and communication technology. The VPP acts as a single visible entity in the power system, is always grid-tied and can be either static or dynamic”. Individual and aggregate forecast information is necessary for VPPs to provide optimal bids in power markets, as well as for providing ancillary services to the grid operator [56, 72, 109].
Historically, distribution system has played a passive role, functioning only as the interface for the transfer of power from transmission network to end-consumers. However, with the addition of numerous distributed generators such as grid connected rooftop PV to the medium- and low-voltage distribution grid, passive operation is no longer possible. This can in turn pose barriers to the secure and economic operation of the distribution grid [46]. There is an ever-growing need for an intermediate entity between the TSO and the DERs, due to the limited visibility and control of TSO over these resources. Two primary roles that this entity (called DSO) is expected to fulfill are: (i) operator of the distribution grid and (ii) Facilitator of market access to DERs [5]. One of the main challenges is to develop suitable tools and systems, which would allow DSOs to make informed decisions based on data from various sources [60], including generation forecasts, in order to fulfil their various roles. Voltage and current limitations also act as obstacles to the distribution grid’s PV hosting capacity and is the primary cause of overvoltage during high solar PV generation at noon-time [120]. As can be seen in the relevant literature [1, 15, 67, 118], several authors are of the opinion that DSOs need to start scheduling their system (including demand, generation and storage), and also manage voltage and power flow violations with the help of available resources like OLTCs, advanced inverter control techniques, capacitor banks, etc. However, for all these cases, generation forecast is the basic building block based on which the operational planning is done.
Solar PV generation forecasting techniques
Solar PV power forecasting comprises of several steps which convert NWP output, satellite images, real-time online measured data or sky images into a forecast product, by utilizing various models. The initial set of steps for deriving the forecasted surface GHI depends on the source of data and the required spatio-temporal resolution. Further steps are necessary for producing the final AC power forecast as shown in Fig. 1. The measured data of GHI and AC power output are often used for site-adaptation in order to enhance the accuracy of the prediction in real operating systems. Brief descriptions of the different solar irradiance forecasting, forecast combination, and up-scaling techniques are provided in the following subsections.
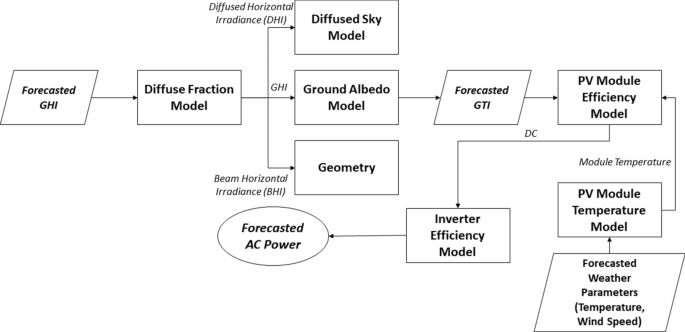
Simplistic steps involved in deriving AC power generation forecast from forecasted GHI at the surface
Solar irradiance forecasting techniques
GHI forecasts may be generated, depending on the forecast horizon, by several methods. NWP model output, satellite image-based CMV, and statistical or machine learning methods are used worldwide commercially for generating forecasts. Application of CMV methods on images captured by ground-based cameras for sub-hourly forecasting at high spatio-temporal resolution has shown promising results [19, 103, 115, 117, 124]. Figure 2 compares the spatio-temporal horizon of different solar PV forecasting techniques.
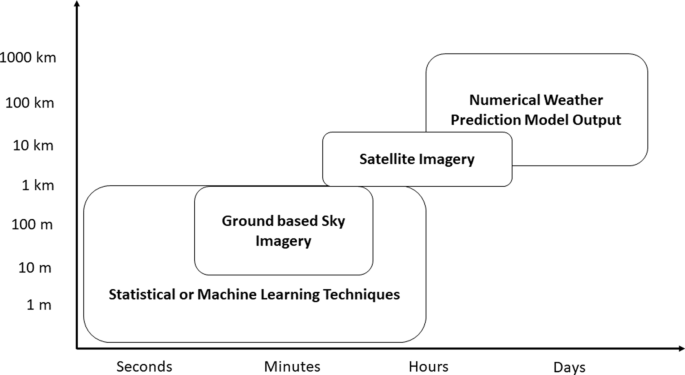
Different solar PV forecasting methodologies and their spatio-temporal horizon [13]
NWP-based solar power forecast is the only physics-based technique available for generating day-ahead to days-ahead forecast at present. NWP models predict the future state of the atmosphere by numerically solving physical equations based on initial conditions obtained through data assimilation [77]. Model runs are initiated 2–4 times a day (0, 6, 12, and 18 UTC) [103]. Further post-processing of NWP model GHI is necessary in order to obtain data at the required temporal resolution and removing systematic errors or biases [22]. Spatial averaging over a predetermined optimum number of grid points is also done to improve accuracy [84, 90, 102, 126, 127]. Figure 3 shows the general scheme for temporal interpolation.
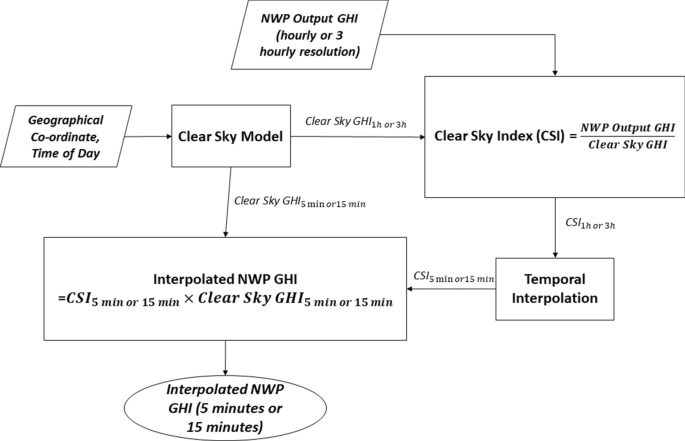
Temporal interpolation of NWP model GHI to higher resolution
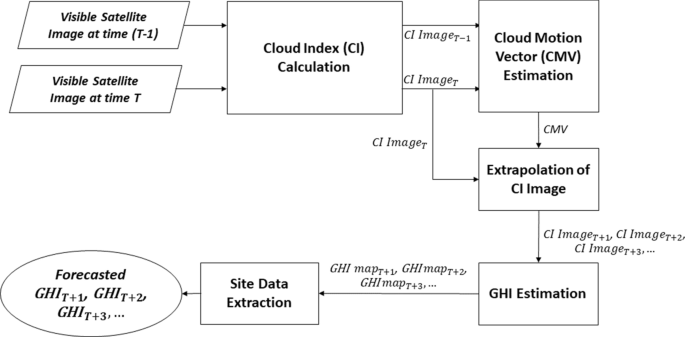
Satellite image-based CMV methods and machine learning methods are currently used on an operational basis worldwide for producing intra-day irradiation and generation forecasts. Some of the main steps in satellite image-based solar PV generation forecasting have been shown in Fig. 4.
Machine learning based methods “learn” from past datasets, and then generate irradiance forecast using the trained models. There are numerous articles already existing in the literature on different “learning techniques” [93, 101, 116, 125] of which the simplest model is persistence. Advanced models, e.g. ANN, SVM, can use additional parameters such as sky or cloud image, relevant NWP output parameters, and measured meteorological parameters [21, 108]. Times series models can also be used to forecast solar PV power output, as shown in [78] and [119]. In general, machine learning is mostly preferred when information about the underlying PV system, such as tilt orientation and technology, is not available [126, 127].
Combination techniques for irradiance and PV power forecasts
Combining the results of different forecast models can improve the overall accuracy, if the errors of the different forecast models are to a certain extent uncorrelated. Combination methodologies vary from simple linear combination to more advanced statistical methods which use optimized weights for the individual forecasts considering their historical performance [8, 24, 26, 35]. When the outputs of different forecasting techniques suitable for different forecast horizons are statistically combined, then the weights are also of a time-varying nature, depending on the lead time [73].
Up-scaling of regional PV power forecast
The errors for control area-level aggregated forecasts are significantly lower than single-point forecasts [2, 81, 104, 113]. The error reduction percentage depends on climate diversity and PV system distribution within the region [73]. In [83], the authors found that rRMSE for an ensemble of 77 PV systems was less (4.6%), when compared to single-site solar PV generation forecast (8.5%).
It is not feasible to retrieve accurate data of each and every PV installation in a power system, and so a representative set of solar PV units are selected. The quality of up-scaling depends on the proper choice of representative systems. Further set of necessary information include the spatial distribution of nominal PV power, different module technologies, and the geometric orientation of the PV systems in the region [84]. Module orientation information for distributed solar PV units can be obtained from GIS data [68].
Forecast accuracy increases with larger number of reference power plants. However, beyond a certain percentage of reference plants, the advantage of increase in accuracy is negligible. The error in up-scaling is low when the configuration of the reference plants and test plants is similar [113].
Development of VRE generation forecasting infrastructure and forecasting applications
Over time, there have been broadly two approaches towards VRE generation forecast information and its utilization in electrical power system: (a) Centralized aggregated forecast at the system operator level and (b) Site-specific forecast for individual generator or groups of generators. Often these two approaches are found to coexist in power systems, with each serving the requirements of different specific stakeholders. This section discusses the regulatory and operational reforms introduced in some power systems for handling the intermittent resource characteristic of VRE sources like solar irradiation and wind speed. It then provides a brief review of various established generation forecasting infrastructures. Finally, in the light of these discussions, possible operational/regulatory adaptations and improvisations in the Indian power system are discussed.
Regulatory interventions in VRE generation forecasting
In order to better handle the intermittency of VRE generation, while allowing its economic and secure integration, regulatory reforms have been introduced from time to time in different power systems. In Germany, the EEG act accords priority dispatch to renewable generation and makes the TSO responsible for selling power from price-taking VRE generators at the energy exchange, who are then paid under the FIT scheme. Aggregate control area-level VRE generation forecasts are utilized by TSOs for grid security assessment and aggregate VRE generation bidding at the exchange. The imbalance costs of such VRE generators are borne by the TSOs. “Price-making” VRE generators on the other hand participate in the energy exchange like any other entity and require site-specific generation forecasts. They are themselves responsible for generation forecasting and settlement of imbalances [36]. The Spanish Royal Decree RD 436/2004 introduced mandatory generation forecast for special regime RES-E generators or VRE generators, of installed capacity equal to or greater than 10 MW. This limit was further reduced by subsequent regulations. At the same time, the Spanish TSO REE also produces its own aggregate generation forecast for the Spanish electricity grid [62]. Furthermore, all VRE generators of capacity greater than 10 MW need to be connected to a centralized control centre as a necessary requirement for obtaining FIT or market premium. RD 1565/2010 has also included clusters of VRE generators connected to the same evacuation line of combined capacity greater than or equal to 10 MW within the ambit of the central control centre [32]. FERC Order 764 enabled VRE generators in USA to better manage their imbalances by introducing sub-hourly scheduling. It also allows TSOs to access sub-hourly forecast-relevant data of VRE generators for the purpose of producing power production forecasts [18, 95]. The AEMO has installed a solar power forecasting system called ASEFS under a project funded by ARENA. This was deemed essential for assisting with the operation of accurate supply and demand forecast models to increase commercial viability and ensure grid stability, in view of the large penetration of solar PV into the grid [6]. The need for forecasting and scheduling of VRE generators in the Indian context was first emphasized by CERC in 2010 through the IEGC [17], and then subsequently by other SERCs and FOR, who introduced similar regulations [4, 49, 51, 66]. The concept of QCA as an aggregator of VRE units connected to a pooling station as well as aggregator of multiple such pooling stations has also been introduced by FOR model regulations and other SERC regulations. A detailed analysis and inter-comparison of various aspects of the different regulations related to forecasting are included in Table 1. Recently, FOR has come up with a proposal of introducing a 5-min resolution scheduling interval in the Indian power system for higher granularity and improved ramp management [48].
Recent developments of centralized forecasting infrastructure in Spain, Ireland, Germany, and India
CECRE
CECRE was set up by the Spanish TSO REE for the purpose of coordinating the operation of VRE generators with the operation of other generators, transmission, and distribution system. The principal function of CECRE is to relay real-time VRE generation information to the TSO. Generators larger than a threshold capacity can also receive down-regulation signal to restore system balance or relieve congestion [32]. SIPREOLICO and SIPRESOLAR are the short-term statistical solar and wind production forecast generating tools of REE, respectively, which are used by them for scheduling reserve, identifying potential congestion issues, and monitoring system security [3, 61].
WSAT
WSAT is a tool introduced by the Irish TSO EirGrid for calculating the SWL on the system by assessing power system stability with network modelling and simulation [31]. Aggregate system-wide wind forecasting is a part of one group of processes related to forecasting, which are performed by the TSO, for the purpose of scheduling. Forecasts are used are obtained from two external providers via the WEF system [33].
Balancing groups in Germany
VRE generators that sell their energy for a fixed price in the energy exchange, referred to as price-taking generators, constitute a distinct balancing group, and TSOs are responsible for compensating imbalances [36]. Thus, TSOs employ the services of FSPs and obtain VRE generation forecasts from them, in their effort to accurately predict and bid the volume of energy in the EPEX spot exchange market. Some TSOs also use a combination tool, which produces an optimal forecast by a combination of products from multiple FSPs [61]. Apart from this, aggregate TSO control area-level forecasts are also used for grid security management.
REMC
REMC was conceptualized due to the need of an entity that would be able to generate control area-level aggregate VRE generation forecast in order to assist LDCs in calculating net load forecasts and managing grid security, which is quite different from the site-specific forecasts mandated by forecasting and scheduling regulations for scheduling and accounting. Apart from this, REMCs are also envisaged to act as the hub for all information regarding RE power generation in its area of responsibility, at the SLDC, RLDC or NLDC level, and are proposed to be co-located with the existing LDCs [54, 97]. The conceptual architecture of an REMC (at state or regional level) with logical interconnectivity is shown in Fig. 5. Regional and state REMC’s would be equipped with forecasting and scheduling tools and real-time monitoring of RE generation. The REMC at NLDC will have a forecasting and scheduling aggregator tool. This aggregator tool will receive forecasted data. The conceptual architecture of the REMC located in NLDC with logical interconnectivity is shown in Fig. 6. The foremost purpose of the forecasting tool is to predict the output from solar and wind generators accurately and provide the information to the system operator for ensuring smooth grid operations and enhanced system security. A schematic diagram of the forecasting tool is shown in Fig. 7, while Fig. 8 shows a schematic diagram of the forecasting and scheduling aggregator tool.

Scheme of logical interconnectivity between various software modules in an REMC

Scheme of logical interconnectivity between various software modules in national REMC

Schematic architecture of a forecasting tool

Schematic architecture of a forecasting and scheduling aggregator tool
Potential applications of generation forecast in Indian power system
Many of the SERCs have made it mandatory for all solar PV plants (with a capacity of 1/5/10 MW or above) to provide generation forecasts on a day-ahead basis to the SLDC. These regulations also allow a fixed number of intra-day revision or updates based on the latest forecasts. In particular, the requirements here are for day-ahead site-specific forecast, which can be obtained from NWP sources, and intra-day site-specific forecast, which can be generated by applying CMV to satellite images. Persistence or advanced machine learning based methods can also be used for very short-term forecast. Sky image-based methods are still at a research stage, and moreover, the use of sky imaging system for solar forecast may not be currently very useful for the Indian power system, as the minimum update interval in most of the states is 1.5 h, while the sky imaging technique can only predict for 20 to 30 minutes in the future. As per the regulations [4, 49, 66], these site-specific forecasts, different from the forecasts generated by REMCs, are provided to the SLDC for setting the schedule and consequently for determining the deviation charges.
The proposed REMCs are tasked with providing the SLDC with aggregated variable RE forecasts, which would be beneficial for the overall management of the electricity grid. The requirement here is of spatially aggregated forecast at the pooling station, state and even regional level. Such forecasts can be obtained by applying up-scaling techniques to a representative set of site-specific forecasts. State- or regional-level forecasts can find application in residual load forecasting, which would then enable state or regional LDCs to schedule the dispatchable generators for supplying the residual load. The ramps in residual load, due to the diurnal pattern of solar PV generation, can also give information on the ramping capability required from the dispatchable generators. It has been shown that VRE intermittency primarily affects the need for tertiary reserve (RRAS as per Indian power system) and not primary reserve (FGMO) [28, 70]. Thus in future, the uncertainty information associated with residual load forecast can be utilized for setting the RRAS requirement. On the other hand, nodal or pooling station-level forecasts can find application in congestion forecast and management, particularly for inter-state and inter-regional tie-lines. Load flow calculations, using nodal-level load and generation forecasts, can be employed to determine the ATC of critical transmission segments. Uncertainty information associated with nodal-level generation forecast, can also be used in future for congestion management and scheduling, as has been shown by several authors [76, 71, 59]. QCA, which has been introduced by many of the Indian states, can utilize nodal or pooling station-level aggregate forecasts for providing generation schedules to the SLDC.
According to the CEA, a distributed generator is a generating station that feeds electricity at a voltage of 33 kV or below into the electricity grid [16]. Many SERCs have already brought out draft regulations or final regulations on rooftop solar PV systems and net metering [116,117,118,119,121]. Karnataka so far allows the highest penetration of solar PV up to 80% capacity of the distribution transformer level. Increase in penetration of roof-top solar PV alters the shape of the load duck curve, during the day time in particular, and thus affects the load demand scheduled by the DISCOM. To tackle this, DISCOM control centres can utilize the aggregate forecast of roof-top and distributed PV systems connected to the distribution grid. However, module information and dynamic generation data of all the solar PV units may not be available to the DISCOM directly, due to the sheer number and the spatial distribution of the units. Different up-scaling techniques can be used in such situations to obtain the aggregate output, as shown in [68, 109,110,111] . Apart from this, large number of distributed solar PV plants connected to the HT and LT levels (11 and 0.4 kV) can cause spike in voltage along the feeder line, at the coupling points with the grid. In the distribution grid, active power generated by solar PV influences the voltage at the coupling point with the feeder. However, transformer with OLTC is typically only available till EHT voltage levels (33 or 66 kV) [55]. Even then, very frequent switching of the OLTC leads to wear and tear, which is also undesirable. Several methods are available in literature which show how to utilize nodal aggregated forecasts for minimizing the switching operation, while at the same time maintaining voltage limits on the different feeders [15, 114]. Some works have also proposed active power curtailment strategy for voltage regulation by utilizing solar PV generation forecasts.
Many of the applications discussed here are already used in operation internationally, and therefore in theory can also be implemented in the Indian system. Based on Table 2, a summary of the possible applications of generation forecast suggested in this section is presented along with the forecasting methods employed, its spatio-temporal resolution, and the intended end-user. However, the details for removing barriers to their implementation need further detailed investigation.
Experiment with day-ahead solar resource forecasting in Rajasthan, India
The existing practices and procedures adopted worldwide for solar power forecasting have been discussed. This section evaluates first approaches of a day-ahead solar power forecasting scheme in Rajasthan.
Selection of NWP Model, ground measured irradiance datasets for solar resource forecasting
A comparative analysis of several NWP models [90] has shown that the ECMWF NWP model provides rather accurate forecast with the least uncertainty. Again, the global NWP model from ECMWF has the finest grid resolution among all the existing global NWP models. Hence for this work, the NWP model solar and cloud parameter data sets with a resolution of 0.125° × 0.125° were obtained from ECMWF for the area of the state Rajasthan. The temporal resolution of data points obtained was 3 h with a forecast horizon of 72 h.
For the investigation and the evaluation of irradiance forecasts, solar irradiance data sets were obtained from 10 SRRA stations in Rajasthan measured during the period 1 January 2014 to 31 December 2014. The distribution of these stations in Rajasthan is shown in Fig. 9.

Locations of the SRRA stations in Rajasthan used for evaluation
Evaluation of Irradiance forecast for Rajasthan from NWP model datasets
The forecasts are to be evaluated for point locations or single sites and for an ensemble of sites with SRRA stations in Rajasthan. Irradiance values at each time step are isolated and normalized to the time interval to obtain NWP model output GHI values. The temporal resolution of the calculated NWP model GHI is 3 h.
After obtaining ECMWF GHI forecasts of 3-h temporal resolution at each grid point, averaging of forecasted GHI values over a 0.25° × 0.25° grid, i.e. over pixels surrounding the point locations is performed. Irradiance values obtained after spatial averaging have 3-h temporal resolution, which are to be interpolated to GHI values with 1-h temporal resolution.
Hereafter for point forecasts, two different techniques are used for temporal interpolation. In technique1, direct linear interpolation technique is employed to reduce temporal resolution of 3-hourly NWP model GHI values to 1 h, while in technique2, interpolation was performed on 3-hourly CSI (Kt*) values (using the Bird clear sky model) to obtain hourly Kt* values [14]. Then, hourly Kt* values are multiplied by hourly clear sky model values to obtain hourly NWP mainly adopted to account for the typical is mainly adopted to account for the typical diurnal pattern of irradiance. For multiple-site analysis, similar procedures are repeated with averaged forecasted NWP model GHI values from all point locations under study. The forecasted GHI series, obtained by employing these two techniques, are validated against acquired GHI datasets from the SRRA stations in Rajasthan [75, 122].
A comparison of the two techniques was performed by obtaining different measures of accuracy [12]. As can be seen in Table 3, a reduction in rRMSE for technique2 is observed, which signifies an improvement of forecast accuracy for the second approach. But the forecasts from technique2 could be further improved by using the MOS approach that removes systematic bias errors which depend on the time of the day and on sky conditions, etc. So, in technique3, the intention was to model the bias as a function of hourly clear sky index (Kt*) and the cosine of solar zenith, using the measurement data obtained from SRRA stations for the first 15 days of each month in 2014 as training set and validate the model using test set which comprises of measurement datasets for remaining days. Curve fitting parameters are evaluated and a good correspondence between the modelled and measured bias values is observed. Then, the improved forecast is obtained by subtracting the modelled bias values from the forecasts obtained using technique2 [81, 84].
Figure 10 shows the forecasted GHI series obtained from technique3 with the actual GHI values measured at Aburoad for a single-site analysis, and Fig. 11 compares the forecasted GHI series with averaged GHI values for a multiple-site analysis. After calculating error measures for technique3 (Table 3), it is observed that the forecasted GHI series evaluated using technique3 has a higher accuracy compared to the previous two techniques. Again, MOS updated forecasts with multiple-site analysis has a lower uncertainty compared to MOS updated forecasts with single site/local area analysis. For single-site analysis, the forecast accuracy is very good during clear sky conditions. However, the level of uncertainty increased during cloudy conditions. For MOS updated GHI with wide area analysis, the uncertainty reduced drastically because of smoothing due to spatial averaging reducing the deviation between forecasted and mean of measured GHI values (Table 3).

Forecasted GHI series obtained from technique3 with actual GHI measured at Aburoad for single site/point location analysis. Note the phase error during a cloudy sky situation on 26 May 2014

Forecasted GHI series obtained from technique3 with averaged value of GHIs measured at multiple site for wide area analysis
From Fig. 12, it can be observed that the least rRMSE value of around 9% is achieved for forecasted GHI series from technique3 with wide area analysis. The least percentage rRMSE signifies highly accurate forecasted GHI series, and this result is in agreement with the accuracy values observed in [90]. Figure 13 depicts relative MBE values obtained for different day-ahead forecasting techniques adopted. Very small rMBE values are obtained for MOS techniques with bias removal (Table 4).

Percentage rRMSE values obtained for different day-ahead forecasting techniques

Percentage rMBE values obtained for different day-ahead forecasting approaches
Discussion
In India, there is a strong need to overcome existing challenges in regulations and available infrastructure related to forecasting of VRE, so that forecasting accuracy improves with time. Hence, various stakeholders could ultimately get benefited from accurate forecast information.
Here, day-ahead forecasts are mandatory in many states for solar power plants with size greater than a specified threshold as mandated by different regulations. The spatial resolution of atmospheric high-resolution (HRES) NWP forecasts by ECMWF are 0.1 ̊ * 0.1 ̊ (which is approx. 11.2 km *11.2 km). A 5 MW power plant occupies typically a size of 0.06 km2. Therefore, same values of GHI could be applied to different solar power plants within same grid box. However, the incident GHI could be quite different in practice. The temporal resolution of the output of NWP model is either hourly or 3-hourly, while for scheduling, the output of solar PV power plant is required at 15 min interval. Some practical difficulties are encountered while forecasting using NWP models. Currently, there is a lack of experience in NWP applications for RE sector. However, there is a growing interest in the NWP products from meteorological organizations, namely IMD, NCMRWF, and IITM and also in the space organization ISRO.
Intra-day forecasting by solar power plant operators/grid operators has been necessitated by the different forecasting regulations in India. According to the literature, forecasts based on satellite image CMV performs well for a time frame up to six hours ahead. Presently, operational solar PV power forecasting based on CMV is not performed in India. Geo-stationary satellite visible and thermal image products are available from INSAT 3D and INSAT 3DR. However, there is a need for benchmarking the different forecasting methods in Indian conditions. Interesting insights could be revealed through the benchmarking exercise, e.g. a typical meteorological condition related to convective clouds prevalent in India is its quick formation and dissolution. This is different from common weather situations in mid-latitudes where there is a mostly advective nature of cloud motion. It also has to be considered that during the monsoon season in India the dissolution of clouds is happening at a slower rate. Sky image-based forecasts are still at a research stage. Furthermore, existing forecasting regulations mandate a minimum update interval of 1.5 h, while sky image based forecasts have a sub-hourly forecast horizon. This implies that a change in forecasting regulation is necessary to utilize sky image based forecasts for commercial use. There is also a need to further explore the various machine learning and statistical techniques for application in intra-day forecasting in India. In addition to this, there is a need to combine the different forecasting techniques in order to produce optimal forecasts for a large range of forecast horizon.
SLDCs/REMCs may face certain challenges while performing control area wide RE generation forecast. There is an issue with robust infrastructure for visibility at SLDC/REMC of the production information from VRE plants. Metering infrastructure is not sufficiently robust for the measurement of production information. VRE plants in the low voltage grid are connected to the load feeders making it difficult to segregate the production and consumption measurements. Validation of forecasts is extremely important for accuracy improvement over time. The information passed on to the REMC/ SLDC’s from the individual solar PV power plants is mostly restricted to AC power production. Information regarding other important dynamic time series data, e.g. DC power, GHI, GTI, Module Temperature, Wind speed, etc., is generally absent. Therefore, developing solar power forecast model at the level of individual plants or at the control area level is challenging considering the data currently available with SLDCs/REMCs. Regulation mandating the supply of above-mentioned information to the SLDCs/REMCs will be highly beneficial.
There is a requirement in REMC’s to have forecast produced on a week-ahead basis. The requirement is mainly for planning the maintenance of thermal generators. However, there is severe limitation in the accuracy of NWP forecast for this time horizon. This hinders the accuracy of forecasts for week-ahead time horizon.
Furthermore, the introduction of hybrid plants and VPPs will also necessitate development of site-specific or aggregate forecasts for participating in power exchange markets. Forecast uncertainty information also becomes very important when VRE units are expected to provide ancillary services.
The skill sets of the power system operators have to be upgraded with respect to usage of VRE generation forecasting information. Different aspect of system operation, namely control reserve requirement estimation, ramp management, congestion management, active distribution network management, etc., are influenced by the specified forecast information. Careful utilization of forecast information is necessary for an effective system operation.
There is a necessity for better clarity of particular aspects in certain regulations on RE generation forecasting in India. Many regulations in India stipulate that generator specific forecasts from SLDC are required. SLDC forecast should solely be for the purpose of grid security. Therefore, forecasting the individual output of every RE generator is not required for the above and would burden the SLDC unnecessarily. There is also a necessity for harmonization between inter-state and intra-state regulations. At present, most of the power plants are connected to the intra-state network. In the future, if the same power plant delivers power to both inter-state and intra-state networks, it has to deal with two separate accounting systems. Aerosol is expected to be a major factor affecting solar PV power generation. Therefore, R&D efforts have to be initiated to quantify the effect of aerosol on solar PV power output forecasts.
In future, the applications and utilization of VRE forecasting in India should increase significantly. There could be numerous other applications of generation forecast apart from the control area wide net load forecast and RE generator scheduling, which are currently envisaged. These include bidding in power and ancillary service markets, ramp forecasting, dynamic reserve dimensioning, grid congestion forecast, voltage management, etc. There has been an upward trend in the recent years of the total electricity traded at the power exchange. With the evolution of smart grids in India, VPPs may come into existence in the future. VRE generation forecasting is an essential part of VPP operations. The proposed QCA is similar in principle to VPP, although VPP can aggregate diverse types of resources and is not restricted to only VRE units. Currently, there is no concept of DSO in India. With major thrust given on roof top PV and the increasing complexity of distribution network, DSO might come into existence in the future. Forecasting is an essential functionality of DSO in order to prevent congestions in the network.
Conclusion
In this paper, existing literature on various applications of VRE generation forecasts and solar PV generation forecasting methods by which the generation forecast products suitable for these applications can be obtained have been discussed. Regulations pertaining to VRE generation forecasting and the ongoing development of centralized aggregate forecasting systems have been highlighted. Based on the ongoing research developments, potential applications of generation forecasts have been suggested for Indian power system from existing scientific literature. Further detailed study is necessary in order to overcome the challenges related to their practical implementation. Results of a research study on site level and regional aggregate solar irradiance forecasting, conducted for the state of Rajasthan, using ECMWF NWP data have been presented and the benefit of aggregation can be seen in the improvement of bias corrected accuracy from 17.29 to 9.53%.
Accurate VRE forecast is an important factor among others, e.g. control reserve, flexibility, market design etc., for facilitating integration of VRE into the electricity grid. In India, PV power forecasting is a new practice, and therefore, it would take few years to gain maturity in terms of technology, applications and uniform effective regulations. Today, there is still a lack of scientific experience in performing solar power forecasting for different spatio-temporal scales in India. Robust infrastructure for VRE forecasting will assist the Indian Government in achieving its RE targets. REMCs are an important initiative that would help integrate more RE into the electricity grid. Continuous improvement of forecasting accuracy over time can be achieved by synergetic activities of the relevant stakeholders. CERC, FOR and many SERCs have already brought out draft, model or final regulations on VRE forecasting. Intra-day forecasting techniques such as satellite and sky imager-based methods, are yet to be fully explored in the Indian context. However, it is expected that with the improvements in day-ahead and intra-day forecasting techniques, the accuracy of forecast will also improve considerably in India. This has positive implications for the secure, economic and sustainable operation of the Indian power system.
Abbreviations
- AC:
-
Alternating Current
- AEMO:
-
Australian Energy Market Operator
- ANN:
-
Artificial Neural Network
- AR:
-
Auto-regression
- ARMA:
-
Auto-regressive moving average
- ARIMA:
-
Auto-regressive integrated moving average
- ASEFS:
-
Australian Solar Energy Forecasting System
- ATC:
-
Available Transmission Capacity
- BSRN:
-
Baseline Surface Radiation Network
- CBH:
-
Cloud base height
- CEA:
-
Central Electricity Authority
- CECRE:
-
Centro de Control de Energ ías Renovables
- CERC:
-
Central Electricity Regulatory Commission
- CI:
-
Clearness Index
- CMV:
-
Cloud Motion Vector
- CSI:
-
Clear-sky Index
- CSL:
-
Clear-sky Library
- DC:
-
Direct Current
- DER:
-
Distributed Energy Resource
- DISCOM:
-
Distribution Company
- DSO:
-
Distribution System Operator
- ECMWF:
-
European Centre for Medium-Range Weather Forecasts
- ED:
-
Economic Dispatch
- EHT:
-
Extra High Tension
- EPEX:
-
European Energy Exchange
- FERC:
-
Federal Energy Regulatory Commission
- FGMO:
-
Free Governor Mode of Operation
- FIT:
-
Feed-In Tariff
- FOR:
-
Forum of Regulators
- FSP:
-
Forecast Service Provider
- GEC:
-
Green Energy Corridor
- GHI:
-
Global Horizontal Irradiance
- GTI:
-
Global Tilted Irradiance
- GIZ:
-
Deutsche Gesellschaft für Internationale Zusammenarbeit
- GOI:
-
Government of India
- HT:
-
High Tension
- IEGC:
-
Indian Electricity Grid Code
- IFS:
-
Integrated Forecast System
- IGEP:
-
Indo-German Energy Programme
- IITM:
-
Indian institute of Tropical Meteorology
- IMD:
-
Indian Meteorological Department
- ISRO:
-
Indian Space Research Organisation
- kNN:
-
Kth nearest neighbour
- LDC:
-
Load Despatch Centre
- LT:
-
Low Tension
- MACC:
-
Monitoring Atmospheric Composition and Climate
- MAE:
-
Mean Absolute Error
- MBE:
-
Mean Bias Error
- MNRE:
-
Ministry of New and Renewable Energy
- MoES:
-
Ministry of Earth Sciences
- MoP:
-
Ministry of Power
- MOS:
-
Model Output Statistics
- NCMRWF:
-
National Centre for Medium Range Weather Forecasting
- NIWE:
-
National Institute of Wind Energy
- NLDC:
-
National Load Despatch centre
- NWP:
-
Numerical Weather Prediction
- OLTC:
-
On Load Tap Changer
- PGCIL:
-
Power Grid Corporation of India Limited
- POA:
-
Plane of Array
- PV:
-
Photovoltaic
- QCA:
-
Qualified Coordinating Agency
- RBR:
-
red-to-blue ratio
- RE:
-
Renewable Energy
- REE:
-
Red Electrica de Espana
- REMC:
-
Renewable Energy Management Centre
- RES:
-
Renewable Energy Sources
- RES-E:
-
Electricity from renewable energy sources
- RLDC:
-
Regional Load Despatch Centre
- RMSE:
-
Root Mean Square Error
- RRAS:
-
Reserve Regulation Ancillary Services
- rMBE:
-
relative Mean Bias Error
- rRMSE:
-
relative Root Mean Square Error
- R&D:
-
Research and Development
- SERC:
-
State Electricity Regulatory Commission
- SRRA:
-
Solar Radiation Resource Assessment
- STU:
-
State Transmission Utility
- SVM:
-
Support Vector Machine
- SVR:
-
Support Vector Regression
- SWL:
-
Secure Wind Level
- TSO:
-
Transmission System Operator
- UC:
-
Unit Commitment
- VG:
-
Variable Generation
- VPP:
-
Virtual Power Plant
- VRE:
-
Variable Renewable Energy
- WEF:
-
Wind Energy Forecast system
- WSAT:
-
Wind Security Assessment Tool
References
Anese, E.D., Baker, K., Summers, T.: Transactions on power systems chance-constrained AC optimal power flow for distribution systems with renewables 8950, 1–12 (2017). https://doi.org/10.1109/TPWRS.2017.2656080
Antonanzas, J., Osorio, N., Escobar, R., Urraca, R., Martinez-de-Pison, F.J., Antonanzas-Torres, F.: Review of photovoltaic power forecasting. Sol. Energy 136, 78–111 (2016). https://doi.org/10.1016/j.solener.2016.06.069
Antonanzas, J., Pozo-vázquez, D., Fernandez-jimenez, L.A., Martinez-de-pison, F.J.: The value of day-ahead forecasting for photovoltaics in the Spanish electricity market. Sol. Energy 158, 140–146 (2017). https://doi.org/10.1016/j.solener.2017.09.043
APERC.: Forecasting, scheduling and deviation settlement of solar and wind generation regulation (2017)
Apostolopoulou, D., Bahramirad, S., Khodaei, A.: The interface of power. IEEE Power Energy Mag. 46–51 (2016).
ARENA.: Australian Solar Energy Forecasting System Final report : project results and lessons learnt (2013)
Barth, R., Apfelbeck, J., Vogel, P., Meibom, P., Weber, C.: Load-flow based market coupling with large- scale wind power in Europe. 8th Int. Work. Large-Scale Integr. Wind Power into Power Syst. as well as Transm. Networks Offshore Wind Farms 296—303 (2009)
Bates, J.M., Granger, C.W.J.: The Combination of Forecasts. J. Oper. Res. Soc. 20, 451 (1969). https://doi.org/10.2307/3008764
Bessa, R., Du, P., Geisler, K., Haupt, S.E., Lange, M., Möhrlen, C.: Uncertainty Forecasting in a Nutshell. IEEE Power and Energy Magazine 15(6), 40–49 (2017). https://doi.org/10.1109/MPE.2017.2729100
Bessa, R., Möhrlen, C., Fundel, V., Siefert, M., Browell, J., Haglund El Gaidi, S., Hodge, B.-M., Cali, U., Kariniotakis, G.: Towards improved understanding of the applicability of uncertainty forecasts in the electric power industry. Energies 10, 1402. (2017b).https://doi.org/10.3390/en10091402
Beyer, H.G., Costanzo, C., Heinemann, D.: Modifications of the heliosat procedure for irradiance estimates from satellite images. Sol. Energy 56, 207–212 (1996). https://doi.org/10.1016/0038-092X(95)00092-6
Beyer, H.G., Polo Martinez, J., Suri, M., Torres, J.L., Lorenz, E., Müller, S.C., Hoyer-Click, C., Ineichen, P.: D 1.1. 3 Report on Benchmarking of Radiation Products. Report under contract (2009)
Blanc, P., Remund, J., Vallance, L.: Short-term solar power forecasting based on satellite images. In: Renewable energy forecasting, pp. 179–198. Woodhead Publishing (2017)
Bird, R.E., Hulstrom, R.L.: Simplified clear sky model for direct and diffuse insolation on horizontal surfaces. Solar Energy Research Inst., Golden, CO (USA) (1981)
Borghetti, A., Bosetti, M., Grillo, S., Paolone, M., Silvestro, F.: Short-term scheduling of active distribution systems. 2009 IEEE Bucharest PowerTech Innov. Ideas Towar. Electr. Grid Futur. 1–7 (2009). https://doi.org/10.1109/PTC.2009.5281921
CEA: Technical standards for connectivity of the distributed generation resources (2013)
CERC.: Central Electricity Regulatory Commission, Government of India (2010)
Chernyakhovskiy, I., Tian, T., Mclaren, J., Miller, M., Geller, N., Chernyakhovskiy, I., Tian, T., Mclaren, J., Miller, M., Geller, N.: U.S. Laws and Regulations for Renewable Energy Grid Interconnections (2016)
Chow, C.W., Urquhart, B., Lave, M., Dominguez, A., Kleissl, J., Shields, J., Washom, B.: Intra-hour forecasting with a total sky imager at the UC San Diego solar energy testbed. Sol. Energy 85, 2881–2893 (2011). https://doi.org/10.1016/j.solener.2011.08.025
Coimbra, C.F.M., Kleissl, J., Marquez, R.: Overview of solar-forecasting methods and a metric for accuracy evaluation. In: Solar Energy Forecasting and Resource Assessment (2011)
Coimbra, C.F.M., Pedro, H.T.C.: Stochastic-learning methods. In: Solar Energy Forecasting and Resource Assessment (2013)
COST Action ES1002: Weather intelligence for renewable energies (WIRE) current state report (2012)
Das, A.K.: Applicability of error limit in forecasting and scheduling of wind and solar Power in India. In: Indian Smart Grid Week 2017 (2017)
Deutsch, M., Granger, C.W.J., Teräsvirta, T.: The combination of forecasts using changing weights. Int. J. Forecast. 10, 47–57 (1994). https://doi.org/10.1016/0169-2070(94)90049-3
Diabaté, L., Demarcq, H., Michaud-Regas, N., Wald, L.: Estimating Incident Solar Radiation at the Surface from Images of the Earth Transmitted by Geostationary Satellites: The Heliosat Project. Int. J. Sol. Energy 5, 261–278 (1987). https://doi.org/10.1080/01425918708914425
Diebold, F.X., Pauly, P.: Structural Change and the Combination of Forecasts. J. Forecast. 6, 21–40 (1987)
Doherty, R., Denny, E., O’Malley, M.: System operation with a significant wind power penetration 1002–1007 (2005). https://doi.org/10.1109/pes.2004.1372988
Doherty, R., O'Malley, M.: Quantifying reserve demands due to increasing wind power penetration. In: 2003 IEEE Bologna Power Tech Conference Proceedings, vol. 2, IEEE (2003)
Dreidy, M., Mokhlis, H., Mekhilef, S.: Inertia response and frequency control techniques for renewable energy sources: a review. Renew. Sustain. Energy Rev. 69, 144–155 (2017). https://doi.org/10.1016/j.rser.2016.11.170
Duan, Q., Feng, Y., Wang, J.: Clustering of visible and infrared solar irradiance for solar architecture design and analysis. Renew. Energy 165, 668–677 (2021)
Dudurych, I.M., O’Sullivan, J., Rogers, A., Bell, D., Rourke, S., Kamaluddin, N.: Tools for handling high amounts of wind generation in National Control Centre in Ireland. IEEE Power Energy Soc. Gen. Meet. (2012). https://doi.org/10.1109/PESGM.2012.6345762
eclareon, E.V., Ö.-I.: Integration of electricity from renewables to the electricity grid and to the electricity market – RES-INTEGRATION (2011)
Eirgrid, SONI: ensuring a secure , reliable and efficient power system in a changing environment (2011)
Ela, E., O’Malley, M.: Studying the variability and uncertainty impacts of variable generation at multiple timescales. IEEE Trans. Power Syst. 27, 1324–1333 (2012). https://doi.org/10.1109/TPWRS.2012.2185816
Elliott, G., Timmermann, A.: Optimal forecast combination under regime switching. Int. Econ. Rev. (Philadelphia) 46, 1081–1102 (2005). https://doi.org/10.1111/j.1468-2354.2005.00361.x
Ernst, B., Schreirer, U., Berster, F., Pease, J., Scholz, C., Erbring, H.-P., Schlunke, S., Makarov, Y.V.: Large scale wind and solar integration in Germany. Pacific Northwest National Lab. (PNNL), Richland, WA, United States. (2010)
Esen, H., Inalli, M., Sengur, A., Esen, M.: Artificial neural networks and adaptive neuro-fuzzy assessments for ground-coupled heat pump system. Energy and Buildings 40(6), 1074–1083 (2008)
Esen, H., Inalli, M., Sengur, A., Esen, M.: Forecasting of a ground-coupled heat pump performance using neural networks with statistical data weighting pre-processing. Int. J. of Thermal Sciences 47(4), 431–441 (2008)
Esen, H., Inalli, M., Sengur, A., Esen, M.: Performance prediction of a ground-coupled heat pump system using artificial neural networks. Expert Syst. Appl. 35(4), 1940–1948 (2008)
Esen, H., Ozgen, F., Esen, M., Sengur, A.: Artificial neural network and wavelet neural network approaches for modelling of a solar air heater. Expert Syst. Appl. 36(8), 11240–11248 (2009)
Esen, H., Esen, M., Ozsolak, O.: Modelling and experimental performance analysis of solar-assisted ground source heat pump system. J. Exp. Theor. Artif. Intell. 29(1), 1–17 (2017)
Esen, H., Inalli, M., Sengur, A., Esen, M.: Modelling a ground-coupled heat pump system using adaptive neuro-fuzzy inference systems. Int. J. of Refrigeration 31(1), 65–74 (2008)
Esen, H., Inalli, M., Sengur, A., Esen, M.: Modelling a ground-coupled heat pump system by a support vector machine. Renewable Energy 33(8), 1814–1823 (2008)
Esen, H., Inalli, M., Sengur, A., Esen, M.: Predicting performance of a ground-source heat pump system using fuzzy weighted pre-processing-based ANFIS. Build. Environ. 43(12), 2178–2187 (2008)
Esen, H., Ozgen, F., Esen, M., Sengur, A.: Modelling of a new solar air heater through least-squares support vector machines. Expert Syst. Appl. 36(7), 10673–10682 (2009)
Eurelectric: Active distribution system management: a key tool for the smooth integration of distributed generation (2013)
Flynn, M., Sheridan, W.P., Dillon, J.D., O’Malley, M.J.: Reliability and reserve in competitive electricity market scheduling. IEEE Trans. Power Syst. 16, 78–87 (2001). https://doi.org/10.1109/59.910784
FOR: Sub-Group report on introduction of five minute scheduling , metering , accounting and settlement in indian electricity market (2018)
FOR: Model regulations on forecasting, scheduling and deviation settlement of wind and solar generating stations at the state level (2015)
Gallucci, D., Romano, F., Cersosimo, A., Cimini, D., Di Paola, F., Gentile, S., Geraldi, E., Larosa, S., Nilo, S., Ricciardelli, E., Viggiano, M.: Nowcasting Surface Solar Irradiance with AMESIS via Motion Vector Fields of MSG-SEVIRI Data. Remote Sensing 10(6), 845 (2018)
GERC: Forecasting, scheduling, deviation settlement and related matters of solar and wind generation sources regulations (2019)
GERC: Draft regulations on net metering rooftop solar PV grid interactive systems (2021)
Gesino, A.J.: Power reserve provision with wind farms: Grid integration of wind power. Kassel University press GmbH (2011)
GIZ: Detailed project report for establishment of renewable energy management centres (REMC) (2015)
GIZ: Analysis of indian electricity distribution systems for the integration of high shares of rooftop PV (2017)
Gonçalves, S., Morais, H., Sousa, T., Vale, Z.: Energy resource scheduling in a real distribution network managed by several virtual power players. Proc. IEEE Power Eng. Soc. Transm. Distrib. Conf. 1–8 (2012). https://doi.org/10.1109/TDC.2012.6281674
Guha Thakurta, P., Maeght, J., Belmans, R., Van Hertem, D.: Increasing Transmission Grid Flexibility by TSO Coordination to Integrate More Wind Energy Sources while Maintaining System Security. IEEE Trans. Sustain. Energy 6, 1122–1130 (2015). https://doi.org/10.1109/TSTE.2014.2341640
Hammer, A., Heinemann, D., Hoyer, C., Kuhlemann, R., Lorenz, E., Müller, R., Beyer, H.G.: Solar energy assessment using remote sensing technologies. Remote Sens. Environ. 86, 423–432 (2003). https://doi.org/10.1016/S0034-4257(03)00083-X
Han, Yu, Rosehart, W.D.: An Optimal Power Flow Algorithm to Achieve Robust Operation Considering Load and Renewable Generation Uncertainties. IEEE Trans. Power Syst. 27(4), 1808–1817 (2012). https://doi.org/10.1109/TPWRS.2012.2194517
Hay, S.L., Ault, G.W., Bell, K.R.W., McDonald, J.R.: System operator interfaces to active network management schemes in future distribution networks. Univ. Power Eng. Conf, Proc (2008). https://doi.org/10.1109/UPEC.2008.4651456
IEA-RETD: Integration of variable renewable energy, Volume II: Case studies (2015)
Jacobs, D.: Renewable energy policy convergence in the EU: The evolution of feed-in tariffs in Germany, Spain and France (2012)
Ji, Y., Tong, L., Thomas, R.J.: Probabilistic forecast of real-time LMP and network congestion. 32(2), 831–841 (2017). https://doi.org/10.1109/TPWRS.2016.2592380
Kaur, A., Nonnenmacher, L., Pedro, H.T.C., Coimbra, C.F.M.: Benefits of solar forecasting for energy imbalance markets. Renew. Energy 86, 819–830 (2016). https://doi.org/10.1016/j.renene.2015.09.011
KERC: Regulations on the implementation of solar rooftop photovoltaic power plants (2016)
KERC: Regulation on forecasting, scheduling, deviation settlement and related matters for wind and solar generation sources (2016)
Khanabadi, M., Kamalasadan, S.: Day ahead scheduling of distribution system with Distributed Energy Resources considering demand response and energy storage. 45th North Am. Power Symp. NAPS 2013, 5 (2013). https://doi.org/10.1109/NAPS.2013.6666894
Killinger, S., Guthke, P., Semmig, A., Müller, B., Wille-Haussmann, B., Fichtner, W.: Upscaling PV Power Considering Module Orientations. IEEE J. Photovoltaics 7, 941–944 (2017). https://doi.org/10.1109/JPHOTOV.2017.2684908
Killinger, S., Müller, B., Wille-Haussmann, B., McKenna, R.: Evaluating different upscaling approaches to derive the actual power of distributed PV systems. In: 2017 IEEE 44th Photovoltaic Specialist Conference (PVSC), pp. 126–131 (2017). https://doi.org/10.1109/PVSC.2017.8366653
Kippelt, S., Thorsten, S., Rehtanz, C.: Flexible dimensioning of control reserve for future energy scenarios. In: 2013 IEEE Grenoble Conference. IEEE (2013)
Kloubert, ML., Schwippe, J., Müller, S.C., Rehtanz, C.: Analyzing the impact of forecasting errors on redispatch and control reserve activation in congested transmission networks. In: 2015 IEEE Eindhoven PowerTech. IEEE. (2015)
Koraki, D., Strunz, K.: Wind and solar power integration in electricity markets and distribution networks through service-centric virtual power plants. IEEE Trans. Power Syst. (2017). https://doi.org/10.1109/TPWRS.2017.2710481
Kühnert, J.: Development of a photovoltaic power prediction system for forecast horizons of several hours. Carl von Ossietzky Universität Oldenburg (2016)
Kuhn, P., Nouri, B., Wilbert, S., Prahl, C., Kozonek, N., Schmidt, T., Yasser, Z., Ramirez, L., Zarzalejo, L., Meyer, A., Vuilleumier, l., Heinemann, D., Blanc, P., Pitz-Paal, R.: Validation of an all-sky imager-based nowcasting systems for industrial PV plants. EU PVSEC Progress in Photovoltaics (2017)
Kumar, A., Gomathinayagam, S., Giridhar, G., Mitra, I., Vashistha, R., Meyer, R., Schwandt, M., Chhatbar, K.: Field experiences with the operation of solar radiation resource assessment stations in India. Energy Procedia. 49, 2351–2361 (2014)
Kunz, F., Zerrahn, A.: The benefit of coordinating congestion management in Germany. Int. Conf. Eur. Energy Mark. EEM (2013). https://doi.org/10.1109/EEM.2013.6607350
Larson, V.E.: Forecasting solar irradiance with numerical weather prediction models, in: Solar Energy forecasting and resource assessment (2013)
Li, Y., Su, Y., Shu, L.: An ARMAX model for forecasting the power output of a grid connected photovoltaic system. Renew. Energy 66, 78–89 (2014). https://doi.org/10.1016/j.renene.2013.11.067
Lima, F.J.L., Martins, F.R., Pereira, E.B., Lorenz, E., Heinemann, D.: Forecast for surface solar irradiance at the Brazilian Northeastern region using NWP model and artificial neural networks. Renewable Energy 87, 807–818 (2016)
Liu, Y., Zhu, L., Zhan, L., Gracia, J.R., King, T.J., Liu, Y.: Active power control of solar PV generation for large interconnection frequency regulation and oscillation damping. Int. J. energy Res. 31, 135–147 (2007)
Lorenz, E., Hurka, J., Heinemann, D., Beyer, H.G.: Irradiance forecasting for the power prediction of grid-connected photovoltaic systems. IEEE J. Sel. Top. Appl. Earth Obs. Remote Sens. 2, 2–10 (2009). https://doi.org/10.1109/JSTARS.2009.2020300
Lorenz, E., Kühnert, J., Heinemann, D.: Short term forecasting of solar irradiance by combining satellite data and numerical weather predictions. In: Proceedings of the 27th European PV Solar Energy Conference (EU PVSEC), Frankfurt, Germany (2012)
Lorenz, E., Kühnert, J., Heinemann, D.: Overview of irradiance and photovoltaic power prediction. In: Troccoli, A., Laurent, D., Ellen, S. (eds.) Weather Matters for Energy, pp. 429–456. Springer (2014). https://doi.org/10.1007/978-1-4614-9221-4
Lorenz, E., Scheidsteger, T., Hurka, J., Heinemann, D., Kurz, C.: Regional PV power prediction for improved grid integration. Prog. Photovolt Res. Appl. (2010). https://doi.org/10.1002/pip
Loutan, C., Klauer, P., Chowdhury, S., Hall, S., Morjaria, M., Chadliev, V., Milam, N., Milan, C., Gevorgian, V.: Demonstration of essential reliability services by a 300-MW solar photovoltaic power plant. National Renewable Energy Lab.(NREL), Golden, CO (United States) (2017)
Ma, J., Silva, V., Belhomme, R., Kirschen, D.S., Ochoa, L.F.: Evaluating and planning flexibility in sustainable power systems. IEEE Trans. Sustain. Energy 4, 200–209 (2013). https://doi.org/10.1109/TSTE.2012.2212471
Malley, M.O., Liu, C.-C.: Competitive wholesale electricity markets. In: Power System Restructuring and Deregulation. John Wiley & Sons Ltd (2001)
Mammoli, A., Terren-Serrano, G., Menicucci, A., Caudell, T.P., Martinez-Ramon, M.: An experimental method to merge far-field images from multiple longwave infrared sensors for short-term solar forecasting. Sol. Energy 187, 254–260 (2019)
Martinez-Anido, C.B., Botor, B., Florita, A.R., Draxl, C., Lu, S., Hamann, H.F., Hodge, B.M.: The value of day-ahead solar power forecasting improvement. Sol. Energy 129, 192–203 (2016). https://doi.org/10.1016/j.solener.2016.01.049
Mathiesen, P., Kleissl, J.: Evaluation of numerical weather prediction for intra-day solar forecasting in the continental United States. Sol. Energy 85, 967–977 (2011). https://doi.org/10.1016/j.solener.2011.02.013
Matos, M., Bessa, R., Botterud, A., Zhou, Z.: Forecasting and setting power system operating reserves. In: Renewable Energy Forecasting from Models to Applications (2017).
Maurer, C., Krahl, S., Weber, H.: Dimensioning of secondary and tertiary control reserve by probabilistic methods. Eur. Trans. Electr. Power 19, 544–552 (2009). https://doi.org/10.1002/etep
Mellit, A., Pavan, A.M.: A 24-h forecast of solar irradiance using artificial neural network: Application for performance prediction of a grid-connected PV plant at Trieste. Italy. Sol. Energy 84, 807–821 (2010). https://doi.org/10.1016/j.solener.2010.02.006
MERC: Regulations on grid interactive rooftop renewable energy generating systems (2019)
Miller, M., Cox, S.: Overview of variable renewable energy regulatory issues. National Renewable Energy Laboratory (2014)
Milligan, M., Donohoo, P., Lew, D., Ela, E., Kirby, B., Holttinen, H., Lannoye, E., Flynn, D., O’malley, M., Miller, N., Eriksen, P.B., Denmark, A.G., Rawn, B., Netherlands, M.G., Gómez, E., Spain, L., Robitaille, A., Kamwa, I.: Operating Rserves and Wind Power Integration. 9th Annu. Int. Work. Large-Scale Integr. Wind Power into Power Syst. as well as Transm. Networks Offshore Wind Power Plants Conf. (2010)
Mitra, I., Sharma, S., Kaur, M., Ramanan, A., Wypior, M., Heinemann, D.: Evolution of Solar Forecasting in India: the Introduction of REMCs. In: ISES EuroSun. Palma, pp. 1–10 (2016). https://doi.org/10.18086/eurosun.2016.11.05
MPERC: Regulations on grid connected net metering (2021)
Munawar, U., Wang, Z.: A Framework of Using Machine Learning Approaches for Short-Term Solar Power Forecasting. Journal of Electrical Engineering & Technology 15, 561–569 (2020)
Orwig, K.D., Ahlstrom, M.L., Banunarayanan, V., Sharp, J., Wilczak, J.M., Freedman, J., Haupt, S.E., Cline, J., Bartholomy, O., Hamann, H.F., Hodge, B., Finley, C., Nakafuji, D., Peterson, J., Maggio, D., Marquis, M.: Recent Trends in Variable Generation Forecasting and Its Value to the Power System. IEEE Trans. Sustain. Energy (2014). https://doi.org/10.1109/TSTE.2014.2366118
Paoli, C., Voyant, C., Muselli, M., Nivet, M.L.: Forecasting of preprocessed daily solar radiation time series using neural networks. Sol. Energy 84, 2146–2160 (2010). https://doi.org/10.1016/j.solener.2010.08.011
Pelland, S., Galanis, G., Kallos, G.: Solar and photovoltaic forecasting through post-processing of the Global Environmental Multiscale numerical weather prediction model. Prog. Photovolt Res. Appl. (2011). https://doi.org/10.1002/pip
Pelland, S., Remund, J., Kleissl, J., Oozeki, T., De Brabandere, K.: Photovoltaic and solar forecasting: State of the Art. Int. Energy Agency Photovolt. Power Syst. Program. Rep. IEA PVPS T14 1–40 (2013)
Perez, R., Lorenz, E., Pelland, S., Beauharnois, M., Van Knowe, G., Hemker, K., Heinemann, D., Remund, J., Müller, S.C., Traunmüller, W., Steinmauer, G., Pozo, D., Ruiz-Arias, J.A., Lara-Fanego, V., Ramirez-Santigosa, L., Gaston-Romero, M., Pomares, L.M.: Comparison of numerical weather prediction solar irradiance forecasts in the US. Canada and Europe. Sol. Energy 94, 305–326 (2013). https://doi.org/10.1016/j.solener.2013.05.005
Plancke, G., De Vos, K., Belmans, R., Delnooz, A.: Virtual power plants: Definition, applications and barriers to the implementation in the distribution system. Int. Conf. Eur. Energy Mark. EEM 2015-Augus. (2015). https://doi.org/10.1109/EEM.2015.7216693
Rafati, A., Joorabian, M., Mashhour, E., Shaker, H. R.: High dimensional very short-term solar power forecasting based on a data-driven heuristic method. Energy. 219 (2021)
Ramsay, C., Pudjianto, C., Srbac, G., Durstewitz, M.: The Virtual Power Plant: Enabling integration of distributed generation and demand. FENIX Bull. 2, 1–2 (2008)
Reikard, G.: Predicting solar radiation at high resolutions: A comparison of time series forecasts. Sol. Energy 83, 342–349 (2009). https://doi.org/10.1016/j.solener.2008.08.007
Richter, A., Moskalenko, N., Hauer, I., Schröter, T., Wolter, M.: Technical integration of virtual power plants into German system operation. In: 14th International Conference on the European Energy Market (2017)
Roy, A., Mitra, I.: Potential applications of short- term solar, wind generation forecasts & dynamic line rating in. In: 1st International Conference on Large Scale Grid Integration of Renewable Energy (2017)
Ruf, H., Schroedter-Homscheidt, M., Heilscher, G., Beyer, H.G.: Quantifying residential PV feed-in power in low voltage grids based on satellite-derived irradiance data with application to power flow calculations. Sol. Energy 135, 692–702 (2016). https://doi.org/10.1016/j.solener.2016.06.001
Ryan, J., Ela, E., Flynn, D., O’Malley, M.: Variable generation, reserves, flexibility and policy interactions. Proc. Annu. Hawaii Int. Conf. Syst. Sci. 2426–2434 (2014). https://doi.org/10.1109/HICSS.2014.304
Saint-Drenan, Y.M., Good, G.H., Braun, M., Freisinger, T.: Analysis of the uncertainty in the estimates of regional PV power generation evaluated with the upscaling method. Sol. Energy 135, 536–550 (2016). https://doi.org/10.1016/j.solener.2016.05.052
Saint-pierre, A., Mancarella, P.: Active Distribution System Management : A Dual-Horizon Scheduling Framework for DSO / TSO Interface Under Uncertainty. IEEE Transactions on Smart Grid. 8(5) 2186–2197 (2016). https://doi.org/10.1109/TSG.2016.2518084
Seiz, G., Shields, J., Feister, U., Baltsavias, E.P., Gruen, A.: Cloud mapping with ground-based photogrammetric cameras. Int. J. Remote Sens. 28, 2001–2032 (2007). https://doi.org/10.1080/01431160600641822
Sfetsos, A., Coonick, A.H.: Univariate and multivariate forecasting of hourly solar radiation with artificial intelligence techniques. Sol. Energy 68, 169–178 (2000). https://doi.org/10.1016/S0038-092X(99)00064-X
Shields, J.E., Karr, M.E., Burden, A.R., Johnson, R.W., Mikuls, V.W., Streeter, J.R., Hodgkiss, W.S.: Research toward multi-site characterization of sky obscuration by clouds. SCRIPPS INSTITUTION OF OCEANOGRAPHY LA JOLLA CA MARINE PHYSICAL LAB (2009)
Silva, M., Morais, H., Vale, Z.: An integrated approach for distributed energy resource short-term scheduling in smart grids considering realistic power system simulation. Energy Convers. Manag. 64, 273–288 (2012). https://doi.org/10.1016/j.enconman.2012.04.021
Sobri, S., Koohi-kamali, S., Rahim, N.A.: Solar photovoltaic generation forecasting methods : A review Number of Day. Energy Convers. Manag. 156, 459–497 (2018). https://doi.org/10.1016/j.enconman.2017.11.019
Stetz, B.T., Niedermeyer, F., Scheibner, G., Braun, M.: Twilight of the Grids: The impact of distributed solar on germany's energy transition. IEEE power energy Mag. 13(2) 50–61 (2015). https://doi.org/10.1109/MPE.2014.2379971
TNERC: Grid interactive solar PV energy generating systems (2021)
Tripathy, S. K., Mitra, I., Heinemann, D., Giridhar, G., Gomathinayagam, S.: Impact assessment of short-term variability of solar radiation in Rajasthan using SRRA data. Renew. Sustain. Energy Rev. 78, 798–806 (2017). https://doi.org/10.1016/j.rser.2017.05.014
Ulbig, A., Andersson, G.: Analyzing operational flexibility of electric power systems. Int. J. Electr. Power Energy Syst. 72, 155–164 (2015). https://doi.org/10.1016/j.ijepes.2015.02.028
Urquhart, B., Ghonima, M., Nguyen, D. (Andu), Kurtz, B., Chow, C.W., Kleissl, J.: Sky-imaging systems for short-term forecasting. In: Solar Energy Forecasting and Resource Assessment. pp. 195–232 (2013). https://doi.org/10.1016/B978-0-12-397177-7.00009-7
Voyant, C., Notton, G., Kalogirou, S., Nivet, M.L., Paoli, C., Motte, F., Fouilloy, A.: Machine learning methods for solar radiation forecasting: A review. Renew. Energy 105, 569–582 (2017). https://doi.org/10.1016/j.renene.2016.12.095
Wolff, B.: Support vector regression for solar power prediction. Carl von Ossietzky Universität Oldenburg (2017)
Wolff, B., Kramer, O., Heinemann, D.: Selection of numerical weather forecast features for PV power predictions with random forests. Lect. Notes Comput. Sci. (including Subser. Lect. Notes Artif. Intell. Lect. Notes Bioinformatics) 10097 LNAI, 78–91 (2017). https://doi.org/10.1007/978-3-319-50947-1_8
Zhen, Z., Liu, J., Zhang, Z., Wang, F., Chai, H., Yili, Y., Lu, X., Wang, T., Lin, Y.: Deep learning based surface irradiance mapping model for solar PV power forecasting using sky image. IEEE Trans. Ind. Appl. 56(4), 3385–3396 (2015). https://doi.org/10.1109/TIA.2020.2984617
Zieger, M., Lange, M., Focken, U.: Variable renewable energy forecasting- integration into electricity grids and markets - a best practice guide (2015)
Acknowledgements
The work described here was conducted under the Green Energy Corridors (GEC) project of the Deutsche Gesellschaft für Internationale Zusammenarbeit GmbH (GIZ GmbH). The GEC project has been funded by the Federal Ministry for Economic Cooperation and Development (Bundesministerium für wirtschaftliche Zusammenarbeit und Entwicklung, BMZ) and implemented by GIZ GmbH under Indo- German Energy Program. The authors would also like to thank the Ministry of New and Renewable Energy (MNRE), Government of India for providing valuable information. The authors would also like to thank the University of Oldenburg for the continued support provided. On behalf of all authors, the corresponding author states that there is no conflict of interest.
Funding
Open Access funding enabled and organized by Projekt DEAL.
Author information
Authors and Affiliations
Corresponding author
Additional information
Publisher's Note
Springer Nature remains neutral with regard to jurisdictional claims in published maps and institutional affiliations.
Rights and permissions
Open Access This article is licensed under a Creative Commons Attribution 4.0 International License, which permits use, sharing, adaptation, distribution and reproduction in any medium or format, as long as you give appropriate credit to the original author(s) and the source, provide a link to the Creative Commons licence, and indicate if changes were made. The images or other third party material in this article are included in the article's Creative Commons licence, unless indicated otherwise in a credit line to the material. If material is not included in the article's Creative Commons licence and your intended use is not permitted by statutory regulation or exceeds the permitted use, you will need to obtain permission directly from the copyright holder. To view a copy of this licence, visit http://creativecommons.org/licenses/by/4.0/.
About this article

Cite this article
Mitra, I., Heinemann, D., Ramanan, A. et al. Short-term PV power forecasting in India: recent developments and policy analysis. Int J Energy Environ Eng 13, 515–540 (2022). https://doi.org/10.1007/s40095-021-00468-z
Received:
Accepted:
Published:
Issue Date:
DOI: https://doi.org/10.1007/s40095-021-00468-z