
Abstract
This paper outlines the development of an improved approach to the use of lean tools and techniques to improve the performance of manufacturing enterprises. Several research studies attempt to measure the overall leanness score of the manufacturing process; however, they failed to consider the interdependent relationships between lean performance metrics and considered all performance measures to be equally important during analysis. This paper proposes the weighted leanness assessment methodology to further extend the most recent developed leanness assessment model. The developed methodology in this research provides an integrated leanness score of the production process which considers the interrelationships between different performance metrics due to competing for business and operational strategies. The fuzzy-based analytic network process approach is used to measure and allocate relative importance weightings to each performance metric. The result from the proposed methodology in this research provides a more accurate overall leanness score by prioritising different performance measures according to the manufacturer’s needs. A case study was conducted to illustrate the effectiveness and validity of the proposed model and methodologies.
Introduction
Compared with mass production, lean production employs less resources, such as manufacturing plant, space, time, investment, design activities and on-site inventory level to deliver a similar product with the same level of quality in the most economical and efficient manner (Womack and Jones 1990; Bayou and Korvin 2008; Anvari et al. 2011). In addition, according to Shah and Ward (2007), lean production is an integrated socio-technical system that eliminates manufacturing’s wastes and controls the variability of suppliers and customers. Hence, if this manufacturing philosophy was adopted and implemented prudently, it could lead to global manufacturing excellence, transforming the production line into a high-quality system that delivers the final product to the customer on time with minimum amount of wastes (Shah and Ward 2003; Papadopoulou and Özbayrak 2005).
Leanness index provides a direction to eliminate or at least reduce manufacturing wastes during the implementation of lean strategies towards continuous improvement. It also indicates the improvement achieved during the lean journey (Papadopoulou and Özbayrak 2005; Anvari et al. 2011). According to Wan and Chen (2008), the leanness is the stream-lined performance level in comparison with the optimum level (Wan and Chen 2008). It is believed by many that the reason for the failure of many of the current lean implementation practices is the lack of an appropriate method to measure and monitor the leanness levels before and after the implementation of lean strategies. Thus, the leanness measure models provide a tool to track, assess and compare the leanness level of the organisation during lean manufacturing transformation (Soriano-Meier and Forrester 2002; Behrouzi and Wong 2011).
To measure the leanness score of the organisation, several research studies identified factors for assessing leanness. These factors reflect the quality or quantity of the production process. Linguistic terms are used to evaluate the qualitative factors, and numerical terms are used for quantitative factors. Some research studies considered qualitative metrics to measure the leanness level (Vinodh and Chintha 2010, 2011; Taj and Morosan 2011; Vimal and Vinodh 2012) and some others used quantitative factors in their methods (Wan and Chen 2008; Amin 2012). In the current literature, all performance measures are assumed to be equally important, and the relationships between lean performance metrics were not considered. Therefore, there is a gap in the literature to investigate strategies to prioritise different performance metrics according to competitive strategies and manufacturers’ requirements and include the interrelationship between lean performance metrics in the current leanness assessment models. This can increase the accuracy of the leanness assessment approach and reflect the manufacturers’ needs in the overall leanness score.
The structure of this paper is as follows: Section 2 briefly reviews the current literature, then in Sect. 3, research methodology is explained. Section 4 presents the proposed methodology developed in this research to establish the interdependent relationship between performance metrics. Finally, in the last section some concluding remarks are made.
Literature review
According to Shah and Ward (2003), lean manufacturing can reduce the inventory level and manufacturing time by 50%. The lean production system has several effects on the organisation such as improvement in the production process, customer satisfaction and labour productivity and quality, manufacturing lead time, cycle time and cost reduction (Shah and Ward 2003; Bhasin and Burcher 2006).
Overview of performance measurement systems
Many organisations focus on the implementation of lean strategies without comparing the leanness level of the organisation before and after lean tool implementation, thus being unable to recognise the measurable performance enhancement. This leads to the failure of many of these companies to implement lean production systems successfully and achieve the potential benefits of lean strategies. This is mainly due to a lack of knowledge and tools to measure, assess and compare the leanness level before and after lean strategies implementation (Soriano-Meier and Forrester 2002; Behrouzi and Wong 2011; Bhasin 2011).
Several researchers attempted to present a quantitative measure of the leanness level of the organisation using the benchmarking method (Kojima and Kaplinsky 2004; Gurumurthy and Kodali 2009; Singh et al. 2010). For instance, Wan and Chen (2008) quantify the leanness level and agility using data envelopment analysis (DEA) and benchmarking against an ideal leanness boundary. In their method, they attempted to weight the performance indicators based on their relative importance (based on decision-makers’ judgement and surveys), which reflect the company’s strategy and needs (Wan and Chen 2008). However, in this study, only performance metrics related to time were considered and the manufacturing wastes were ignored. Also, it can be argued that the DEA score overestimated the leanness level by assuming the benchmarked practice to be 100% efficient.
To measure the leanness level of an organisation more accurately, quantitative methods have been developed using lean performance metrics (Nightingalea and Mizeb 2002). Some research studies defined individual metrics, manufacturing cycle efficiency (MCE), value-added efficiency (VAE) to measure the leanness score quantitatively (Fogarty 1992; Levinson and Rerick 2002). In another research study conducted by Katayama and Bennett (1999), quality and productivity were considered to measure the leanness level. However, in these methods, the manufacturing performance was assessed using individual metrics and did not measure the overall leanness score. Therefore, recently several studies attempted to integrate a group of performance metrics to measure the overall leanness score. In this regard, in a research study conducted by Detty and Yingling (2000), the benefits of lean strategies implementation were quantified using simulation-based methods in an assembly line. Also, in other research studies, a quantitative analysis framework and simulation approach were developed to recognise four performance metrics, which are Overall Equipment Efficiency (OEE), First Time Through (FTT), Dock-to-Dock (DtD) and Build-to-Schedule (BTS) ratio, and assess the efficiency of lean metrics in manufacturing organisations (Khadem et al. 2008; Gopinath and Freiheit 2012). Furthermore, Narasimhan et al. (2006) introduced delivery reliability and speed, conformance quality, cost performance, design quality, process and product flexibility as a performance metric to compare the effects of applying leanness and agility to the manufacturing process (Narasimhan et al. 2006). However, all of these methods did not consider the interdependent relationships between identified performance measures to provide a more accurate leanness index. According to Wan and Chen (2008) and Wong et al. (2012), it is essential to consider the interdependent relationships between different performance measures (such as cost, productivity, flexibility and quality) as a variation in one metric may lead to changes in others.
Leanness evaluation methods using fuzzy logic
Researchers have attempted to introduce fuzzy logic into the leanness measurement approach because it is believed that leanness and lean measurement cannot be predicted with certainty. The judgement can be different for describing the leanness level of each performance metric and can be explained with different grades such as lean, leaner or leanestFootnote 1. Therefore, fuzzy logic is used to deal with ambiguities in this area (Lin et al. 2006; Bayou and Korvin 2008; Vinodh and Chintha 2010; Balaji and Vinodh 2011; Behrouzi and Wong 2011). In this regard, one example of the fuzzy logic application in leanness assessment method is a research study conducted by Balaji and Vinodh (2011). They introduced a fuzzy-based leanness assessment model by using linguistic terms to evaluate performance metrics and their relative importance in terms of weighing. They defined fuzzy numbers for each linguistic value and measure using a fuzzy performance index (FPI) based on the defined numbers. Furthermore, Vimal and Vinodh (2012) assessed the leanness level of an organisation by using IF–THEN rules. They defined five enablers, thirty lean criteria and fifty-nine attributes to cover various aspects to measure the leanness score. In this method, the linguistic variables are employed based on experts’ opinion to rank the performance indicators and convert these linguistic terms to fuzzy numbers. In another research study, a leanness assessment model was developed by using a multigrade fuzzy approach (Vinodh and Chintha 2010). In their model, they defined the leanness index that can be calculated by multiplying the overall assessment factor and overall weightings. They asked for managers’ opinions on their leanness measurement model to determine assessment factors and weightings for each lean enables. However, these weighting methodologies do not explore the advanced methods of fuzzy logic to determine the performance ratings and allocate each metric their relevant weightings. In addition, different managing teams might have different opinions and estimations regarding the leanness level of each metric and its weighting. Therefore, using linguistic terms and human judgement in allocating weightings does not provide accurate results that reflect the leanness level of the organisation.
Bayou and Korvin (2008) introduced a systematic approach to measure the leanness level of an organisation. They also used fuzzy set theory in their measurement method that has more compatibility with the uncertainties of the leanness assessment. They applied their method to compare the leanness level of the Ford and General Motors companies by using the Honda Motor Company as a benchmark. However, using the benchmarking approach is useful, but finding the best practice in a particular area is difficult. Furthermore, they only considered financial performance indicators in their assessment model and they did not assume interrelationships between these metrics to measure the overall leanness. In another research study conducted by Behrouzi and Wong (2011), a fuzzy-based leanness assessment model was developed by using four performance categories and two performance metrics for each of the categories. However, their method lacks a proper weighting method for the performance metrics, and the eight performance metrics are assumed to have the same weighting (Behrouzi and Wong 2011). Also, these methods did not integrate the qualitative and quantitative methods to measure the overall leanness of the companies using the advanced fuzzy-logic function and present a single overall leanness level for the manufacturing firms.
Moreover, in the method developed by Amin (2012), the fuzzy logic theory was used to convert the collected data of each performance metrics into the fuzzy number and quantify the leanness score of the company. Their proposed fuzzy-based model integrated different performance measures to calculate the integrated leanness index. The result from their method is a single unit-less number that reflects the overall leanness score for the defined scope of the project. Amin (2012) assumed that all performance measures are equally important, and did not consider the interdependent relationship between performance metrics. However, performance metrics from different categories (such as cost, quality, productivity and safety) may not be taken equally important due to competing for business and operational strategies. Therefore, it is essential to develop a methodology that measures the overall leanness score of the production performance that considers the interdependent relationship of performance metrics. It is essential to prioritise different performance metrics and develop a weighted leanness assessment methodology.
Nowadays, many researchers understand the significance of the numerical measurement of organisation leanness index to compare and track the leanness value of the organisation for the existing performance and after implementing lean tools. Moreover, it can be understood from the literature that different leanness assessment approaches were used in different studies. These methods employed various performance metrics in the assessment method. However, the current literature does not provide a systematic approach that considers the interrelationships between lean performance metrics. Because each performance metric has a different behaviour, variation in one metric might have an effect on other metrics. However, the current literature lacks a valid methodology that measures the overall leanness of the organisation considering the interrelationships between lean performance metrics from different groups. These methods consider all performance metrics to be equally important during their analysis. Although these methods can be useful in some situations, none of them offers a comprehensive method that synthesises both quantitative and qualitative metrics based on their interrelationships due to different competitive strategies. For instance, a reduction in manufacturing costs can lead to a reduction in the product’s quality, and enhancing labour productivity can reduce the manufacturing time. Also, decision-makers and managers may desire to prioritise the performance indicators and allocate weightings based on their relative importance (Wong et al. 2012). Therefore, it is critical to predict and consider their influences and interrelationships in the leanness assessment model (Wong et al. 2012). Failure to consider the interaction of performance indicators may lead to the inaccurate calculation of the overall leanness score. When each performance metric is allocated its relevant weighting, the leanness score can be compatible with changing manufacturing strategies (Wan and Chen 2008).
Problem statement
Many research studies in this area attempted to measure the leanness score of each performance metric independently. However, few researchers were able to synthesise these leanness values into an overall leanness index by using various techniques, such as fuzzy logic as used in solving uncertain and complex problems. This is mainly because individual performance metrics that are measured independently cannot accurately reflect the leanness level of an entire organisation.
To integrate the leanness level of performance metrics and measure the overall leanness, an equal interrelationship between these indicators was assumed by several researchers. However, fluctuation of one metrics could have an effect on other metrics and consequently on the overall leanness level. Therefore, considering the interdependent relationships and relative importance weights between lean performance metrics can assist manufacturers to assess and calculate the leanness index of their production process more accurately (Wong et al. 2012). Moreover, when weightings are assigned for lean performance metrics, it should reflect an organisation’s requirements more accurately (Wan and Chen 2008). To conclude, in order to develop an effective leanness assessment model, one needs to understand how different lean performance metrics and performance measures categories interrelate with each other. Naturally, these interrelationships are inseparable. For instance, producing high-quality products increases the manufacturing cost and the amount of resources required. Also, extending the customer delivery time require additional operating costs in the organisation. In this regard, a weighted leanness assessment model should be developed to consider the interdependent relationships between performance indicators for assessing the overall leanness index of the organisation. However, these interrelationships become more complex during lean application throughout the company synchronously.
This research aims to develop a weighted leanness assessment methodology that considers the interdependent relationships between identified performance metrics. In order to achieve this objective, this research seeks to answer the question “How can one develop a weighted leanness measurement method that considers the interdependent relationships between performance metrics?”, by developing a mathematical model using fuzzy set theory to allocate weightings to each performance metric. The proposed methodology will provide a more accurate overall leanness index and reflect different competitive strategies of the organisation and manufacturers’ needs.
Research methodology
To meet the objective of this research, a weighted leanness measurement methodology using fuzzy logic is presented that considers the interrelationships between lean performance measures in the production process. The proposed method measures the overall leanness of the organisation by considering the interrelationships between performance indicators (both qualitative and quantitative). This method further extends the previous methodology for assessing the overall leanness index of the manufacturing firms by providing a more accurate index for overall leanness measurement.
The fuzzy membership function of each performance metric is evaluated by using fuzzy set theory and linguistic terms (both quantitative and qualitative metrics). In this research, triangular fuzzy numbers are used due to their simplicity in computation. Then, a fuzzy-based analytic network process (ANP) approach is used to establish the interrelationships between lean performance measures and performance metrics and assign the relative importance weightings to these performance metrics. Finally, the overall leanness level of the manufacturing process is measured which considers the importance weightings of the metrics. MATLAB programming and Excel spreadsheet are used to develop the proposed methodology. The main steps of the proposed leanness assessment model are as below:
-
1.
Determine fuzzy numbers for both qualitative and quantitative measures
-
2.
Determine lean ranges for both positive and negative performance metrics
-
3.
The uniformity membership function to fuzzify multiple memberships
-
4.
Construct the relationship network between performance measures and metrics using the ANP method
-
5.
Calculate the relative importance weighting for each pairwise comparison matrix
-
6.
Determine triangular fuzzy scale for the importance weighting of measures and metrics
-
7.
Commutate the overall leanness index considering the relative importance weightings for each performance metric
the proposed weighted leanness measurement methodology
The details of the proposed methodology that determines the overall index for the leanness level of the organisation are provided in this section.
Converting raw data into fuzzy numbers for each performance metric
In this step, in order to convert raw data (both linguistic and numerical data) to a fuzzy triangular numbers, the method developed by Amin (2012) is used. The raw data of each performance metrics are presented in Table 1.
For performance metrics which indicate benefit, higher membership values (leanness value) are better; and for performance metrics which indicate cost, lower membership values are better. Figures 1 and 2 illustrate the relationship between the ideal and optimum leanness aim for the cost and benefit performance metric goals. In these figures, the x-axis shows the performance metrics and the y-axis shows the corresponding membership values. In an ideal situation, the manufacturing system operates without any production wastes and non-value-adding activities. Therefore, an ideal manufacturing system, the performance metrics have a maximum membership value or ideal value (i.e. 1) at point b. However, in a real production situation, some manufacturing wastes exist and the RR′ and GG′ show its triangular fuzzy numbers.

Comparison of ideal and optimum leanness points for negative metrics

Comparison of ideal and optimum leanness points for positive metrics
The target of improvement for both types of performance metrics is to achieve the maximum membership value b. This is the target point for any manufacturer that both cost and benefit metrics can achieve 1 or 100%. Therefore, the ideal lean range for positive behaviour metrics is from point a to point b and similarly for negative metrics is from point c to b.
It is however not possible to achieve the ideal leanness (100% leanness) because the perfect production system without any wastes does not exist in reality. Therefore, in a realistic situation, the value of metrics variable (the membership function value) is decreased from 1 to P. This is mainly due to the existence of manufacturing wastes in the organisation. Thus, P is defined as a realistic leanness value (Chang et al. 2006; Wang et al. 2009; Amin 2012). Table 5 provides the lean ranges and triangular fuzzy numbers for each performance metrics.
Correlation coefficient values of performance metrics
To develop a meaningful overall leanness index, it is essential to recognise how lean performance metrics are interrelated. In addition, conflicts of interest, and incongruent objectives in different sections of the organisation can occur as a result of lean implementation, which can negatively affect the manufacturing performance. Therefore, determining the interrelationships of performance metrics through a common platform, such as a good leanness value, is essential to reduce the conflicts’ impacts and thus measure the integrated leanness level. In this respect, a common platform should be developed to examine the interrelationships between lean metrics from the perspective of lean focus.
The authors have used MATLAB to illustrate the correlation coefficient of the selected performance metrics. Thereupon, the correlation coefficient values of these metrics are calculated to measure the strength and the direction of a linear relationship between two performance variables. The value of the correlation coefficient varies between − 1 and + 1 with a positive value indicating that an increase in one variable is linked to an increase in the other.
Table 2 presented the correlation coefficient values. This table illustrates the systematic matrix, so only the upper triangular portion of the matrix was studied because these values are invertible. A correlation of zero means, there is no relationships between the two variables. In addition, when the correlation is positive, an increase in one variable leads to an increase in the value of other variables. For instance, the correlation coefficient value of supplier responsiveness and on-time delivery is 0.58574, thus as the value of supplier responsiveness increases, the value of on-time delivery increases. (The variables move together.) Also, when the correlation coefficient value is negative, such as − 0.72356 for manufacturing lead time versus supplier responsiveness, as the value of one variables increases, the value of the other variable decreases, and vice versa. In addition, the correlation coefficient value greater than 0.8 indicates strong interrelationships among two variables and the correlation coefficient value less than 0.5 is generally considered as a weak interrelationship (Daya 2004).
Furthermore, in order to represent the graphic interrelationship between performance metrics, the contour plot is used (Figs. 3, 4 and 5). In these plots, the twelve performance metrics are for X and Y variables and the third variable is for the counter levels, which are plotted by using colours to illustrate the magnitude of the interrelationships between two variables. These plots are indicated for a different threshold of the absolute correlation coefficient value. These thresholds are specified based on the requirements and interests of the users.

Contour plot of the magnitude of the correlation coefficient of 12 performance metrics above 0.7

Contour plot of the magnitude of the correlation coefficient of 12 performance metrics above 0.8

Contour plot of the magnitude of the correlation coefficient of 12 performance metrics above 0.9
Figures 3, 4 and 5 is used for more precise analysis of these interrelationships as it illustrates the correlation coefficient absolute value greater than 0.7, 0.8 and 0.9, which are recognised as significant correlation coefficient values. These interrelationships are illustrated in green and yellow colours. For instance, overall equipment efficiency and customer satisfaction have very high interrelationships with absolute correlation coefficient value greater than 0.9.
Also, setup time has a high relationship with overall equipment efficiency (OEE) and customer satisfaction with absolute correlation coefficient value greater than 0.8. Therefore, in order to demonstrate the correlation coefficient values greater than the specific value, different threshold can be specified. Moreover, the MATLAB code presents the list of pair of performance metrics for each threshold. The results associated with the correlation coefficient values greater than 0.7 are presented in Table 3. From this table, it can be inferred that the setup time has a strong interrelationship with OEE, customer satisfaction, and supplier responsiveness. Also, OEE is interrelated with customer satisfaction and supplier responsiveness, and manufacturing lead time and customer satisfaction are related to supplier responsiveness.
However, these plots have determined that the selected performance indicators have interrelationships, and should influence each other during lean implementation. Therefore, it is vital to establish the weighting approach to prioritise them as well as consider their interdependencies in lean measurement model. In the next section, the fuzzy-based analytic network process (ANP) approach is explained to allocate the relative importance weightings to each identified performance metrics.
Fuzzy-based analytic network process (ANP) approach
This section explains the method for establishing the interrelationships between lean performance measures and performance metrics in assigning relative weightings to each performance metric in a fuzzy-based leanness assessment model. Previously, several methods have been used to determine the weightings of performance indicators. However, most of them were not successful in capturing human perceptions effectively. In this respect, Saaty and Takizawa (1986) introduced the analytic hierarchy process (AHP) approach and the more general form of that, the analytic network process (ANP), to generate the relative importance weightings among decision elements. Both methods use matrix manipulation approaches. The AHP helps decision-makers to break down a complex problem into a form of simple hierarchy and then establish relative weightings between decision levels using a sequential process of pairwise comparison. In this approach, each element is supposed to be independent and pairwise comparison is used to derive the relative importance ratio of the elements in the level of hierarchy associated with an element of the preceding level.
The ANP approach is the generalisation of the AHP approach that allows more complex interrelationships between different criteria to be analysed. In the AHP approach, a unidirectional hierarchical relationship among the decision attributes is utilised, while the ANP approach uses a dynamic multi-directional relationship between these elements. In the ANP, a feedback relationship between different levels is allowed to reconcile the requirements and desires of all stakeholders. Therefore, the ANP is an effective method in situations where the interactions among the elements of the system have a network structure. Contrary to the AHP that uses a strict hierarchical structure, the ANP uses ratio scale measurements based on pairwise comparisons. Therefore, in the ANP, a level can directly or indirectly dominate and be dominated by other decision criteria and levels. In addition, the ANP approach uses a systems-with-feedback to create the decision problem and to show how to investigate inner and outer dependence with feedback. Inner dependence is interdependence between components combined with feedback among components, while outer dependence is relationship among components associated with feedback circuits.
In this approach, decision-makers express their preferences regarding each attribute in different ways because human judgement varies from person to person. There is always a certain degree of uncertainty and ambiguity in human perception and their judgement described by imprecise language such as equally, moderately and extremely. Therefore, fuzzy set theory is used to deal with this vagueness and imprecision by tackling ambiguities in the process of linguistic assessment of information. Fuzzy set theory proposes a different method to quantify the qualitative judgments. In this research study, triangular numbers are used to evaluate the decision-makers’ preferences. In fuzzy-based ANP, the linguistic terms are converted into triangular fuzzy numbers to establish pairwise comparison matrices (Chang 1996; Chan et al. 2003). In this regard, the ANP approach consists of two main steps:
-
Step 1: construction of the relationship network among lean performance metrics
-
Step 2: calculation of the relative importance weightings of each metric and determination of the priorities of the lean performance metrics
Construction of the relationship network
In this step, the structure of the problem is constructed by establishing the interaction network between all performance measures and metrics. For instance, when performance metric 1 (M1) depends on performance metric 2 (M2), the relationship between these two elements is represented by an arrow from M2 to M1. Pairwise comparisons and a supermatrix are used to evaluate all these relationships. The supermatrix is developed to calculate the overall priorities, vectors and cumulative influence of each performance metric on every other metric with which it interacts (Saaty and Takizawa 1986).
The weightings of lean performance measures (PM) are represented by the vector w1, and w2 is a matrix that represents the relationship between performance metrics with respect to each lean performance measures. w3 is a matrix that denotes the interdependent relationships between lean performance measures with respect to each measure. Similarly, w4 denotes the interdependencies of lean performance metrics with respect to each metric.
The primary inputs required to calculate \( w_{1} \), \( w_{2} \), \( w_{3} \) and \( w_{4} \) in the ANP technique are pairwise comparison matrices of each elements within each cluster. These matrices are similar to those used in the AHP method (Saaty 1980). In the conventional AHP approach, a discrete scale is used for pairwise comparison. However, human judgements and assessments are usually subjective and imprecise. Therefore, in this research study, all the elements of pairwise comparison matrices are triangular fuzzy numbers (li, mi, ui). In all pairwise comparison matrices, the element aji represents the comparison of row component i with column component j. Also, the reciprocal value \( {\raise0.7ex\hbox{$1$} \!\mathord{\left/ {\vphantom {1 {a_{ij} }}}\right.\kern-0pt} \!\lower0.7ex\hbox{${a_{ij} }$}} \) is allocated to the \( a_{ji} \) element and (1, 1, 1) is assigned to the element \( a_{ii} \). Based on these pairwise comparisons, the following supermatrix is obtained:

Fuzzy ANP calculation to assign relative importance weights to each performance metric
As mentioned earlier, linguistic data are used to calculate pairwise comparison matrices, \( w_{1} \), \( w_{2} \), \( w_{3} \) and \( w_{4} \). Previously several methods were developed to determine the interrelationships using fuzzy ANP and fuzzy AHP (Van Laarhoven and Pedrycz 1983; Buckley 1985; Cheng 1997; Leung and Cao 2000). For this section, to complete the calculation of pairwise comparison and relative importance weightings, the method developed by Cheng (1997) is used in this research study because it is easily compared to other fuzzy AHP methods and conventional AHP methods.
Assume \( x = \left( {x_{1} , x_{2} , \ldots , x_{n} } \right) \). is a set of objects and \( g = (g_{1} , g_{2} , \ldots , g_{m} \).) is a set of goals. According to the method developed by Chang 1996, an extent analysis for each object with respect to each goal \( g_{i} \) is performed. If \( M_{{g_{i} }}^{j} ; j = 1, 2, \ldots , m; i = 1, 2, \ldots , n \) are the triangular fuzzy numbers, m extent analysis values are obtained for each of the n objects.
In the next step, the value of fuzzy synthetic extent (\( S_{i} ) \) with respect to the ith is calculated using the following equation:
In this equation, to obtain the \( \sum\nolimits_{j = 1}^{m} {M_{{g_{i} }}^{j} } \), the addition operation of fuzzy numbers from m extent analysis values for a particular matrix is performed:
And to obtain \( \left[ {\sum\nolimits_{i = 1}^{n} {\sum\nolimits_{j = 1}^{m} {M_{{g_{i} }}^{j} } } } \right]^{ - 1} \), the fuzzy addition operation of \( M_{{g_{i} }}^{j} \), \( j = 1, 2, \ldots , m \) is performed (Chang 1996; Lee et al. 2009; Shaw et al. 2012):
In the next step, the degree of possibility of \( M_{2} = \left( {l_{2} ,m_{2} ,u_{2} } \right) \ge M_{1} = \left( {l_{1} ,m_{1} ,u_{1} } \right) \) is defined as:
Equation (6) can be represented as follows:
where d is defined as the highest intersection point d between \( \mu_{{M_{1} }} \) and \( \mu_{{M_{2} }} \), which is shown in Fig. 6.

Intersection between M1 and M2
A convex fuzzy number can be defined as:
Assume that
for k = 1, 2, …, n; k\( \ne \)i. Then, based on the above equation, the weight vector of the factors is calculated by:
Finally, after normalisation, the priority weights are as follows:
where W is not a fuzzy number.
Overall leanness index of the manufacturing process
The fuzzy triangular values using uniformity conversion rules and fuzzy weights are calculated for each performance metrics using fuzzy ANP approach. The overall leanness score is determined using the centroid defuzzification equation (Wang and Mendel 1992; Behrouzi and Wong 2011):
In this equation, \( \mu_{ijk} \) is performance metric membership value and \( w_{ijk} \) is the relative importance weighting for each performance metric. The relative importance weightings add up to 1, so the overall leanness index is calculated by the sum of the values that provide a weighted average leanness value index.
Numerical example
In this section, the developed weighted leanness measurement methodology using fuzzy set theory is illustrated in a case study to evaluate the leanness of the organisation’s performance.
Background of case study company
The HMCFootnote 2 company is one of the leading modular manufacturers in Australia. The company was founded in 1912 and has over 1400 employees. HMC has expanded its market to construct several types of buildings for different sectors such as mining infrastructure, education, mixed-used, health, residential, commercial, hospitality and tourism, retail, community, government and industrial. In addition, the company provides a variety of services including construction, design, cost planning, project finance, civil works, green star, quality assurance, cranes and hoists, modular, heritage and restoration, facilities management and training. The company uses modular construction to describe a building process regardless of uncertainties in weather, site conditions and contractor relations. The HMC company has three large modular manufacturing facilities in Australia. The modular facility selected for the purpose of this study can produce 3000 rooms per year with varying specifications to cater for acoustic control, energy efficiency, fire separation and a general industry requirement for a higher standard of accommodation to assist mining companies maintaining staff in remote areas.
Defining project scope
In this research study, the lean management team decided to apply the proposed leanness assessment tool for the QMCFootnote 3 modular line. The selected modular line is a manufacturing line for producing prefabricated modules. In addition, station 4 of the QMC modular construction manufacturing line was selected as the case study manufacturing process. After discussion with the management team of the case study company, it was recognised that this line could achieve significant benefits from implementing lean strategies. A QMC modular line is a manufacturing line for producing prefabricated modules. This line is designed to manufacture prefabricated units for a two-storey student accommodation building. Each module is built under the roof in the factory and shipped to the site. These units are stored inside the factory and labour and material goes through a construction process, similar to the conventional construction process. The lean team used a value stream mapping (VSM) tool to draw the current state map of this manufacturing line. The main purpose of this step was to identify a bottleneck station for implementation of the proposed methodology and as well as identifying performance metrics for the selected station.
Figure 7 shows an overall picture of the QMC modular manufacturing line of the HMC company with critical information of the current operations. In this figure, C/T refers to production cycle time of the station, which is a process of cycle time that a product must pass to become a final product. C/O refers to changeover time that is defined as the process of changing a line or machine from running one product to another. In the current state map, raw material inventories are stored for three to four days before being withdrawn for the manufacturing process based on the weekly schedule. The QMC manufacturing line starts from the loading chassis and installation of floor sheets, wall and roof frames at Station 1 as well as installing the electrical and mechanical services. Then, at Station 2, the internal ceilings and external walls are installed. Next, roof sheeting, external walls sheeting and external windows, shower wall systems and floor coverings are installed at Station 3. After completing the previous tasks, external and internal doors and leads are inserted at Station 4, the internal door units are painted, the underfloor is insulted and the electrical and mechanical rough conduits are installed. At workstation 5, underfloor hydraulics, joinery, shower screens and sundry hardware are installed. The internal and external parts are caulked and internal and external defects are rectified at Station 6. In this station, each module is wrapped and strapped for transportation. Finally, the modules are stored after conducting a QA final inspection (Station 7).

QMC manufacturing line’s current state map
From the current state map (Fig. 7), it can be seen that the production cycle time (C/T) is much lower than the Takt time (T = 480 min) in some stations. This shows that the production capacities of these stations are higher than the demand. Takt time (T) is the maximum time that a modular unit can stay in one station, which is calculated by dividing the net time available for work (\( T_{a} \)) by customer demand (D). However, it can be seen from Fig. 7 that the completion rates in those stations were low. Completion rate refers to the percentage of modules that are moving to the next station, while all tasks are completed. For example, at Station 3, the average cycle time is 400 min, which is 17% lower than the Takt time. However, the completion rate at this station is 80%, meaning that one of every five modules moves to Station 4 uncompleted. The completion rate at this station is noticeably low considering that the cycle time in this station is close to the Takt time. With regard to Station 5, the completion rate is 60%, meaning that almost half of all modules are unfinished when moving to the next station. This situation can affect the production process and increase different kinds of waste in the manufacturing company, such as unneeded movements by labourers as a result of not completing all tasks. For example, if electricians at workstation 4 cannot finish the rough conduit, they should finish their tasks at Station 5, which requires them to move and carry their equipment and materials between these two stations. Also, as they spend time to complete their tasks at Station 5, they would have less time at Station 4 for the next modules. In addition, workers at Station 5 have less time to complete their job before the module is moved to the next station as they were idle at the beginning. The relationship between the seven stations in the QMC manufacturing line is shown in Fig. 7.
The lean team and the HMC management team decided to concentrate on Station 4 as it is believed that this station is a barrier for this modular manufacturing line due to low efficiency in this station and interruption of the performance. Figure 8 shows the manufacturing line at Station 4 which is examined in detail to understand the main operations of this workstation. The process in station 4 consists of the supplier (station 3), the customer (station 5) and the manufacturing process. The average manufacturing period to produce one unit of final product is 480 min and with $26,500 average total cost per unit of a module. The number of orders is 20 modules of two-storey student accommodation that started its production process in the QMC modular construction line. However, despite the considerable competitive advantages of modularisation, the products of HMC company are usually 10–20% more expensive than their counterparts built on-site. Therefore, HMC company was limited to customers as government, wireless providers and education sectors that are less concerned about cost. Like other modular manufacturers, the reason for the high cost of their products is mainly due to their failure to take advantage of modern manufacturing technologies to improve their production process. Hence, it is very difficult for the organisation to compete in their market, sustain production and meet customer requirements. In this regard, the company was keen to adopt lean manufacturing principles and implement one of the suggested lean initiatives to take the first step in improving the manufacturing performance of the company.

Current state map of Station 4
Identifying lean performance metrics
After defining the study scope, the relevant performance metrics should be selected for the identified scope. These performance measures should reflect the organisation’s goals of evaluate the production performance effectively. Selecting a set of performance metrics can add more value to the organisation and the customer. However, for effective evaluation of the performance, the number of established performance metrics should be minimised as much as possible and adoption of these metrics should be related to the organisation’s characteristics and specifications. In this step, a set of appropriate lean performance metrics, from both cost and benefit metrics, is identified for the scope of the study. The cost metrics are negatively correlated with the overall performance of the organisation, while benefit metrics indicate the positive impacts on the overall leanness. The identified lean performance metrics were cost per part, total inventory cost, transportation cost, setup time, manufacturing lead time, labour productivity, overall equipment efficiency, rework rate, customer satisfaction, number of work-related injuries, supplier responsiveness and on-time delivery. To evaluate the improvement achieved by implementing the selected lean techniques, it is important to evaluate and assess the leanness status of the existing performance in comparison with the improved process. Therefore, this section developed the weighted leanness evaluation model that measures the integrated leanness score by considering the interdependent relationships between lean performance metrics.
Data collection
Numerical and linguistic terms are used to measure the quantitative and qualitative metrics, respectively. The relevant data for two types of performance metrics were collected from the financial and commercial, production and engineering, quality control, supply chain and marketing departments. Table 4 presents eight fuzzy linguistic terms to evaluate qualitative variables (Herrera et al. 2000). To determine the fuzzy triangular numbers for each metric, a method developed by Amin (2012) was used from ten observations that have been taken for station 4 at different situations or the same situation at different times. Table 5 presents triangular fuzzy numbers for each performance metrics, and Fig. 9 shows the graphical representation of the membership function for each performance metric.

Membership function of selected performance metrics
Assign fuzzy-relevant weights to each performance metric using ANP method
In this section, the proposed method for determining the relative importance weightings of performance metrics is presented. The fuzzy analytic network process (ANP) is explained in Section C.
- Step 1:
-
The ANP network system is created by relating lean performance measures and lean performance metrics. Figure 10 illustrates the ANP interrelationship network between lean performance measures and metrics
Fig. 10 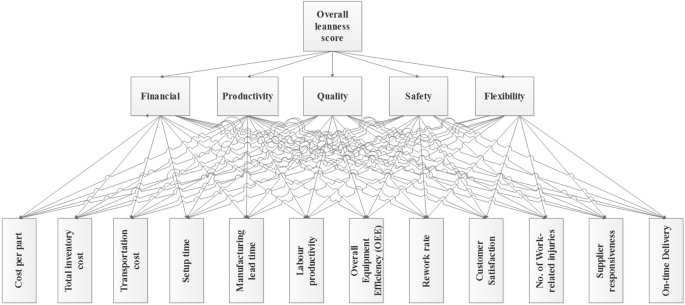
ANP-based framework for lean performance measures and performance metrics
- Step 2:
-
The triangular fuzzy conversion scale is developed. The ranges of fuzzy triangular scales are from equally important/preferred (1, 1, 1) to extremely important/preferred (8, 9, 9). The remaining fuzzy values are presented in Table 6
Table 6 Fuzzy pairwise comparison scale - Step 3:
-
If it is assumed that there is no dependence among lean performance measures, then the pairwise comparison among lean performance measures with respect to lean goals is established using the linguistic variables in Table 6. The comparison results are in Table 7
Table 7 Pairwise comparison of lean performance metrics assuming no dependence among them

Based on the pairwise comparison and the fuzzy conversions scale in Table 6, the following eigenvector for the lean performance measures is obtained by performing the extent analysis of fuzzy AHP methodology with respect to the lean goal:
- Step 4:
-
In this stage, it is assumed that there is no dependence among performance metrics; thus, metrics are compared with respect to each performance measures to yield each column of Table 11. For instance, one possible question to obtain the relative importance of performance metrics with respect to the financial measure is, “What is the relative importance of total inventory cost when compared to rework rate with respect to financial measures?” This yields strongly important as represented in Table 8. The degree of relative importance weightings for the metrics for the remaining lean performance measures is calculated in a similar way and presented in Table 9
Table 8 Relative importance of performance metrics associated with financial measure Table 9 Column eigenvectors of performance metrics with respect to each lean performance measure - Step 5:
-
In this step, the inner dependence among lean performance measures is determined by analysing the impacts of each lean performance measure on other measures using pairwise comparison. For example, one possible question is, “What is the relative importance of financial measure when compared with the quality measure on controlling productivity measure?” The resulting eigenvectors obtained from the pairwise comparison are presented in Table 10
Table 10 Inner dependence matrix of lean performance measures - Step 6:
-
In this step, the interrelationships between performance metrics are determined. As previously accomplished for lean performance measures, the inner dependencies are determined and the required pairwise comparison is performed. In this respect, one example for questions used for this step is, “What is the relative importance of total inventory cost when compared with on-time delivery on controlling the cost per part?” The relative importance weightings of the selected performance metrics obtained from the pairwise comparison are presented in Table 11
Table 11 Column eigenvectors of performance metrics with respect of each performance metric - Step 7:
-
In this step, the interdependent priorities among lean performance metrics are obtained:
- Step 8:
-
In this step, the interdependent priorities of the selected performance metrics are calculated as follows:
- Step 9:
-
Finally, the overall priorities of performance metrics, \( w^{\text{ANP}} \), reflecting the interrelationships between the selected performance metrics are calculated as follows:
The fuzzy ANP analysis results show that the most important performance metric is cost per part (generated with the relative importance value of 0.19), which is more important than all the other performance metrics. Total inventory cost with a relatively important weighting of 0.18 is the second-most important performance metric. Supplier responsiveness and number of work-related injuries are the least important performance metrics according to the fuzzy ANP analysis.
Weighted overall leanness index
The overall leanness value considering the interrelationships between lean performance metrics is calculated using (9). In this regard, Table 12 presents the leanness values and relative importance weightings of each performance metric as well as the optimum leanness values and the overall leanness index.
It can be seen from Table 12 that the overall leanness value of station 4 in the QMC modular manufacturing line is 24.83 out of 100 without considering the relative importance weightings of performance metrics. In addition, this table shows the individual leanness value of each performance metric. However, as mentioned earlier, lean performance metrics can influence each other. Therefore, it is important to consider the interdependent relationships between performance metrics and allocate relative importance values to each metric when assessing the overall leanness of the manufacturing line. In this regard, this research study proposed the weighted leanness assessment model that considers these interdependent relationships to assess the overall leanness index. Hence, the overall leanness value of station 4 based on the proposed model in this research is 23.87 out of 100. Also, the individual leanness score of each metric is presented in Table 12. The individual leanness value for cost per part, total inventory cost, transportation cost, setup time, manufacturing lead time, labour productivity, overall equipment efficiency, rework rate, customer satisfaction, number of work-related injuries, supplier responsiveness and on-time delivery are 0.66, 0.65, 0.61, 0.60, 0.59, 0.63, 0.69, 0.57, 0.62, 0.58, 0.59 and 0.60, respectively.
Discussion
Figure 11 shows the current and optimum leanness values of individual performance metrics considering equal relationships between identified performance metrics. In addition, Fig. 12 shows current leanness and optimum leanness values of performance metrics considering interdependent relationships between metrics at station 4 in the QMC manufacturing line. It can be seen from these two figures that there is a gap between the current leanness level and the optimum leanness for station 4 at the QMC manufacturing line. Therefore, the targets for the manufacturing company is to achieve the optimum leanness level, measure the new optimum leanness level and define a new target for implementing further appropriate lean strategies.

Comparison of current and optimum leanness value considering equal interrelationships between performance metrics

Comparison of current and optimum leanness value considering interdependent relationships between performance metrics
From Fig. 11, it can be seen where equal interrelationships between lean performance metrics are considered, total inventory cost, customer satisfaction and rework rate demonstrate the lowest leanness score among other metrics, whereas the number of work-related injuries and supplier responsiveness have the highest leanness value. However, different leanness indexes are obtained when considering the interdependent relationships between metrics by multiplying the leanness value of metrics by the relative importance weightings. Thus, supplier responsiveness and customer satisfaction have the lowest leanness values when the interrelationships between lean performance metrics are considered and cost per part and transportation cost are highest in comparison with other metrics. This clearly shows that the proposed weighted leanness assessment methodology provides more accurate results by considering the interdependent relationships between different performance measures.
Moreover, in this research, the optimum leanness score at an optimum point ‘b’ is calculated for selected performance metrics with equal and unequal interrelationships between performance metrics. The overall optimum leanness index considering equal relationships between performance metrics is 0.6158. However, this value changes to 0.6305 when different importance weightings are assigned to each performance metric. After reaching the optimum leanness level, the company will revise the target by repeating the proposed method and implementing other suggested lean techniques to reach the new leanness target. This is because lean should be seen as a direction for improvement rather than as an end situation to be reached. Also, the proposed methodology calculates a more accurate optimum leanness score for the manufacturing process. This is mainly due to considering the relative importance of each performance metrics according to manufacturers’ needs.
The overall leanness score provides a more accurate direction for manufacturers to evaluate the lean performance continuously in their improvement programme. The overall leanness index in this methodology is the result of the summation of the individual leanness scores of each performance metric (sub-metrics) that considers their relative importance weightings. The proposed weighting method in this research study allows for more complex relationships between lean performance measures and performance metrics. The interaction or interrelationships can be controlled through the coupling of phases that comprise the hierarchies of performance measures and performance metrics. The integrated leanness index can be synthesised through the weighted priority of the performance metric through the evaluation of the supermatrix in fuzzy ANP.
When analysing and identifying the problem areas, the worst leanness score can be tracked layer by layer. It should also be considered that the leanness score of the process should be measured and analysed during the implementation of lean strategies to find any irregularities and unsatisfactory progress so managers can identify the problem immediately.
Conclusion
This research study has developed and proposed a weighted leanness measurement methodology using fuzzy logic that considers interdependent relationships between performance metrics to provide more accurate leanness score of the organisation. The developed measurement approach in this research can be used to assess the effectiveness and efficiency of lean strategies implementation. Implementing lean tools and techniques can tackle specific problems in the production systems and achieve much more transparent performance improvement. In this respect, performance metrics are identified to quantify the improvement and justify lean manufacturing implementation. It is vital to quantify the leanness score of a production system to measure the performance and track the efficiencies and effectiveness of lean initiatives. However, individual performance metrics cannot represent the overall leanness of the manufacturing system as they focus on the specific aspect of performance. For instance, quality metrics focus on product quality and on-time delivery, while financial metrics focus on manufacturing and transportation costs. In addition, different performance metrics interrelate with each other; e.g. financial metrics are affected by the quality and productivity metrics. Therefore, it is essential to understand and appreciate these performance metrics and determine the interrelationships between these metrics. In order to synthesise the various aspect of performance, an integrated measure was developed to consider the interdependent relationships between lean performance measures and performance metrics.
It is proposed that an integrated leanness index can justify the trade-offs between different lean initiatives and offers an overall leanness index of the production performance. In addition, the selected performance metrics are interrelated with each other and needs to be considered when measuring the overall leanness of the manufacturing performance. The developed weighted leanness measurement methodology in this research study offers a more precise integrated approach to measure the overall leanness index of the manufacturing performance based on the interrelationships between performance metrics. This measurement approach is considered to be in the complex decision environment based on different opinions and requirements of stakeholders and manufacturers.
The leanness index is developed to measure the existing level of leanness in the production process and assess an optimum level of leanness. This research has developed a weighted fuzzy-based leanness assessment model that considers the interdependent relationships between lean performance metrics to measure the leanness state more accurately. Finally, this research study has demonstrated the proposed lean strategies selection model and the leanness assessment models and methodology applied in a case study with a real-life industrial context.
This research study has made a major contribution towards an understanding of lean manufacturing. However, there are some limitations in this research. The probability of failure to calculate the risk cost of implementing lean strategies is difficult to specify and can be predicted based on past experiences with similar situations. Therefore, there might be some inaccuracies in calculating the risk cost associated with lean strategies implementation. In addition, in this research study, fuzzy triangular numbers were used to determine the relative importance weightings among performance metrics and to measure the leanness score of each metric. However, triangular fuzzy numbers may not be suitable and applicable for all industrial applications. Therefore, based on the research findings and outcomes, the proposed models and methodology in this research can be further enhanced by estimating the risk cost associated with lean implementation requires more information on failure from the field. Therefore, more information should be obtained to predict the risk cost of lean implementation more accurately and determining the correct fuzzy numbers for particular applications in the ANP approach. Further research is required for identifying more accurate fuzzy numbers in the fuzzy ANP approach in various applications and industries. Finally, more real-life case studies to validate the proposed models and methodologies can provide a further extension of this research.
Notes
Another example is the level of customer satisfaction that can be assessed by using different terms, such as high, very high or highest. These can be interpreted differently and the judgment might be varied for each person.
Due to confidentiality reasons, the research cannot disclose the company name and HMC is an assumed name
QMC is an assumed name to for the selected manufacturing line and due to confidentiality reasons it cannot be disclosed.
References
Amin MA (2012) A systematic approach for selecting lean strategies and assessing leanness in manufacturing organizations. Queensland University of Technology, Brisbane City
Anvari A, Ismail Y, Hojjati SMH (2011) A study on total quality managament and lean manufacturing: through lean thinking approach. World Appl Sci 12(9):1585–1596
Balaji SR, Vinodh S (2011) Fuzzy logic based leanness assessment and its decision support system. Int J Prod Res 49(12/13):4027–4041
Bayou ME, Korvin AD (2008) Measuring the leanness of manufacturing systems—a case study of Ford motor company and general motors. J Eng Technol Manag 25(4):287–304
Behrouzi F, Wong KY (2011) Lean performance evaluation of manufacturing systems: a dynamic and innovative approach. Procedia Comput Sci 3:388–395
Bhasin S (2011) Measuring the leanness of an organization. Int J Lean Six Sigma 2(1):55–74
Bhasin S, Burcher P (2006) Lean viewed as a philosophy. J Manuf Technol Manag 17(1):56–72
Buckley JJ (1985) Fuzzy hierarchical analysis. Fuzzy Sets Syst 17(3):233–247
Chan FTS, Chan HK, Chan MH (2003) An integrated fuzzy decision support system for multicriterion decision-making problems. Proc Inst Mech Eng Part B J Eng Manuf 217(1):11–27
Chang DY (1996) Applications of the extent analysis method on fuzzy AHP. Eur J Oper Res 95(3):649–655
Chang SL, Wang RC, Wang SY (2006) Applying fuzzy linguistic quantifier to select supply chain partners at different phases of product life cycle. Int J Prod Econ 100(2):348–359
Cheng CH (1997) Evaluating naval tactical missile systems by fuzzy AHP based on the grade value of membership function. Eur J Oper Res 96(2):343–350
Daya S (2004) Correlation coefficient. Evid Based Obstet Gynecol 6(2):48–50
Detty RB, Yingling JC (2000) Quantifying benefits of conversion to lean manufacturing with discrete event stimulation: a case study. Int J Prod Res 38(2):429–445
Fogarty DW (1992) Work in process: performance measures. Int J Prod Econ 26(1–3):169–172
Gopinath S, Freiheit TI (2012) A waste relationship model and center point tracking metric for lean manufacturing systems. IIE Trans 44(2):136–154
Gurumurthy A, Kodali R (2009) Application of benchmarking for assessing the lean manufacturing implementation. Benchmarking Int J 16(2):274–308
Herrera F, Herrera-Viedma E, Martı́nez L (2000) A fusion approach for managing multi-granularity linguistic term sets in decision making. Fuzzy Sets Syst 114(1):43–58
Katayama H, Bennett D (1999) Agility, adaptability and leanness: a comparison of concepts and a study of practice. Int J Prod Econ 60–61:43–51
Khadem M, Ali SA, Seifoddini H (2008) Efficacy of lean metrics in evaluating the performance of manufacturing systems. Int J Ind Eng Theory Appl Pract 15(2):176–184
Kojima S, Kaplinsky R (2004) The use of a lean production index in explaining the transition to global competitiveness: the auto components sector in South Africa. Technovation 24(3):199–206
Lee AH, Kang HY, Chang CT (2009) Fuzzy multiple goal programming applied to TFT-LCD supplier selection by downstream manufacturers. Expert Syst Appl 36(3):6318–6325
Leung LC, Cao D (2000) On consistency and ranking of alternatives in fuzzy AHP. Eur J Oper Res 124(1):102–113
Levinson WA, Rerick RA (2002) Lean enterprise: a synergistic approach to minimizing waste. Asq Press, Mexico
Lin CT, Chiu H, Tseng YH (2006) Agility evaluation using fuzzy logic. Int J Prod Econ 101(2):353–368
Narasimhan R, Swink M, Kim SW (2006) Disentangling leanness and agility: an empirical investigation. J Oper Manag 24(5):440–457
Nightingalea DJ, Mizeb JH (2002) Development of a lean enterprise transformation maturity model. Transform Knowl Syst Manag 3(1):15–30
Papadopoulou TC, Özbayrak M (2005) Leanness: experiences from the journey to date. J Manuf Technol Manag 16(7):784–807
Saaty TL (1980) The analytic hierarchy process. McGraw-Hill, New York
Saaty TL, Takizawa M (1986) Dependence and independence: from linear hierarchies to nonlinear networks. Eur J Oper Res 26(2):229–237
Shah R, Ward PT (2003) Lean manufacturing: context, practice bundles, and performance. J Oper Manag 21(2):129–149
Shah R, Ward PT (2007) Defining and developing measures of lean production. J Oper Manage 25(4):785–805
Shaw K, Shankar R, Yadav SS, Thakur LS (2012) Supplier selection using fuzzy AHP and fuzzy multi-objective linear programming for developing low carbon supply chain. Expert Syst Appl 39(9):8182–8192
Singh B, Garg SK, Sharma SK (2010) Development of index for measuring leanness: study of an Indian auto component industry. Meas Bus Excell 14(2):46–53
Soriano-Meier H, Forrester PL (2002) A model for evaluating the degree of leanness of manufacturing firms. Integr Manuf Syst 13(2):104–109
Taj S, Morosan C (2011) The impact of lean operations on the Chinese manufacturing performance. J Manuf Technol Manag 22(2):223–240
Van Laarhoven PJM, Pedrycz W (1983) A fuzzy extension of Saaty’s priority theory. Fuzzy Sets Syst 11(1–3):229–241
Vimal KEK, Vinodh S (2012) Leanness evaluation using IF–THEN rules. Int J Adv Manuf Technol 63(1):407–413
Vinodh S, Chintha SK (2010) Application of fuzzy QFD for enabling leanness in a manufacturing organisation. Int J Prod Res 49(6/8):1627–1644
Vinodh S, Chintha SK (2011) Leanness assessment using multi-grade fuzzy approach. Int J Prod Res 49(2/4):431–445
Wan H, Chen FF (2008) A leanness measure of manufacturing systems for quantifying impacts of lean initiatives. Int J Prod Res 46(23):6567–6584
Wang LX, Mendel JM (1992) Generating fuzzy rules by learning from examples. IEEE Trans Syst Man Cybern Part C (Appl Rev) 22(6):1414–1427
Wang SY, Chang SL, Wang RC (2009) Assessment of supplier performance based on product-development strategy by applying multi-granularity linguistic term sets. Omega 37(1):215–226
Womack JP, Jones DT (1990) The Machine that changed the world: based on the Massachusetts Institute of Technology 5-million dollar 5-year study on the future of the automobile. Rawson Associates, New York
Wong WP, Ignatius J, Soh KL (2012) What is the leanness level of your organization in lean transformation implementation an integrated lean index using ANP approach. Prod Plan Control 25:4
Author information
Authors and Affiliations
Corresponding author
Rights and permissions
Open Access This article is distributed under the terms of the Creative Commons Attribution 4.0 International License (http://creativecommons.org/licenses/by/4.0/), which permits unrestricted use, distribution, and reproduction in any medium, provided you give appropriate credit to the original author(s) and the source, provide a link to the Creative Commons license, and indicate if changes were made.
About this article

Cite this article
Shams Bidhendi, S., Goh, S. & Wandel, A. Development of a weighted leanness measurement method in modular construction companies. J Ind Eng Int 15, 603–625 (2019). https://doi.org/10.1007/s40092-019-0313-y
Received:
Accepted:
Published:
Issue Date:
DOI: https://doi.org/10.1007/s40092-019-0313-y