
Abstract
The performance of reinforced concrete (RC) element may be deficient for a variety of causes. Correct actions should be taken to resume the performance of the deficient element to maintain the strength and serviceability of the structure. A deficient RC column element may be identified in the form of spalling of concrete cover. A patching method could be selected to recover the damaged area and, hopefully, regain the strength of the damaged RC column to its original value. This research aims to investigate the suitability of patch repair material to recover the performance of damaged RC column. The investigation is carried out by comparing the behaviour of patched RC columns with the corresponding normal RC column. The eccentric loading has been set up in this investigation to induce compression failure of the RC columns. The simulated area of damage is patched using unsaturated polyester resin mortar (UPR mortar). The results indicate that the mode of failure is not induced at the patched sections. The presence of patching causes a redistribution of stress at the patched section in such a way, so a higher stress transfer occurs in the undamaged zone and in the longitudinal reinforcements compared to those of the normal column. The capacity of the patched RC columns is only 71–92% of the normal RC column.
Introduction
Strength and serviceability are necessary criteria that should be satisfied in the design of reinforced concrete (RC) structures to ensure the safety and function of the buildings throughout their service life. Some of the structural elements may require more conservative limit of strength and serviceability compared to the other elements. For example, RC column must be designed in such a way to realise the principle of “strong column weak beam”. This means any excessive loading beyond the design loads which may be encountered by the structure should lead to a failure of the beam instead of the column. The conservative design of RC column is also reflected in the assigned strength reduction factor of this element, i.e. about 0.6 which is lower compared to that assigned for RC beam in flexure (0.8) (Committee 2008).
RC column is a part of the structural elements which is designed to withstand a combination of axial and flexural loading. The capacity of the RC column is provided by the combined action of the concrete and the embedded reinforcements. At ultimate loading, the failure mode of RC column may be initiated by compression failure. This circumstance usually occurs when the RC column is predominantly under large axial loading. On the other hand, if the predominant loading is the flexural one RC column tends to initiate failure by yielding of the tension reinforcements. Whichever the failure mode of the RC column is, the design must fulfil the limit of strength and serviceability as specified in the Codes (Committee 2008; International Federation for Structural Concrete (fib). Model Code 2010).
The design compliance of RC column to the specified Codes may not be conveyed into an actual structural performance due to various factors. For example, there may be a casting imperfection in the form of large voids as a result of inadequate consolidation of fresh concrete during construction of RC column. The present of this imperfect concrete will be the source of structural deficiency of RC column which may lead to a non-compliance to the limit of strength and serviceability (Achillopoulou and Karabnis 2015). The non-compliance of structural performance can also occur in the future although the RC structures were perfectly constructed. Throughout their life time, RC structures may deteriorate due to a variety of causes: an exposure to aggressive environment, a corrosion of the embedded reinforcement, an exposure to fire, an impact of seismic load, etc. The deterioration can affect the limit of strength and serviceability of the structures. Thus, any signs of deterioration that may occur in the RC column should be immediately resolved to maintain the strength and serviceability within an acceptable limit. Otherwise, the understrength of RC column can provoke disastrous event. Unlike that of RC beam where failure may result in a local collapse of the element, the failure of the RC column can trigger a global collapse of the whole buildings. Given the above considerations, it is vital to develop appropriate materials, technologies and methods to restore or even possibly increase the capacity of the deteriorated RC column so that the risk toward building collapse can be prevented. Current materials, technologies and methods for retrofitting RC column include: (a) increasing cross-section (Abdollahi et al. 2012; Tsonos 2010), (b) retrofitting using steel-jacket and infill concrete to form composite structures (He et al. 2017) and (c) retrofitting through confinement mechanisms using expanded metal mesh/EMM (El-kholy and Dahish 2016), fibre glass fly mesh/FGFM (Zhao and Hadi 2011), fibre-reinforced polymer/FRP (Vincent and Ozbakkaloglu 2013), steel-reinforced polymer/SRP (Napoli and Realfonso 2016), textile reinforced concrete/TRC (Tsesarsky et al. 2013), fibre reinforced cement-based matrix/FRC (Basalo et al. 2012), steel ring (Safitri and Imran 2017), etc.
The choice of repair and retrofitting to the deteriorated RC structures will be determined mainly by the type of the deterioration. For the case of deterioration in the form of spalling or delamination of concrete cover, a patching method is the first choice to be applied to recover the size of the damage concrete before further action of retrofitting method may be employed to strengthen the deficient RC column (Yaqub and Bailey 2011). The recommended procedures for implementing the patching method consist of removing parts of the damaged concrete, cleaning the exposed reinforcement, patching the area of the damaged using a suitable patch repair material and then finishing it with curing (Rio et al. 2008). The efficacy of the patch repair method will be affected by the properties of the repair material being used. Some Codes and Guidelines (European Standard 1997; International Concrete Repair Institute, Guide for selecting and specifying materials for repair of concrete surfaces. Technical Guidelines No. 03733, the International Concrete Repair Institute, Virginia, United States 1996) specify the minimum properties of the repair material which include compressive strength, flexural strength, elastic modulus, bond strength, shrinkage, creep, coefficient of thermal expansion, etc. In terms of structural performance, it is desired that executing a patching method with a suitable repair material will restore the strength and serviceability of the patched RC structure (Kristiawan et al. 2016). If this can be achieved, the patching to the deficient RC column may not require further action of retrofitting.
Previous researches by other investigators showed a lack of strength recovery when different repair materials are used to repair damaged RC columns. Achillopoulou and Karabinis (Achillopoulou and Karabnis 2015) use a high strength fibre-reinforced thixotropic material to repair the casting imperfection of RC square columns. After repairing with this material, the RC columns have a lower load-carrying capacity compared to the non-damaged RC column. The reduction is up to 22% and it depends on the extent of damages. Yaqub and Bailey (Yaqub and Bailey 2011) use an epoxy resin to repair post-heated RC circular column. The result indicates that a patching to the spalling of post-heated RC column with epoxy resin could increase the capacity by 15% compared to the non-spalling post-heated RC column. However, the patching itself could not restore the original capacity of the unheated RC column unless it is combined with the FRP composite wrapping. Meanwhile, various types of polymer-modified cementitious mortars have been used by Porto et al. (2012) to repair RC square columns. The structural performance of the repaired RC columns is lower compared the non-damaged RC column. They identified that the elastic modulus and compressive strength of repair material are key properties for assessing the suitability of repair material to restore the RC columns. With elastic modulus and compressive strength most similar to the concrete substrate, it is expected the repair material will restore the structural performance of the damaged RC columns.
The spalling or delamination of concrete cover could occur anywhere along the height of the RC column. The previous researches as stated in the preceding paragraph represent repair where damages occur either locally or entirely along the height of the RC column. However, a critical situation arises when the damages are localised at a region around the beam-column joint. This type of localised damage is usually induced by large horizontal loadings (e.g. seismic load). The loads bring about an excessive superimposed moment and shear at the joint resulting in a localised damage in this region. The damage may be repaired by a patching method or a combination of patching with other retrofitting technique. The decision depends on the extent of damage and the intended performance level of the structure to anticipate future loadings. If patching method is the final option to be carried out to repair the damaged RC column, this method should guarantee that the patched RC column will have a similar performance to the undamaged RC column.
This research aims to investigate the structural performance of patched RC columns. The structural performance of the patched RC columns will be compared with that of normal RC column to assess the suitability of patch repair material to restore the performance of the damaged RC column. The localised damages at near the joint are chosen for this investigation with a variety of depths and zones of repair. The patch repair material is unsaturated polyester resin (UPR) mortar. This type of patch repair material has been developed by authors and its performance to restore the flexural and shear strength of RC beams has been identified (Supriyadi et al. 2015; Kristiawan et al. 2017). For this particular research, a case of RC column with compression failure mode under eccentric loading is set up for the investigation.
Experimental investigation
Materials
Patch repair material was made using the following ingredients: unsaturated polyester resin (UPR) with its corresponding hardener, sand, cement and fly ash. This patch repair material is termed as UPR mortar. The UPR used in this investigation was YUKALAC® 157 BQTN-EX, an unsaturated orthophtalic type resin made from the polymerisation of di-carboxylic acids with glycols. The thermo-setting of this material is initiated by curing agent (hardener). The proportion of the ingredients for producing UPR mortar per m3 was: 950 kg of sand, 808 kg of cement, 143 kg of fly ash, 475 kg of UPR and 14.25 kg of hardener. Previous investigations have been carried out to characterise the properties of the UPR mortar both in terms of mechanical properties (Kristiawan and Prakoso 2016) and shrinkage-related properties (Kristiawan and Fitrianto 2017). Table 1 summarises the main mechanical properties of UPR mortar.
Concrete having an average strength of 25 MPa was mixed to be used for producing parent concrete (RC columns). The actual strength of the casting concrete for the production of RC column could vary as shown in Table 1. The variation of the strengths will be taken into account in the analysis of the results. Meanwhile, the steel reinforcements have a yield strength of about 296 MPa.
RC column specimens
Four RC column specimens were prepared for the investigation. All the RC columns have similar reinforcements’ ratio and layout. The effective height of the RC column is 1000 mm and the cross section is 110 × 150 mm2. One of the RC columns, identified as CN (Fig. 1a), was cast without any simulated damage to represent normal RC column. The other RC columns were cast with various simulated damages. After 1 day of casting, all the specimens were covered with wet burlap for 21 days and then they were stored in the laboratory room until 90 days of age. At this age, the simulated damages were patched with UPR mortar. Each of the patched RC columns was identified as CR1, CR2 and CR3 (Fig. 1b–d). On the following day after patching, all the RC columns were tested under eccentric axial load.
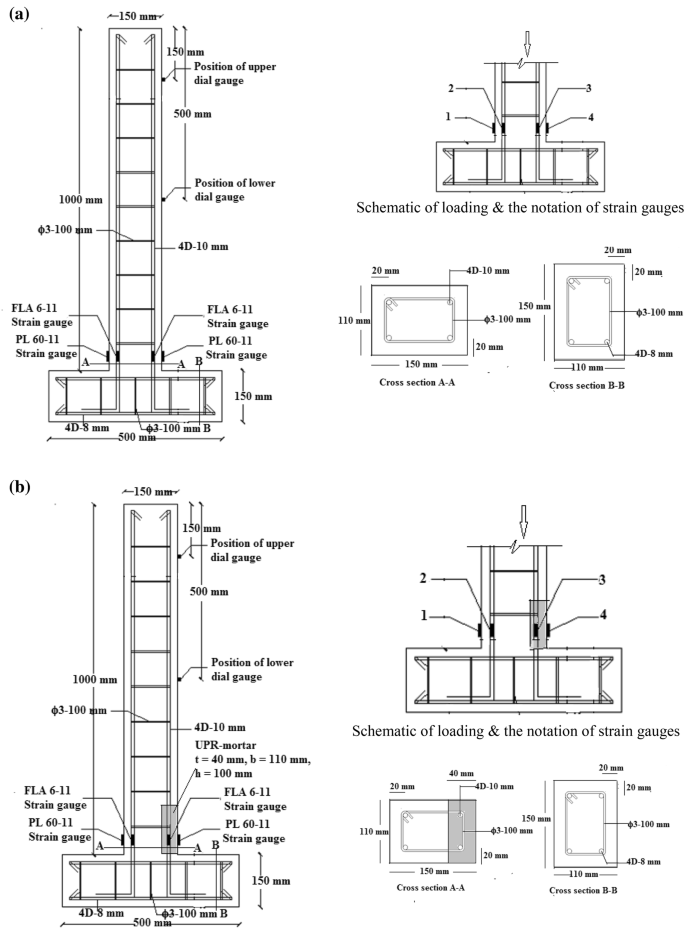

a Reinforcements detail of CN column. b Reinforcements detail of CR-1 column. c Reinforcements detail of CR-2 column. d Reinforcements detail of CR-3 column
Testing RC column
The RC column was placed on the base plate where the horizontal beam at the lower part of the RC column rests on top of the base plate. The base plate was fixed to the rigid floor by several anchorages. Upper steel plates were put on top of the horizontal beam at both sides (left and right of the vertical column). Each plate was connected to the base plate using four threaded bars along with the corresponding nuts. The nuts would be tightened to prevent both translation and rotational movement of the RC column specimen. In this way, the RC column could be assumed to be fixed at the lower joint (no translation and rotation) and free (able to undergo both translation and rotation) at the top of the column. Axial loading on the column was applied with the help of loading jack. A loadcell was inserted between the loading jack and the top of column. This loadcell was used to measure the magnitude of the applied load. The axial load was applied eccentrically. The eccentricity of the applied axial load was 10 mm. Due to this eccentricity, the RC column underwent a combination of axial and flexural loading. At this eccentricity of 10 mm, it was expected that the RC column would rupture by mechanism of compression failure mode. The loading was applied at an increment of 100 kg until reaching the ultimate value causing the rupture of the specimen. At each load increment, axial and lateral deformations were measured by strain gauges and dial gauges, respectively. Strain gauges are attached on the surface of concrete and or UPR mortar near the joint, both at the extreme fibres. In addition, strain gauges were also attached on the surface of the longitudinal reinforcements (see Fig. 1a–d). Meanwhile, dial gauges are used to measure the lateral movement of the columns at the height of 500 mm (lower level) and 800 mm (upper level) as indicated in Fig. 2.

Fitting the RC column specimen to restrain translation and rotational movement at the beam-column joint
Results and discussion
Modes of failure
The axial load is applied with an eccentricity of 10 mm. So, it is expected that the entire columns section will undergo compressive stresses with a varying magnitudes. Assuming an ideal composite action of RC column, the highest magnitude of compressive stress would occur at the extreme fibre of the RC column section where the eccentric load acting. It is also reasonable to expect that a higher stress concentration could arise at the zone right under the applied load. The modes of failure confirm the situation (see Fig. 3). All RC columns suffer a similar failure mode, i.e. spalling of the concrete cover in the zone with a higher stress concentration. For CN column, an additional failure mode is observed. The column suffers cracks at the beam-column joint. The cracks at the beam can be identified as that of flexure-shear type where this zone is under a higher combined flexure-shear stress. The lower actual strength of concrete for making the CN column could be the source of this instance.

a Failure mode of CN column. b Failure mode of CR-1 column. c Failure mode of CR-2 column. d Failure mode of CR-3 column
Load-axial strain
The axial strains of concrete/UPR mortar and longitudinal reinforcement induced by applied load are measured using PL-60-11 and FLA-6-11 type of strain gauge, respectively. The locations of strain gauges for each RC column are identified with numerical number: #1 and #4 represent the location of strain gauges for measuring axial strain on extreme fibre of concrete/UPR mortar while #3 and #4 are those of measuring axial strain of the longitudinal reinforcements (see Fig. 1). The eccentricity of the applied load is also indicated in the figure. The results of loads versus axial strains are presented in Fig. 4. Generally, almost the entire section of RC columns exhibits negative axial strains indicating that the cross sections undergo compressive stress. The axial strain measured on concrete opposite to the eccentric load (strain at #1) is the lowest compared to strain at other locations. This behaviour corresponds to the smallest stress that occurs at #1. The stress induced by eccentric load can be substituted with a combination of stresses due to concentric load and the corresponding moment. The stress induced by the moment will superimpose the compressive stress from the concentric load. The highest positive moment acting at #1 reduces the induced compressive stress due to the concentric load at that location. Hence, the compressive stress at #1 becomes the smallest. Conversely, it may be expected that strain at #4 would be the greatest as the compressive stress induced by the highest negative moment at this location will superimpose the compressive stress from concentric load. However, the result of this investigation does not confirm the situation. Figure 5 shows the strains distribution across the section for all columns at various load levels. It is clear from Fig. 5 that strains at #4 are lower than #3 for all RC columns, especially at low load level (below 40% of the ultimate load). The behaviour could be related to the confining effect of the stirrup. The core of the concrete column is confined by the stirrup resulting in high concentration of stress in this confining zone. However, at a high load level some of the stirrup may lose its capability to withstand a high stress. Hence, a redistribution of stress will take place in which the concrete cover receives a significant increase of stress.

Load-axial strain relationship

Strain distribution across the section at various load level
Load–lateral deflection
The lateral deflection responses of the columns due to the corresponding applied eccentric loads are given in Fig. 6 for each column individually; whereas in Fig. 7 the load–lateral deflections of all columns are presented in a single diagram either the one representing the lateral deflection measured at an upper level or a lower level. For each column, a higher lateral deflection is obviously shown at an upper level of measurement. The present of patching gives a distinctive load–lateral deflection behaviour. In normal column (CN), plastic response can be detected after the load reaches about 20 tonne. A small increment of load after this load level causes considerable lateral deflections both at the upper and lower level of measurement. The final lateral deflection of the CN column is about 21.5 and 12.99 mm for upper and lower level of the measurement, respectively. In the patched repair columns, no plastic responses are detected even though all columns show non-linear responses, especially when a high level of load has been applied. A careful examination should be sought to clarify the situation. The plastic response shown in CN column could be related to the lower strength of the concrete used for the production of this specimen compared to the patched RC columns (see Table 1). With a lower concrete strength, there is an additional failure mode in the form of crackings at the beam-column joint. The cracks on the beam could be seen as that of flexure-shear type (see Fig. 3a). Crackings at the beam-column joint are initiated at a load of 20 tonne. Further increase in the load results in a propagation of the cracks leading to a higher stress transfer to the reinforcements. This stress transfer causes the reinforcements (both longitudinal reinforcements of the column and the beam) to deform at a higher rate and dictate the plastic behaviour of the CN column. Unfortunately, this behaviour cannot be captured by the strain measurement on the respective reinforcements. The strain gauge only measures a local strain of the longitudinal reinforcement of the column at a gauge length of 6 mm which does not always match with the yielding section of the reinforcement. Measurement of compressive strain on the longitudinal reinforcement #3 indicates this situation. The appearance of the first cracks at the beam-column joint at a load of 20 tonne causes a sudden drop of strain #3 indicating that the appearance of the cracks disrupts the strain measurement (see Fig. 4a).

Load–lateral deflection of column

Effect of patching on the load–lateral deflection
The effect of patching thickness and patching zone on the load–lateral deflection behaviour are shown in Fig. 7. For the purpose of comparison, it is desired to normalise the load by considering the compressive strength of the individual concrete used for making the column specimens (Table 1). The ratio of the compressive strength of concrete CN to the compressive strength of concrete CR-1, CR-2 and CR-3 is used as a basis to normalise the load of the patched repair column CR-1, CR-2 and CR-3, respectively. The measured loads on each patched repair column are multiplied by the respective ratio to obtain the normalised loads of the repaired columns. The results of the normalised loads versus the lateral deflections of the columns are presented in Fig. 8. For the purpose of comparison, the load–lateral deflection in Fig. 8 is examined at a load below that of causing the plastic response of the CN column, i.e. 20 tonne. From this figure, it is seen that the CR-1 and CR-3 give a lower lateral deflection compared to that of CN column. On the other hand, CR-2 initially shows a comparable stiffness to the other columns. However, at a load higher than 2.72 tonne, the stiffness of CR-2 starts to reduce significantly leading to a higher lateral deflection compared to other columns. These behaviours could be explained as follows: due to the presence of UPR mortar with its lower elastic modulus than that of parent concrete (see Table 1); the stresses in the patched section tend to be distributed more in the undamaged area. In addition, more stresses are transferred to the longitudinal reinforcements. Figure 9 illustrates the situation where the strains measured by strain gauges #1, #2, #3 and #4 (see Fig. 1) and their corresponding stresses are determined at a load of 10.8 tonne. These strains and stresses represent the distribution of these parameters across the columns’ section at 0, 2, 13 and 15 cm from the left extreme fibre (or strain gauge #1). The figure indicates that in the presence of patching a higher compressive stress at longitudinal reinforcement #3 is observed to counteract moment induced by eccentric load. This counteraction is favourable to maintain the stability of the columns. However, for CR-2, the greater thickness of the patching (about a half of the section) has a consequence of greater strains in the patching area which affects the deformation of the column.

Effect of patching on the normalised load–lateral deflection

Strain and the corresponding stress distribution at a load of 10.8 tonne
Ultimate load
The failure load of the patched repair columns is in the range of 24.5–29.3 tonne which are comparable to that of normal column (CN). However, if individual compressive strength of concrete for the production of each column is taken into account, the failure (normalised) load of the patched repair columns is reduced to 19.6–25.3 tonne. This range of load represents 71–92% of the normal column (CN).
Figure 10 shows interaction diagram of column with designed compressive strength of 22.4 MPa and reinforcements layout similar to the investigated columns. The diagram could be viewed as a theoretical capacity of CN column to withstand a combination of axial (Pn) and flexural (Mn). It is shown that the experimental value of Pn and Mn for the CN column is outside the interaction diagram indicating that the actual capacity of CN column is greater than the theoretical value. On the other hand, the normalised capacity of RC columns is less than the theoretical value. Hence, a patching method using an UPR mortar could not regain the original capacity of RC columns.

Experimental value of Pn and Mn compared to theoretical interaction diagram of CNs
Conclusions
The results of experimental investigation on the performance of patched RC columns can be concluded as follows:
-
The compression failure mode of patched RC column is identified by the spalling of concrete cover at a zone with higher stress concentration, i.e. right under the applied load.
-
The variation of stresses across the patched section is influenced by the confinement of stirrup resulting in low stress distribution in the unconfined zone.
-
The presence of patching causes a redistribution of stress at the patched section in such a way so a higher stress transfer occurs in the undamaged zone and in the longitudinal reinforcements compared to those of the normal column.
-
The patching thickness and patching zone affect the load–lateral deflection behaviour of patched RC columns where the behaviour could be related to the stress distribution across the patched sections.
-
A patching method using an UPR mortar could not regain the original capacity of RC columns.
References
Abdollahi B, Bakhshi M, Mirzaee Z, Shekarchi M, Motavalli M (2012) SIFCON strengthening of concrete cylinders in comparison with conventional GRFP confinement method. Constr Build Mater 36:765–778
Achillopoulou DV, Karabnis AI (2015) Assessment of concrete columns repaired with fiber reinforced mortar through damage indexes and numerical model. Constr Build Mater 81:248–256s
ACI Committee 318. Building Code Requirements for Structural Concrete (ACI 318M-08) and Commentary. American Concrete Institute, Farmington Hill, Michigan, USA, 2008.
Basalo FJDCY, Matta F, Nanni A (2012) Fiber reinfoced cement-based composite system for concrete confinement. Constr Build Mater 32:55–65
El-kholy AM, Dahish HA (2016) Improved confinement of reinforced concrete columns. Ain Shans Engineering Journal. 7:717–728
European Standard ENV 1504-9, Product and system for the protection and repair of concrete structures- Definitions, requirements, quality control and evaluation of conformity- Part 9: General principles for the use of product and system. Commite’ Europeen de Normalisation, Bruxelles, 1997.
He A, Cai J, Chen QJ, Liu X, Xue H, Yu C (2017) Axial compressive behaviour of steel-jacket retrofitted RC columns with recycled aggregate concrete. Constr Build Mater 141:501–516
International Concrete Repair Institute, Guide for selecting and specifying materials for repair of concrete surfaces. Technical Guidelines No. 03733, the International Concrete Repair Institute, Virginia, United States, 1996.
International Federation for Structural Concrete (fib). Model Code 2010, Vol. 1. Wilhelm Ernst & Sohn, Berlin, Germany, 2013.
Kristiawan SA, Prakoso AB (2016) Flexural behaviour of patch-repair material made from unsaturated polyester resin (UPR)-mortar. Mater Sci Forum 857:426–430
Kristiawan S, Supriyadi A, Sangadji S, Wicaksono HB (2017) Shear failure of patched reinforced concrete beam without web reinforcements. Key Eng Mater 737:441–447
Kristiawan SA, Fitrianto RS (2017) Comparison of shrinkage related properties of various patch repair materials. IOP Conf Ser Mater Sci Eng 176:012017
Kristiawan SA, Supriyadi A, Muktamirin MK (2016) Effect of patching thickness on the flexural performance of patched reinforced concrete beams. Advances in civil, architectural, structural and constructional engineering. Taylor and Francis, New York
Napoli A, Realfonso R (2016) Compressive behaviour of concrete confined by SRP wraps. Constr Build Mater 127:993–1008
Porto FD, Stievanin E, Pellegrino C (2012) Efficiency of RC square columns repaired with polymer-modified cementitious mortars. Cement Concr Compos 34:545–555
Rio O, Andrade C, Izquierdo D, Alonso C (2008) Behaviour of patch-repaired concrete structural elements under increasing static loads to flexural failure. J Mater Civ Eng 17(2):168–177
Safitri E, Imran I, Nuroji, (2017) Concrete strength enhancement due to external steel ring confinement. Proc Eng 171:934–939
Supriyadi A, Kristiawan SA, Raditya SB (2015) Experimental investigation on the flexural behaviour of patched reinforced concrete with unsaturated polyester resin mortar. Appl Mech Mater 754–755:457–462
Tsesarsky M, Peled A, Katz A, Anteby I (2013) Strengthening concrete elements by confinement within textile reinforced concrete shells-Static and impact properties. Constr Build Mater 44:514–523
Tsonos ADG (2010) Performance ehancement of R/C building columns and beam-column joints trhough shortcrete jacketing. Eng Struct 32:726–740
Vincent T, Ozbakkaloglu T (2013) Influence of strength and confinement method on axial compressive behabiour of FRP confined high-and ultra high-strength concrete. Comp Part B 50:413–428
Yaqub M, Bailey CG (2011) Repair of fire damaged circular reinforced concrete columns with FRP composites. Constr Build Mater 25:359–370
Zhao H, Hadi MNS (2011) Experimental investigation on using mesh as confinement materials for high strength concrete column. Proc Eng 14:2848–2855
Acknowledgments
The research is financially supported by Directorate Research and Community Services, the Ministry of Research, Technology and Higher Education, Indonesia through Competence Based Research Scheme (Contract No. 873/UN27.21/PP/2017).
Author information
Authors and Affiliations
Corresponding author
Additional information
Publisher's Note
Springer Nature remains neutral with regard to jurisdictional claims in published maps and institutional affiliations.
Rights and permissions
Open Access This article is distributed under the terms of the Creative Commons Attribution 4.0 International License (http://creativecommons.org/licenses/by/4.0/), which permits unrestricted use, distribution, and reproduction in any medium, provided you give appropriate credit to the original author(s) and the source, provide a link to the Creative Commons license, and indicate if changes were made.
About this article

Cite this article
Kristiawan, S.A., Supriyadi, A., Sangadji, S. et al. Experimental investigation on the behaviour of patched reinforced concrete column under eccentric loading: a case of compression failure. Int J Adv Struct Eng 11, 31–43 (2019). https://doi.org/10.1007/s40091-019-0214-8
Received:
Accepted:
Published:
Issue Date:
DOI: https://doi.org/10.1007/s40091-019-0214-8