
Abstract
Footing is an important part of a structure, because its repair is extremely difficult and cumbersome. Therefore, all structural parameters should be carefully considered when designing a footing. An isolated footing needs sufficient depth, when considering the fixed base assumption. Extensive research has previously been conducted to define and formalize the depth of a rigid footing, i.e., the depth required, such that footing behaves as a rigid. Alternatively, working stress method (WSM) and limit state method (LSM) provide a lower depth for low subgrades and a higher depth for high subgrades than that required by rigid condition if a unit width footing is considered for the design. This paper presents a simple approach for calculating the depth to meet the rigid condition under static loading. The proposed calculation method produced a better rigidity than the existing approaches and it correlated well to the finite-element method (FEM) for low subgrades. The reinforcement distribution is function of the bending moment (BM). Steel is uniformly embedded throughout the length or width of conventional footing methods, but this is inappropriate, because the bending moment is not uniform along the length or width of the footing. This paper proposes solutions to this by redefining the placement of steel in the central zone of the footing. The effective zone for reinforcement was based on the FEM results. This simple procedure was developed for calculating the maximum moment using the Diagonal Strip Method (DSM). DSM is a substitute for FEM, and it has been shown to correlate well. The BM at central zone as well as at the edges can be calculated to define the spacing of the reinforcements.
Introduction
Typically, spread footings are provided for individual columns and designed for the loads supported by the column. The key factor for footing design is soil pressure, which may be linear, parabolic, or uniform (Fig. 1). Linear distribution is used for dense elastic soils with low plasticity, and parabolic distribution is used for dense sands and clay, while uniform distribution is used for dense soils with limited plasticity or elastoplastic behavior (Rodriguez-Gutierrez and Aristizabal-Ochoa 2012). The ultimate bearing capacity of footings can be substantially increased by soil confinement under axial load (Prasad and Singh 2011). Uniform pressure is commonly assumed as the ideal condition for rigid depth. When the subgrade reaction is maximum at the center and a minimum at the corners, then it is considered to be a flexible foundation, but, when the reaction force is uniform, then it is considered a perfectly rigid foundation. The actual stress distribution depends on the rigidity of the footing and type of soil. For cohesion-less soils and sand, the pressure distribution depends on the depth of embedment of the foundation. The pressure is usually higher in the middle (Al-Shayea and Zeedan 2012). Footing design by the conventional method resulted in a semi-rigid foundation (Farouk and Farouk 2014a, b). Thus, the footing has a higher subgrade reaction concentration at the edge and lower at center. Pressure distribution of soil is a function of the settlement. By increasing the number layers of rubber–sand mixture (RSM), the bearing capacity of the foundation can be increased, and the footing settlement reduced (Moghaddas Tafreshi et al. 2016). The settlement reduction factor decreases with the increase in applied load (Al-Aghbari and Dutta 2008). Depth of footing is considered to be rigid when the settlement is uniform or when the settlement at each point is the same along the footing. The foundation may be considered flexible when the settlement is higher at the center than at the corner. The use of a non-coaxial soil model significantly increases the settlement of footings. However, it does not affect the ultimate bearing capacities (Yang and Yu 2006).

Pressure distribution for different soils
Within the footing, stresses are developed due to different loading conditions, boundary conditions, and geometry. The forces acting on the footing are axial, shear, moment, and torsion. When the footing is loaded concentrically, the different modes of failure are bearing, flexure, and one-way and two-way shear. The effect of the stress level on the bearing capacity of the foundation, which is related to the foundation size, is very important (Jahanandish et al. 2012). ECP203 (2011), ACI318 (2008), and EC2 (2004) code provisions underestimate the structural failure loads of isolated column footings, while BS 8110.1 (1997) overestimates the failure loads for punching shear (Abdrabbo et al. 2016). Maximum bending moment (BM) is also an important factor for the calculation of footing depth. In the conventional method, the depth calculated for maximum BM is always less than that for one-way shear and punching shear, so it is neglected. Farouk and Farouk (2014a, b) recommended increasing the BM by 25% or increasing the reinforcement by 25% when calculating footing depth, due to an increasing edge stresses, which leads to an increase in the maximum moment.
Bending moment distribution is not uniform along the length or width of a footing. Timoshenko and Woinowsky-Krieger (1959) showed the distribution of the bending moment along the midline of a footing for u/a = 0.1 and u/a = 0.2 (refer to Fig. 2c). The equation for maximum bending moment is:

a Plan of isolated footing. b Section along middle line. c Bending moment distribution along middle line
where Mx and My are moments along the x- and y-directions, u and a are the size of the column and the footing, respectively, and P is the axial load on the column. This equation is valid for ν = 0.3 (Poisson’s ratio), but nature of the bending moment remains the same for any value of Poisson’s ratio. From Fig. 2c, it can be seen that the bending moment is highest at the center and reduces towards the edge.
The total moment can be calculated by Reynolds et al.’s (2007) method. Equations used were for concentric and eccentric footing. Figure 3 shows the formulae for an isolated pad footing using Reynolds’s handbook method for square and rectangular sections. The total moment calculated using the conventional method was similar to that using Reynolds et al. (2007). To verify the validity of equations, rectangular eccentric footing is converted to concentric square footing by taking f1 = f2 and b = L. For this condition, the moments in both directions (Mx and My) should be equal and should match the square footing moment (Mx). Twenty cases were used for validation, as presented in Table 1. The moments of the converted footing were exactly the same as the rectangular footing and as the conventional method. Therefore, the conventional method or the equations in Reynolds’s handbook can be used to calculate the total moment. Figure 4 shows the validation of total moment with Reynolds’s handbook equation for various subgrades.

Bending moment for isolated pad footing by Reynolds’s handbook

Validation of total moment by Reynolds’s handbook method
For tension, if lc > 0.75(C + 3d), then two-thirds of the reinforcement should be concentrated within a zone that extends on either side for a distance no more than 1.5d from the face of the column (Reynolds et al. 2007), where C is the column width, lc is the distance from the center of a column to the edge of the pad, and d is depth. Seward (2014) recommended that the reinforcement for small pads can be uniformly distributed throughout the width of the foundation. However, if the width of the pad (L) exceeds 1.5(C + 3d), two-thirds of the reinforcement should be placed in a middle band at a width of (C + 3d). IS 456 (2000) recommended a central band equal to the width of the footing, placed along the length of the footing with the portion of the reinforcement determined in accordance with the equation below. This is limited to rectangular footing only:
where β is the ratio of the long side to the short side of the footing.
Finite-element method (FEM) has become a powerful tool for the numerical simulation of engineering problems. FEM, therefore, is considered a benchmark, as its solutions are very accurate. The structural analysis program (SAP2000 2010) was used as an FEM tool for analysis purposes and the results of the proposed method are compared with FEM. In the present work, the diagonal strip method (DSM) was developed, which produces BM similar to finite-element method (FEM) results. This method provides reinforcement for a calculated bending moment without any increase in the percentage of steel.
Different approaches for rigid depth
The American Concrete Institute (ACI) Committee 336-2R (1988) suggested the use of a relative stiffness factor (Kr) developed by Meyerhof (1953) to determine whether the footing should be considered flexible or rigid; the proposed equation is:
where Ec modulus of elasticity of the structure (or concrete), Es modulus of elasticity of the soil, B width of the foundation, and Ib moment of inertia of the structure per unit length at right angles to B. The ACI Committee 336-2R, 1988 recommended that, if Kr is equal to or greater than 0.5, then the footing is considered rigid. If the relative stiffness factor is found to be less than 0.5, then footing should be designed as a flexible member. Vesic (1961) gives the relationship between the modulus of elasticity and the subgrade reaction of the soil as follows:
where μs Poisson’s ratio of the soil. However, without triaxial tests, the elasticity of the soil is difficult to determine. Instead, Vesic suggested using a relative stiffness factor Kr with the same rigidity condition, but independent of Es, which is given by the following:
Tabsh and Raouf Al-Shawa (2005) modified the stiffness factor Kr by considering all the dimensions of footing and column cross section. If Kr is less than or equal to 1, it can be considered flexible; otherwise, it will be considered rigid. The equation developed is:
where t uniform thickness of the footing, b column dimension along the footing dimension B, L footing dimension perpendicular to B, and l column dimension along the footing dimension L.
The coefficient of rigidity suggested by DIN 4018 (1981) is given by the following equation:
Shehata (2016) conducted a study using Eq. (7) and recommended that, if the factor was less than or equal to 0.05, the footing is considered flexible, and otherwise, it is considered rigid.
The WSM and LSM for the analysis and design of footings were described in IS 456 (2000). For both the approaches, the depth is calculated for one-way shear, which is at distance d (effective depth of footing) from the face of column, for two-way or punching shear, which is at d/2 from the face of column and for maximum bending moment at column face. WSM is a traditional method used for design, which produces higher depths when compared to LSM. It was observed that both depths did not fulfill the rigidity requirement of the footing for all the types of soil or subgrade.
Depth must also be sufficient to accommodate the development length of a column bar in compression, i.e., Ldc as given in special publication (SP) 16 (1978) and special publication (SP) 34 (1987) of Indian standards. The development length of the bars must be sufficient to transfer compression to the supporting member, as per clause 12.3 of ACI 318 (2008). If the computed length is more than the distance available from the top of the footing to the tensile steel top, then the available solutions are to: (1) use a larger number of smaller bars in a column, (2) increase depth, and (3) construct a pedestal on top of the footing to provide extra length (McCormac and Brown 2015).
The depth of the base should be equal to or greater than 0.5a, where a is the distance from the face of column to the edge of the base (Reynolds et al. 2007). Depth calculated using this condition was close to depth calculated by the finite-element analysis for low subgrade or soft soil. However, this calculation was not valid for high subgrade or hard soil. The depth was considered rigid when it acted as solid block or contained very little reinforcement. The minimum reinforcement of 0.12% area must be specified if the calculated reinforcement is less than this minimum reinforcement (IS 456 2000). There are other conditions that give a rigid depth close to the FEM results. Some conditions are suitable for high subgrade but fail in lower subgrade, or vice versa.
Most importantly, the criteria enlisted for each depth calculation must be satisfied for correct results. Table 2 shows the rigid depth results using the existing approaches for 20,000 kN/m3 subgrade. The differences between the approaches were considerable, so there is a need to determine which methods provide the correct rigid depth for different subgrades. The present study reports the selection of conditions depending upon the subgrade to obtain the correct depth to which the footing acts as a rigid.
Concept of modeling
Column and pad of the footing were modeled as area (shell) elements, having six degrees of freedom at each node, as specified by Vishwakarma and Ingle (2017) for modeling a concrete slab. Load transferred from the column was treated as a concentrated load. However, the load is uniformly distributed (UDL) over the cross-sectional area of the column in the mathematical model. In finite-element modeling, the plate (shell) is discretised and the soil was modeled as a spring with equivalent stiffnesses. Spring stiffnesses were calculated from the modulus of subgrade reaction of soil. FEMA 356 (2000, Fig. 4.4) was used for the calculations of soil stiffness. However, this was only applicable for a single node to perform soil–structure interaction. In this mathematical model, soil springs were used with value equal to the contributing area multiplied by the modulus of soil reaction, i.e., area spring. To perform finite-element analysis, both plate (shell) elements were discretised and supported on springs of equivalent stiffness for various subgrades. Figure 5 shows a three-dimensional view of column loading on a footing.

3D view of column loading as UDL on footing
Idealization of the model
In the present study, a square footing and column were considered. M25 grade concrete and Fe415 steel were used with a Poisson’s ratio of 0.15 for concrete. The size of the footing was evaluated using load and bearing pressure. Column cross-sectional dimensions included 0.3 m × 0.3 m, 0.4 m × 0.4 m, 0.5 m × 0.5 m, and 0.6 m × 0.6 m. The load carrying capacity of the column for percentage reinforcements of 0.8, 1, 1.25, 1.5, and 2% were considered when axially loaded. With these parameters, 20 cases were developed and analyzed to determine the rigid depth. These cases were considered for low-rise and medium-rise buildings, where isolated square footings are preferred. Values of the safe bearing capacity of soil included 200 kN/m2, 500 kN/m2, 1000 kN/m2, and 2000 kN/m2, which indicated variation of subgrades from low to high. The modulus of the subgrade was calculated as suggested by Bowles (1988):
where Ks is subgrade modulus in kN/m3, FS is factor of safety taken as 2.5–3, and qa is allowable bearing pressure in kN/m2.
New approach for rigid depth calculation
The differences seen in the maximum bending moment results between the conventional method (unit width) and FEM were significant. The design moments found with FEM are not uniform throughout the length or width of footing. However, addition of these moments (moment at each node) found to be approximately equals to the total moment obtained with the conventional method. Hence, designing a footing with the conventional method produced less accurate moments. Figure 6 shows the differences for various subgrades.

Moment difference between the conventional method and FEM
The nature of bending moment simulated using FEM is similar to Timoshenko’s observation, i.e., the bending moment at any section is not uniform. Figure 7 shows variation of maximum BM for axial concentric load along the width (or length). The difference in the maximum bending moment between the conventional method and FEM was significant. Therefore, ignoring the BM when calculating depth is not appropriate. BM calculation by the conventional method (i.e., unit width method) led to inaccurate design, such that total moment should be considered for depth calculations. Total moment can be calculated by the conventional method or Reynolds et al. (2007) method.

Bending moment distribution by FEM
General equation for design of RCC as per Krishna and Jain (1959) is as follows:
where M total moment (kNm), K moment factor depend on Fck and Fy, B width of footing (m), and d effective depth of footing (m).
The thickness of footing calculated with this method may be less to account the rigidity effect when compared with the FEM results. As the bending moment is maximum in central part, consideration of full width leads to an incorrect depth. To get the correct rigid depth, the central part of width should be considered with maximum moment. The number of cases has been analyzed with EFM to determine the effective central zone and is given by the following:
where L length or width of footing; b depth or width of column.
The depth shall be calculated for total moment by considering effective width instead of full width of footing to get actual rigid depth. The depth calculated with this approach is safe to accommodate the development length in compression (Ldc) for lower subgrade and also well agreement with the FEM. For higher subgrade, WSM gives greater depth but LSM, new approach and minimum % steel approach are close to FEM. It is also observed that depth calculated with minimum steel approach for lower subgrade is more conservative than any other approaches, so new approach should be preferred for lower subgrade. For all subgrade, the difference in depths of WSM and FEM is quite large. Though WSM gives higher depth than the other approaches, it should not be preferred for rigid depth calculation. Figures 8, 9, 10, 11 shows the comparison for rigid depth of the existing approaches and new approach.

Rigid depth comparison

Diagonal distance

Comparison of maximum BM for DSM and FEM
Proposed placement of reinforcement in isolated square footing
Diagonal strip method (DSM)
The diagonal strip method is simple and based on the unit width method. In the conventional method, the unit width is considered to be the horizontal direction or vertical direction. Footings are designed for loads from a column. When the connection between the column and the footing is rigid, the stresses develop at each point of the footing. The maximum distance from the face of the column is the diagonal distance, so using the horizontal distance or vertical distance from the column face is inappropriate. However, using the diagonal distance in the moment calculation gives the maximum moment at the column face. The diagonal distance to be considered is shown in Fig. 9.
Now, bending moment at the face of column can be calculated by the following equation:
where p bearing pressure in kN/m2, l diagonal length.
Bending moments calculated with the DSM were in agreement with FEM, proving that this method is an alternative for FEM. Figure 10 shows the comparison between DSM and FEM for maximum bending moment. Bending moment is maximum at the center and reduces towards the edge of the footing. The BM in the central zone (Mavg Fig. 7) is two-thirds the maximum BM, and the BM at the edge (Mmin Fig. 7) is one-third the maximum BM. The maximum BM value can be calculated using DSM.
Proposed approach for distribution of reinforcement
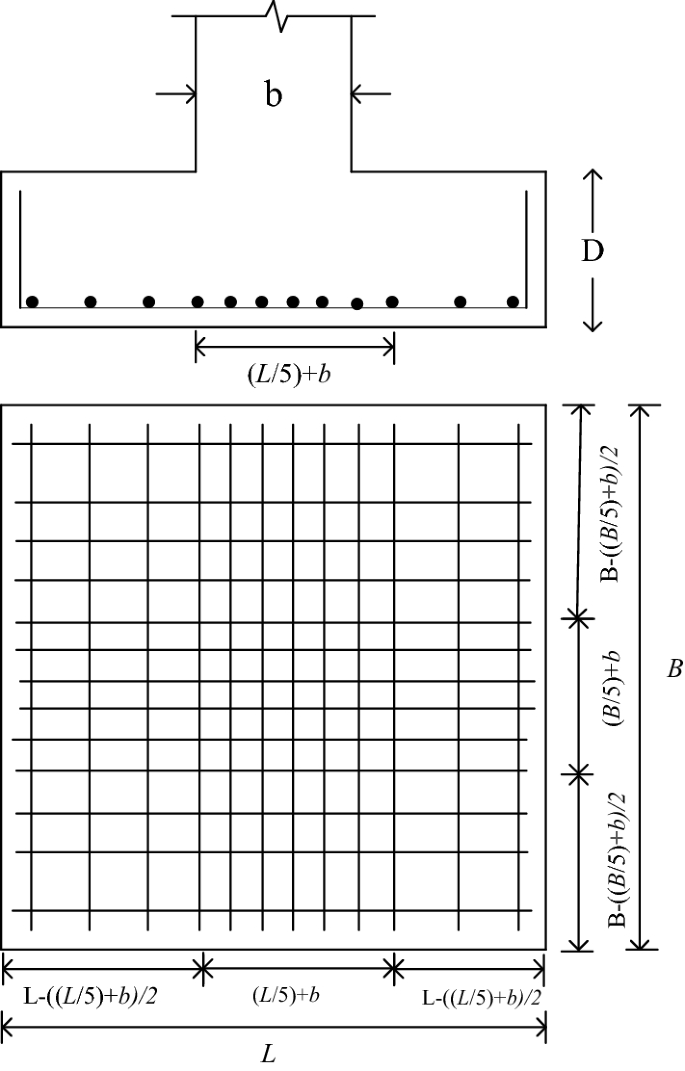
The proposed method for distribution of reinforcement by Reynolds et al. (2007) and Seward (2014) was shown not to be valid for all the cases, and the reinforcement placement recommended by IS456 (2000) was not applicable to a square footing. On the other hand, when the reinforcement sizing is inconsistent with the importance of the structures, it can cause serious damage (Sadaoui and Bahar 2017). Providing uniform reinforcement throughout the width was not appropriate, because the BM varies across the width of the footing. At the central zone of the footing, the BM is a maximum, and FEM produces larger moments than the conventional method. The distribution of reinforcements must be as per the BM distribution. Figure 11 shows the details of the reinforcement for maximum BM, and the central zone can be calculated using the following:
where L = B = length or width of footing and b width or depth of column.
The bending moment is more at the central zone, i.e., L/5 + b, and the remaining zone equals to L−(L/5 + b), is as shown in Fig. 11. The central zone covers 35–40% part of total length or width of footing. In addition, the excessive moment in this zone is found to be 40% more than average bending moment. Hence, 40% reinforcement of total reinforcement should be provided in this central zone.
Conclusions
The paper presented a simple approach to calculate the depth of and the placement of steel reinforcement for an isolated square footing under concentric loading. Observations were limited to square footings and columns with concentric loading. The working stress method (WSM) and the limit state method (LSM) failed to fulfill the rigidity requirements for a footing in the absence of sufficient width. The proposed procedure for calculating depth can be used in any case, because it gives a more conservative depth for lower subgrades and smaller depth for higher subgrades when compared to the existing methods. Depth calculated using the new approach agreed well with finite-element method (FEM), and also it satisfied the criterion for development length in compression (Ldc) for lower subgrades. For higher subgrades, depth should be calculated using the maximum of the LSM, the new approach, or minimum reinforcement approach. Reynolds’s handbook approach should not be used for higher subgrades, because it results in a lower depth than FEM. For the calculation of rigid depth, the total moment should be considered, which could be calculated by the conventional method or by Reynolds’s handbook equations.
Diagonal strip method (DSM) is not only a simple approach, but it is also an effective alternative to FEM for determining maximum bending moment (BM). The bending moments calculated with this method are nearly identical to the FEM results. Bending moments at the central zone and at the edge can be calculated using the bending moments of the DSM. Tensile reinforcement depends on the BM distribution. The proposed procedure of reinforcement distribution across the section of the footing is better than the conventional methods, which use uniform spacing of reinforcement, because this satisfies the BM distribution requirement. As per the proposed method, 40% of the total reinforcement must be provided at the central zone, because the BM distribution is highest here, and the remaining 60% should be placed in the remaining zones.
Abbreviations
- ACI:
-
American Concrete Institute
- BM:
-
Bending moment (kNm)
- DSM:
-
Diagonal strip method
- E c :
-
Modulus of elasticity of the concrete (kN/m2)
- E s :
-
Modulus of elasticity of the soil (kN/m2)
- FEM:
-
Finite-element method
- FS:
-
Factor of safety
- K r :
-
Relative stiffness factor
- K s :
-
Subgrade reaction (kN/m2)
References
Abdrabbo F, Mahmoud ZI, Ebrahim M (2016) Structural design of isolated column footings. Alex Eng J 55(3):2665–2678
ACI 336 (1988) Suggested design procedures for combined footings and mats, ACI 336.2R-88. American Concrete Institute, Farmington Hills
ACI Committee, American Concrete Institute, & International Organization for Standardization (2008) Building code requirements for structural concrete (ACI 318-08) and commentary. American Concrete Institute
Al-Aghbari MY, Dutta RK (2008) Performance of square footing with structural skirt resting on sand. Geomech Geoeng Int J 3(4):271–277
Al-Shayea N, Zeedan H (2012) A new approach for estimating thickness of mat foundations under certain conditions. Arab J Sci Eng 37(2):277–290
Bowles JE (1988) Foundation analysis and design, 3rd edn. McGraw-Hill international book company, Tokyo
British Standards Institution Eurocode 2 (2004) Design of concrete structures: part 1-1, General Rules and Rules for Buildings British Standards Institution
BS8110 (1997) Code of practice for design and construction Part 1. British Standards Institution, London
Computers and Structures (2010) CSI Analysis Reference Manual for SAP2000, ETABS, SAFE and CSiBridge. ISO No. GEN062708M1 Rev.4, Berkeley, California, USA
DIN4018 (1981) Beiblatt 1:1981-05 Baugrund “Berechnung der Sohldruckverteilung unter Flächengründungen”, Erläuterungen und Berechnungsbeispiele, Beuth, Berlin
ECP-Egyptian Code of Practice-203 (2011) Egyptian Code of Practice no-203 for Design and Construction of Concrete Structures, Research Center for Housing and Construction, Ministry of Housing, Utilities and Urban Planning, Cairo, Egypt
Farouk H, Farouk M (2014a) Soil, foundation, and superstructure interaction for plane two-bay frames. Int J Geomech 16(1):B4014003
Farouk H, Farouk M (2014b) Effect of soil type on contact stress. New Front Geotechn Eng 2014:57–66
FEMA 356 (2000) Prestandard and commentary for the seismic rehabilitation of buildings, Federal Emergency Management Agency, Washington, DC
IS 456 (2000) Plain and reinforced concrete code of practice. Bereau of Indian Standards, New Delhi
Jahanandish M, Veiskarami M, Ghahramani A (2012) Effect of foundation size and roughness on the bearing capacity factor, N γ, by stress level-based ZEL method. Arab J Sci Eng 37(7):1817–1831
Krishna JP, Jain OP (1959) Plain and reinforced concrete (8th Edition). Nem Chand and Bros, Roorkee
McCormac JC, Brown RH (2015) Design of reinforced concrete. Wiley, Hoboken
Meyerhof GT (1953) The bearing capacity of foundations under eccentric and inclined loads. In Proc. of 3rd ICSMFE, vol 1, pp 440–445
Moghaddas Tafreshi SN, Joz Darabi N, Tavakoli Mehrjardi G, Dawson A (2016) Experimental and numerical investigation of footing behaviour on multi-layered rubber-reinforced soil. Eur J Environ Civ Eng 2016:1–24
Prasad A, Singh V (2011) Behavior of confined square and rectangular footings under eccentric-inclined load. Int J Geotech Eng 5(2):211–221
Reynolds CE, Steedman JC, Threlfall AJ (2007) Reinforced concrete designer’s handbook, 11th edn. CRC Press, London
Rodriguez-Gutierrez JA, Aristizabal-Ochoa JD (2012) Rigid spread footings resting on soil subjected to axial load and biaxial bending I: simplified analytical method. Int J Geomech 13(2):109–119
Sadaoui O, Bahar R (2017) Field measurements and back calculations of settlements of structures founded on improved soft soils by stone columns. Eur J Environ Civ Eng 2017:1–27
Seward D (2014) Understanding structures, analysis, materials design. The Macmillan Press Ltd, London
Shehata HF, El-Zahaby KM (2016) New trends in foundation design using the finite element analysis method. Geo-China 1:1–8
SP16 (1978) Design aids for reinforcement concrete to IS: 456-1978. Bereau of Indian Standards, New Delhi, India
SP34 (1987) Handbook on concrete reinforcement and detailing. Bereau of Indian Standards, New Delhi, India
Tabsh SW, Raouf Al-Shawa A (2005) Effect of spread footing flexibility on structural response. Pract Period Struct Design Constr 10(2):109–114
Timoshenko S, Woinowsky-Krieger S (1959) Theory of Plates and Shells, 2nd edn. McGraw-Hill book Company, Singapore
Vesic AB (1961) Bending of beams resting on isotropic elastic solid. J Eng Mech Div 87(2):35–54
Vishwakarma RJ, Ingle RK (2017) Simplified approach for the evaluation of critical stresses in concrete pavement. Struct Eng Mech 61(3):389–396
Yang Y, Yu HS (2006) Application of a non-coaxial soil model in shallow foundations. Geomech Geoeng Int J 1(2):139–150
Author information
Authors and Affiliations
Corresponding author
Ethics declarations
Conflict of interest
On behalf of all authors, the corresponding author states that there is no conflict of interest.
Additional information
Publisher's Note
Springer Nature remains neutral with regard to jurisdictional claims in published maps and institutional affiliations.
Rights and permissions
Open Access This article is distributed under the terms of the Creative Commons Attribution 4.0 International License (http://creativecommons.org/licenses/by/4.0/), which permits unrestricted use, distribution, and reproduction in any medium, provided you give appropriate credit to the original author(s) and the source, provide a link to the Creative Commons license, and indicate if changes were made.
About this article

Cite this article
Magade, S.B., Ingle, R.K. Numerical method for analysis and design of isolated square footing under concentric loading. Int J Adv Struct Eng 11, 9–20 (2019). https://doi.org/10.1007/s40091-018-0211-3
Received:
Accepted:
Published:
Issue Date:
DOI: https://doi.org/10.1007/s40091-018-0211-3