
Abstract
Tertiary butyl alcohol in the groundwater was evaluated using closed leaking underground storage tank sites in Southern California between 2016 and 2019. Tertiary butyl alcohol is not regulated and lacks a maximum contaminant level in California. The current level of 12 µg per liter in drinking water (notification level) is advisory and not enforceable. As high as 88% of sites during 2018–2019 fiscal year were closed with tertiary butyl alcohol higher than its notification level in groundwater. Twenty-five percent of the time, the maximum tertiary butyl alcohol concentrations in the groundwater at closure were higher than 2,300 µg per liter during 2016–2017, 7,600 µg per liter during 2017–2018, and 4,400 µg per liter during 2018–2019, respectively. The plume length of the maximum tertiary butyl alcohol increased from 649 feet in 2016 to 1,128 feet in 2019. Considering the proximity of drinking water wells to the leaking underground storage tank sites in California, this points to an increase risk of impact on the drinking water resources. Tertiary butyl alcohol remained above 12 µg/L in a substantial percentage (70% in 2016–1017, 72% in 2017–2018, and 88% in 2018–2019) of sites. Site closure practices at Los Angeles Regional Water Quality Control Board should be more stringent toward tertiary butyl alcohol contamination. Despite documented health hazards, tertiary butyl alcohol has not received sufficient attention from government agencies. The toxicological evaluation of tertiary butyl alcohol indicates significant human health concerns. Based upon the toxicological evidence, an MCL should be considered for tertiary butyl alcohol in drinking water.
Introduction and background
Leaking underground storage tanks (LUSTs) or leaking underground fuel tanks (LUFTs) are the primary sources of tertiary butyl alcohol (TBA)-contaminated groundwater. TBA, an antiknock fuel oxygenate, can leak within the fuel, quickly dissolve in water, and contaminate the groundwater during the refining, distribution, and storage of oxygenated fuels. It can also form readily by biodegradation of methyl tertiary butyl ether (MTBE) (Schmidt et al. 2004; DeVaull et al. 2003; API 2012). Despite numerous documented health hazards, TBA, has not received sufficient attention from government agencies (Toumari and Suffet 2020).
The toxicological evaluation of TBA indicates significant human health concerns. Thus, a maximum contaminant level (MCL) should be considered for TBA in drinking water in California (Toumari and Suffet 2020). TBA is considered a non-regulated chemical by the California Health Department (California State Water Research Control Board (SWRCB) 2018). Therefore, the current health-based level for TBA in drinking water established by the California Health Department, called “notification level” (NL) or “action level,” is solely “advisory” and not enforceable. Currently, an NL of 12 µg per liter (µg/L) has been assigned for TBA. The Drinking Water Division of the SWRCB confirms that “NLs are advisory in nature and not enforceable standards.” (SWRCB 2018).
TBA is added directly to fuels as octane booster (American Petroleum Institute (API) 2012). It is also added to fuels, as a small impurity, along with MTBE or ethyl tertiary butyl ether (ETBE) (Shell Global Solutions 2003; ITRC 2009). In addition, TBA is a biotransformation product of MTBE degradation (Schmidt et al. 2004; DeVaull et al. 2003; API 2012) with anaerobic degradation rates ranging from 0.0035/day to 0.00035/day (half-lives of 0.54–5.4 years) at hydrocarbon-contaminated sites (Chisala et al. 2004). At several LUST sites, the concentration of TBA in groundwater is far greater than what can be expected from TBA as the primary oxygenate in the spilled gasoline (Wilson and Adair 2007). Based on the ratio of TBA to MTBE at gasoline LUST sites in Orange County, California, Wilson et al. (2005) showed how TBA occurring from biodegradation of MTBE could explain the concentrations of TBA at 85% of the sites evaluated.
The persistence and mobility of TBA in the subsurface have contributed to its presence and frequent detection in groundwater plumes and community water systems. However, to date, the state of knowledge is still quite limited for TBA. There are virtually no data on the environmental behavior of TBA, due primarily to difficulties in delineating its extent in the environment. The extent and magnitude of TBA contamination in the USA remains unknown. It is imperative that the environmental impacts of TBA are properly assessed, since limited evidence available suggests it would pose groundwater contamination threats similar to MTBE, if used in similar percent by volume amounts (Shih et al. 2004).
Figure 1 shows a side-by-side comparison of the locations of LUSTs in California and the locations of public drinking water wells. The figure “strongly suggests a high instance of proximity” (Hristova et al. 2010) and highlights concern that TBA in gasoline from LUSTs will find its way into deeper drinking water aquifers”.

The locations of LUSTs in California (left) and the locations of public drinking water wells (right) (Hristova et al. 2010)
LARWQCB comprises Los Angeles and Ventura counties, and portions of Kern and Santa Barbara counties. Specifically, data on the frequency of detection, maximum concentration, and contaminant plume length in groundwater of TBA at LUST sites in LARWQCB jurisdiction are presented. Contaminant plume length was the primary measure in this research because it reflected the potential of the contaminant to impact drinking water wells (California Water Resources Control Board 2005). Analyses of these data will provide information on the current extent and magnitude of impact to groundwater resources caused by TBA releases and provide a basis for the California Division of Drinking Water of SWRCB to consider adopting an MCL for TBA. LUST sites are particularly important because they represent major point sources of gasoline constituents and the leading cause of oxygenate groundwater contamination (Shih 2004). An extensive search of SWRCB Geotracker database (http://geotracker.waterboards.ca.gov; (Geotracker)) revealed that in LUST sites overseen by LARWQCB, some 8,770 known releases of gasoline have already occurred by the end of 2018 (California Water Resources Control Board 2005). Approximately 50% of the LUST sites in LARWQCB are located within 1-mile radius of a drinking water production well.
The objective of this paper is to assess the potential for groundwater contamination by TBA by examining its occurrence, distribution, and extent at LUST sites overseen by the Los Angeles Regional Water Quality Control Board (LARWQCB). Toumari and Suffet (2020) have previously discussed physical and chemical properties of TBA and ways the compound could impact human health and the environment. This paper focuses on site closure practices of the Los Angeles Water Board with respect to TBA and analyzes in detail the remaining concentration of TBA in Southern California groundwater as a result of these practices.
Evaluation of occurrence, distribution, and extent of TBA in the Los Angeles region and LARWQCB case closure procedure
The TBA data were collected from groundwater monitoring reports publicly available on Geotracker. These reports are prepared following sampling and laboratory analyses of groundwater monitoring wells installed at the LUST site and are submitted to LARWQCB semi-annually by environmental consulting firms on behalf of the site owners or responsible parties (RP). A LUST site closure is determined primarily based on the established procedures by SWRCB’s Low-Threat Closure Policy (LTCP 2005).
Low Threat Closure Policy (LTCP)
On May 1, 2012, SWRCB adopted a Low-Threat Underground Storage Tank Case Closure Policy (LTCP). The Policy, approved by the Office of Administrative Law on July 30, 2012, is a policy for water quality control and applies to all petroleum LUST sites subject to Chapter 6.7 of Division 20 of the Health and Safety Code and Chapter 16 of Division 3 of Title 23 of the California Code of Regulations (Health and Safety 2019). According to SWRCB, the purpose of this policy is to establish consistent statewide case closure criteria for low-threat petroleum UST sites. The policy seeks to increase LUST cleanup process efficiency in order to preserve the limited resources available for mitigation of releases posing a greater threat to human and environmental health (LTCP 2005). However, only certain petroleum constituents as described below have been considered by the LTCP to be harmful to human and environmental health. TBA is not included in this list. The LTCP comprises two main criteria, general and media-specific, and focuses on the following parameters:
-
Distance of the LUST site to the drinking water well(s).
-
Status of any light non-aqueous phase liquid (LNAPL or free product) in the subsurface.
-
Groundwater concentrations of total petroleum hydrocarbons as gasoline and diesel (TPHg, TPHd), benzene, ethylbenzene, MTBE, naphthalene, and poly-aromatic hydrocarbons (PAHs).
Appendix A presents the LTCP and describes the step-by-step approach required of the regulators to evaluate LUST sites for closure.
This research was conducted at the University of California, Los Angeles, during 2019–2020.
Materials and methods
Method of analysis and evaluation approach
-
Using Geotracker, the total number of closed LUST cases in LARWQCB jurisdiction during the past three years (2017 to 2019) was collected.
-
The maximum TBA concentrations for all of the above closed cases at the time of closure were obtained.
-
The number of wells containing TBA concentrations at the time of closure was recorded.
-
The “Domenico Model” (Tong & Rong 2013) was used to calculate the TBA plume length based on the TBA concentration in the source and the in the down-gradient wells as described in Appendix B.
-
The TBA plume in each case was laterally delineated by analyzing the groundwater gradient, the TBA concentration in the source well, and the TBA concentration(s) in the down-gradient well(s).
-
The above data were statistically analyzed as follows to gain an understanding on the closure practices of LARWQCB related to TBA.
-
Lateral delineation of the TBA plume was assessed using the source well and groundwater flow direction. The TBA plume was considered delineated if the TBA concentrations in the wells located in the direction of groundwater flow showed a decreasing trend. The cases for which the groundwater flow direction was variable were omitted.
Plume length determination
-
a.
Using TBA Iso-Concentration Maps
If the provided TBA iso-concentration map displayed a contour of 12 µg/L, the length of the 12 µg/L plume was measured in feet.
-
b.
Using Domenico Model
If the TBA iso-concentration map did not display a contour of 12 µg/L, the Domenico Spreadsheet Analytical Model Manual (Tong and Rong 2013) was used. The Domenico analytical model is based on the advection–dispersion partial-differential equation for organic contaminant transport processes in groundwater as described below (Domenico 1987):
where
Cx = contaminant concentration in a down-gradient well along the plume centerline at a distance x (mg/L),
C0 = contaminant concentration in the source well (mg/L),
x = centerline distance between the down-gradient well and source well (ft),
αx, αy, and αz = longitudinal, transverse, and vertical dispersivity (ft), respectively,
\(\lambda\) = degradation rate constant (1/day),
ν = groundwater velocity (ft/day),
Y - source width (ft),
Z - source depth (ft),
erf - error function,
exp - exponential function
Assumpltion:
-
(1)
Finite source dimension,
-
(2)
Steady-state source,
-
(3)
Homogeneous aquifer properties,
-
(4)
One-dimensional groundwater flow,
-
(5)
First-order degradation rate,
-
(6)
Contaminant concentration estimated at the centerline of the plume (California Water Resources Control Board 2020),
-
(7)
Molecular diffusion based on concentration gradient is neglected,
-
(8)
No retardation (e.g., sorption) in transport process
Results and discussion
A total of 263 LUST sites (sites) received low threat closure by LARWQCB from July 2016 till June 2019. Figure 2 shows the percentage of closed sites with TBA remaining in groundwater over a 3-year period. A total of 82 of these sites detected TBA higher than its NL (12 µg/L) at the time of closure.

Percent of closed sites with TBA remaining in groundwater
The median TBA concentration between 2016 and 2019 in the sites located in Region 4 was 1,200 µg/L. This concentration, which is 100 times greater than the NL and equal to the response level for TBA was used as a residual “concentration index” at the sites at the time of closure in the specified date range.
Table 1 shows the number of groundwater monitoring wells that detected TBA at the specified ranges in each fiscal year (FY). Four categories were selected; less than 12 µg/L, between 12 and 60 µg/L, between 60 and 1,200 µg/L and larger than 1,200 µg/L. 60 µg/L was selected because it is 5 times the NL, and 1,200 µg/L was selected because it is the median of maximum TBA concentrations at closure of all sites. Figure 3 shows the percentage of groundwater monitoring wells with the specified TBA concentration ranges detected at closure.

Percentage of groundwater monitoring wells with the specified TBA concentration ranges detected at closure
Figure 4 shows a “box and whisker” plot in log scale showing the median, minimum, maximum, 25th percentile, and 75th percentile of maximum TBA concentrations detected at all sites at closure in each FY. Along with each plot, the actual statistical values were provided for reference. As shown in Fig. 4, during 2016–2017, the median TBA concentration was 156 µg/L, and 25% of the time, TBA concentrations were higher than 2,300 µg/L. During 2017–2018, the median TBA concentration was 1,500 µg/L, and 25% of the time, TBA concentrations were higher than 7,600 µg/L. During 2018–2019, the median TBA concentration was 696.6 µg/L, and 25% of the time, TBA concentrations were higher than 4,434.3 µg/L.

Statistical data of maximum groundwater TBA concentrations at closure
TBA plume delineation was conducted in 9 sites during the FY 2016–2017 with an average of 230.9 feet, 22 sites during the FY 2017–2018 with an average of 211.9 feet, and 20 sites during the FY 2018–2019 with an average length of 328.70 feet. The Domenico Model could not be utilized to calculate plume length for some of the sites for reasons, such as variable groundwater flow direction, lack of plume delineation, and lack of down-gradient groundwater monitoring wells. As shown in Table 2 and Fig. 5, the maximum TBA plume lengths have continuously increased from 649 feet during the fiscal year 2016–2017 to 1,128 feet during the fiscal year 2018–2019. This is an alarming increase of more than 70% which raises questions regarding the Los Angeles Regional Water Board’s shift toward a more loosening policy on TBA contamination.

TBA plume length calculated by the domenico model
The assumptions made by (Tong and Rong 2013) in the Domenico Model to simplify calculations of plume lengths do not always reflect the reality of the subsurface conditions and therefore should not be ignored. In most LUST sites, a leak takes place over a period of time, and then it stops as the entire content is released or the tank is removed. Meanwhile, the soil can become the secondary source and “feed” the groundwater contamination. Depending on the lithology of the subsurface, such secondary source may or may not be considered to be releasing the fuel at steady state. Also, aquifer properties are almost never homogeneous. In addition, the one-dimensional assumption of groundwater flow is dependent on the homogeneity of the aquifer. As mentioned before, the degradation of TBA is slow especially under the naturally anaerobic environment of the subsurface at LUST sites. It is also heavily dependent on the characteristics of the microbial community of the site. Therefore, assuming a first-order degradation rate may not be always accurate.
A search of the Groundwater Ambient Monitoring and Assessment (GAMA) system created by the SWRCB in 2000 (GAMA 2020) revealed that during the three years from 2016 through 2019, TBA concentration in wells installed to monitor for landfill leachate in Southern California (LARWQCB jurisdiction) exceeded its NL 22 times. The maximum TBA concentration reported 360 µg/L and the median concentration was 210 µg/L.
Conclusion
Closing practices at LARWQCB should be more stringent toward TBA contamination. As high as 88% of LUST sites during 2018–2019 FY were closed with TBA higher than its NL remaining in the groundwater. Analysis of the maximum TBA concentrations in the groundwater at closure shows that 25% of the time, remaining TBA concentrations were higher than 2,300 µg/L during 2016–2017, higher than 7,600 µg/L during 2017–2018, and higher than 4,400 µg/L during 2018–2019.
The steady increase of the maximum TBA plume lengths from 649 feet during the fiscal year 2016–2017 to 1,128 feet during the fiscal year 2018–2019 is concerning. This is an alarming increase of more than 70% which raises questions on whether such increase is random, or whether it could reflect the LARWQCB’s shift toward a more loosening policy on TBA contamination. Considering the proximity of drinking water wells to the LUST sites in California in general, this points to an increase risk of impact on the drinking water resources.
A research work of systematic comparison between the TBA concentrations measured in the field and those calculated using the simplified Domenico Model should be conducted to assess the degree of accuracy of the model employed in this paper and in the closure practices of California regulators in general.
The data obtained from analyzing groundwater monitoring wells show that about 72% of the wells detected TBA concentrations of lower than 12 µg/L. While this is a positive outcome, one cannot ignore the fact that about 28% of the 998 wells investigated which amounts to 279 wells detected TBA at higher than 12 µg/L over three years. Considering the tendency of TBA to dissolve in groundwater and move with the groundwater flow; the slow natural degradation of TBA; and the close proximity of the drinking water wells to the vast number of groundwater monitoring wells installed at LUST sites in Southern California, the potential threat to drinking water sources at some point in the future is real.
References
American Petroleum Institute (API) (2012) Clean water bulletins, Bulletin 26, TBA Biodegradation. Available at https://www.api.org/oil-and-natural-gas/environment/clean-water/ground-water/bulletins
California Health & Safety Code Statutes of Chapter 6.7, Underground Storage of Hazardous Substances (2019) Available at https://www.waterboards.ca.gov/ust/regulatory/docs/hsc_6_7_01_2019.pdf
California State Water Resources Control Board (2018) Division of drinking water https://www.waterboards.ca.gov/drinking_water/certlic/drinkingwater/NotificationLevels.html. Accessed 27 December 2019
California Water Resources Control Board (2020) Division of water quality, groundwater ambient monitoring & assessment program (GAMA), available at https://www.waterboards.ca.gov/water_issues/programs/gama/about.html
California Water Resources Control Board, Low-Threat Underground Storage Tank Case Closure Policy (LTCP) (2005) Available at https://www.waterboards.ca.gov/board_decisions/adopted_orders/resolutions/2012/rs2012_0016atta.pdf.
Chisala BN, Tait NG, Lerner DN (2004) Evaluating the risk of methyl tertiary-butyl ether (MTBE) to urban groundwater. Hydrology: Science and Practice for the 21st Century. Volume II: 243–249.
DeVaull GE, Sun PT, Rhodes IAL, Walsh DF (2003) Study of tert-butyl alcohol (TBA) at selected underground storage tank remediation project sites in Orange County, California - Final Report. Houston, Texas: Shell Global Solutions
Domenico PA (1987) An analytical model for multidimensional transport of a decaying contaminant species. J Hydrol 91:49–58
Hristova K, Hicks K, Schmidt R, Scow K (2010) National institute of environmental health sciences, superfund research program, MTBE and TBA cleanup-new research perspectives. Available at https://tools.niehs.nih.gov/srp/programs/progress_report.cfm?project_id=P42ES0046990010&nOrder=6
Interstate Technology & Regulatory Council (2009) Evaluating LNAPL remedial technologies for achieving project goals
Schmidt TC, Schirmer M, Weiss H, Haderlein SB (2004) Microbial degradation of methyl tert-butyl ether and tert-butyl alcohol in the subsurface. J Contam Hydrol 70(3–4):173–203 ([PubMed: 15134874])
Shih T, Rong Y, Harmon T, Suffet M (2004) Evaluation of the impact of fuel hydrocarbons and oxygenates on groundwater resources. Environ Sci Technol 38:42–48
Tong W, Rong Y (2013) Domenico spreadsheet analytical model manual, underground storage tank section, California regional water quality control board-Los Angeles Region, Los Angeles, CA
Toumari A, Suffet IH (Mel) (2020) Evaluation of tertiary butyl alcohol (TBA) impact on groundwater: application to California. University of California at Los Angeles, Environmental Science & Engineering Program, Institute of the Environment and Sustainability, School of Letters and Science, Los Angeles, CA
Acknowledgements
Our sincere gratitude goes to Joe Leura, Amanda Davatolhagh and Ricky Huang (from Los Angeles Regional Water Quality Control Board) for helping with data processing and graphing tasks. Their contribution was a tremendous help in completing this manuscript. No funding was received for this article.
Funding
No funding was received for this article.
Author information
Authors and Affiliations
Corresponding author
Ethics declarations
Conflict of interest
No financial or non-financial conflict of interest exist.
Ethical approval
This article does not contain any studies with human participants or animals performed by any of the authors.
Additional information
Editorial responsibility: Samareh Mirkia.
Appendices
Appendix A
California state water resources control board
Low-threat closure policy guidelines
1. General criteria
General criteria that must be satisfied by all candidate sites are listed as follows:
-
(a)
The unauthorized release is located within the service area of a public water system;
-
(b)
The unauthorized release consists only of petroleum;
-
(c)
The unauthorized (“primary”) release from the UST system has been stopped;
-
(d)
Free product has been removed to the maximum extent practicable;
-
(e)
A conceptual site model that assesses the nature, extent, and mobility of the release has been developed;
-
(f)
Secondary source has been removed to the extent practicable;
-
(g)
Soil or groundwater has been tested for MTBE and results reported in accordance with Health and Safety Code section 25296.15; and
-
(h)
Nuisance as defined by Water Code section 13050 does not exist at the site.
2. Media-specific criteria
The most common exposure scenarios have been combined into three media-specific criteria:
2.1 Groundwater
The groundwater-specific criteria are divided into five main categories:
(1)
-
a.
The contaminant plume that exceeds water quality objectives is less than 100 feet in length.
-
b.
There is no free product.
-
c.
The nearest existing water supply well or surface water body is greater than 250 feet from the defined plume boundary.
(2)
-
a.
The contaminant plume that exceeds water quality objectives is less than 250 feet in length.
-
b.
There is no free product.
-
c.
The nearest existing water supply well or surface water body is greater than 1,000 feet from the defined plume boundary.
-
d.
The dissolved concentration of benzene is less than 3,000 µg per liter (μg/l), and the dissolved concentration of MTBE is less than 1,000 μg/l.
(3)
-
a.
The contaminant plume that exceeds water quality objectives is less than 250 feet in length.
-
b.
Free product has been removed to the maximum extent practicable, may still be present below the site where the release originated, but does not extend off-site.
-
c.
The plume has been stable or decreasing for a minimum of five years.
-
d.
The nearest existing water supply well or surface water body is greater than 1,000 feet from the defined plume boundary.
-
e.
The property owner is willing to accept a land use restriction if the regulatory agency requires a land use restriction as a condition of closure.
(4)
-
a.
The contaminant plume that exceeds water quality objectives is less than 1,000 feet in length.
-
b.
There is no free product.
-
c.
The nearest existing water supply well or surface water body is greater than 1,000 feet from the defined plume boundary.
-
d.
The dissolved concentration of benzene is less than 1,000 μg/l, and the dissolved concentration of MTBE is less than 1,000 μg/l.
(5)
-
a.
The regulatory agency determines, based on an analysis of site-specific conditions that under current and reasonably anticipated near-term future scenarios, the contaminant plume poses a low threat to human health and safety and to the environment and water quality objectives will be achieved within a reasonable time frame.
2.2 Petroleum vapor intrusion to indoor air
Petroleum release sites shall satisfy the media-specific criteria for petroleum vapor intrusion to indoor air and be considered low-threat for the vapor-intrusion-to-indoor-air pathway if:
-
a.
Site-specific conditions at the release site satisfy all of the characteristics and criteria of scenarios 1 through 3 as applicable, or all of the characteristics and criteria of scenario 4 as applicable; or
-
b.
A site-specific risk assessment for the vapor intrusion pathway is conducted and demonstrates that human health is protected to the satisfaction of the regulatory agency; or
-
c.
As a result of controlling exposure through the use of mitigation measures or through the use of institutional or engineering controls, the regulatory agency determines that petroleum vapors migrating from soil or groundwater will have no significant risk of adversely affecting human health.
Exception Exposures to petroleum vapors associated with historical fuel system releases are comparatively insignificant relative to exposures from small surface spills and fugitive vapor releases that typically occur at active fueling facilities. Therefore, satisfaction of the media-specific criteria for petroleum vapor intrusion to indoor air is not required at active commercial petroleum fueling facilities, except in cases where release characteristics can be reasonably believed to pose an unacceptable health risk.
Scenario 1: Un-weathered LNAPL in groundwater
Figure

Scenario 1: un-weathered LNALP in groundwater
6 shows the required characteristics of the bio-attenuation zone for scenario 1:
-
1.
The bio-attenuation zone shall be a continuous zone that provides a separation of at least 30 feet vertically between the LNAPL in groundwater and the foundation of existing or potential buildings; and 2. Total TPH (TPH-g and TPH-d combined) are less than 100 mg/kg throughout the entire depth of the bio-attenuation zone
Un-weathered LNAPL is generally understood to mean petroleum product that has not been subjected to significant volatilization or solubilization and therefore has not lost a significant portion of its volatile or soluble constituents (e.g., comparable to recently dispensed fuel).
Scenario 2: Un-weathered LNAPL in Soil
Figure

Scenario 2: un-weathered LNAPL in soil
7 shows the required characteristics of the bio-attenuation zone for scenario 2.
-
1.
The bio-attenuation zone shall be a continuous zone that provides a separation of at least 30 feet both laterally and vertically between the LNAPL in soil and the foundation of existing or potential buildings, and 2. Total TPH (TPH-g and TPH-d combined) are less than 100 mg/kg throughout the entire lateral and vertical extent of the bio-attenuation zone
Scenario 3—Dissolved phase benzene concentrations in groundwater (Low concentration groundwater scenarios with or without oxygen data)
Figure

Scenario 3 dissolved phase benzene concentration in groundwater
8 shows the required characteristics of the bio-attenuation zone for scenario 3.
Scenario 4—Direct measurement of soil gas concentrations
Figure

Scenario 3 dissolved phase benzene concentration in groundwater
9 shows the required characteristics of the bio-attenuation zone for scenario 4.
The criteria in Table
3 apply unless the requirements for a bio-attenuation zone, established below, are satisfied.
When applying the criteria below, the soil gas sample must be obtained from the following locations:
-
a.
Beneath or adjacent to an existing building: The soil gas sample shall be collected at least five feet below the bottom of the building foundation.
-
b.
Future construction: The soil gas sample shall be collected from at least five feet below ground surface.
See Table 3
Direct contact and outdoor air exposure
The LTCP describes conditions where direct contact with contaminated soil or inhalation of contaminants volatized to outdoor air poses a low threat to human health. Release sites where human exposure may occur satisfy the media-specific criteria for direct contact and outdoor air exposure and will be considered low-threat if they meet any of the following:
-
a.
Maximum concentrations of petroleum constituents in soil are less than or equal to those listed in Table
Table 4 Concentrations of petroleum constituents in soil that will have no significant risk of adversely affecting human health 4 for the specified depth below ground surface (bgs). The concentration limits for 0 to 5 feet bgs protect from ingestion of soil, dermal contact with soil, and inhalation of volatile soil emissions and inhalation of particulate emissions. The 5 to 10 feet bgs concentration limits protect from inhalation of volatile soil emissions. Both the 0 to 5 feet bgs concentration limits and the 5 to 10 feet bgs concentration limits for the appropriate site classification (Residential or Commercial/Industrial) must be satisfied. In addition, if exposure to construction workers or utility trench workers are reasonably anticipated, the concentration limits for utility worker must also be satisfied.
-
b.
Maximum concentrations of petroleum constituents in soil are less than levels that a site-specific risk assessment demonstrates will have no significant risk of adversely affecting human health.
-
c.
As a result of controlling exposure through the use of mitigation measures or through the use of institutional or engineering controls, the regulatory agency determines that the concentrations of petroleum constituents in soil will have no significant risk of adversely affecting human health.
The policy emphasizes the importance of the site conceptual model and the vital role it has in identifying special attributes that might alter the regulatory agency’s decision for closure.
See Table 4.
Appendix B
Sample TBA plume length calculation using domenico model
See Table
5.
See Figs.

Groundwater flow gradient at a LUST site
10,

TBA concentration map at a LUST site
11.
Calculation steps
-
Find the source well with the highest TBA concentration and one down-gradient well with decreasing TBA concentrations along (or near) the centerline.
-
Measure the distance between the source well and the down-gradient well (in feet).
-
Enter the distance and concentrations of the two wells (Fig.
Fig. 12 
Off-centerline conversion to centerline distance
12). If the down-gradient well is not along the centerline, measure the off-center line angle as well as distance in feet.
-
Enter the information in the spreadsheet, and the centerline distance (ft) will be given (Fig.
Fig. 13 
Distance and concentration inputs
13).
-
Enter the given distance (Fig. 12).
-
A model evaluation graph will then show the source well plotted with a linear line and the down-gradient well.
-
Manipulate the longitudinal dispersivity of the aquifer (αx), groundwater velocity (v), and degradation rate constant (λ) within the allowable ranges (αx: 0.35–4 ft, v: 0.01–0.5 ft/day, λ: 0.1–0.001 day−1) until the line passes both the source well and the down-gradient well (Fig.
Fig. 14 
Spreadsheet model evaluation
14).
-
The distance to the source well from a plume boundary of 12 µg/L is given (Fig.
Fig. 15 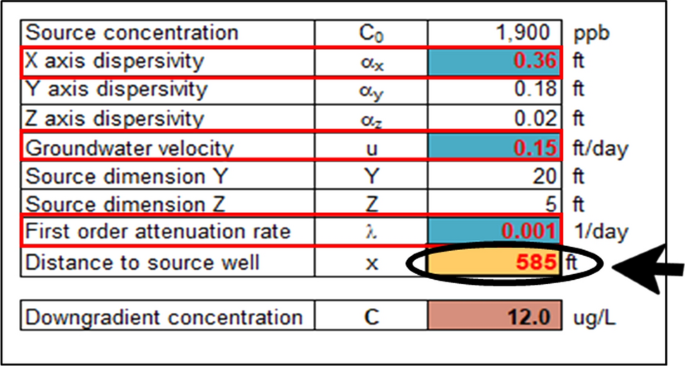
Domenico model parameters
15).


Rights and permissions
Open Access This article is licensed under a Creative Commons Attribution 4.0 International License, which permits use, sharing, adaptation, distribution and reproduction in any medium or format, as long as you give appropriate credit to the original author(s) and the source, provide a link to the Creative Commons licence, and indicate if changes were made. The images or other third party material in this article are included in the article's Creative Commons licence, unless indicated otherwise in a credit line to the material. If material is not included in the article's Creative Commons licence and your intended use is not permitted by statutory regulation or exceeds the permitted use, you will need to obtain permission directly from the copyright holder. To view a copy of this licence, visit http://creativecommons.org/licenses/by/4.0/.
About this article

Cite this article
Toumari, A., Suffet, I.H. Tertiary butyl alcohol plumes in southern california groundwater from leaking underground storage tank sites. Int. J. Environ. Sci. Technol. 20, 1779–1792 (2023). https://doi.org/10.1007/s13762-022-04112-z
Received:
Revised:
Accepted:
Published:
Issue Date:
DOI: https://doi.org/10.1007/s13762-022-04112-z