Abstract
As the global push for sustainable urban development progresses, this study, set against the backdrop of Hangzhou City, one of China’s megacities, addressed the conflict between urban expansion and the occurrence of urban geological hazards. Focusing on the predominant geological hazards troubling Hangzhou—urban road collapse, land subsidence, and karst collapse—we introduced a Categorical Boosting-SHapley Additive exPlanations (CatBoost-SHAP) model. This model not only demonstrates strong performance in predicting the selected typical urban hazards, with area under the curve (AUC) values reaching 0.92, 0.92, and 0.94, respectively, but also, through the incorporation of the explainable model SHAP, visually presents the prediction process, the interrelations between evaluation factors, and the weight of each factor. Additionally, the study undertook a multi-hazard evaluation, producing a susceptibility zoning map for multiple hazards, while performing tailored analysis by integrating economic and population density factors of Hangzhou. This research enables urban decision makers to transcend the “black box” limitations of machine learning, facilitating informed decision making through strategic resource allocation and scheduling based on economic and demographic factors of the study area. This approach holds the potential to offer valuable insights for the sustainable development of cities worldwide.
Explore related subjects
Discover the latest articles, news and stories from top researchers in related subjects.Avoid common mistakes on your manuscript.
1 Introduction
The concept of urban sustainability was first proposed by the Brundtland Commission in 1987 (Redclift 1989), and since then, it has been widely adopted and integrated into urban planning strategies worldwide. However, as urban areas expand and populations increase, cities face the growing challenge of balancing this development with the mitigation of geological hazards (Zhou and Zhao 2013; Chen et al. 2022; Lu et al. 2022). The confluence of rapid urbanization and the inherent vulnerabilities to seismic, hydrological, and subsurface events creates a paradox, and the very high density of infrastructure that characterize urban growth can amplify the risks of such hazards (Chen et al. 2012; Zhang and Li 2020). Addressing this conflict is not only critical for safeguarding human life and property but also for the resilience and continuity of urban progress in harmony with the environment (Godschalk 2003; Etinay et al. 2018; Gu et al. 2018). As countries worldwide endeavor to construct sustainable cities, China’s urban areas are also actively embracing the principles of sustainable development (Liu et al. 2014; Wang and He 2015). Hangzhou City is one of China’s 10 megacities, with a permanent population exceeding 10 million, a per capita GDP on par with developed nations (Zhou et al. 2022), and was named China’s Happiest City for 17 consecutive years. However, according to the survey data from the Zhejiang Geological Survey, as of 2022, Hangzhou had identified 1055 geological hazard sites, and three types of hazards are widely distributed in its urban areas. Urban road collapses have caused the most casualties, land subsidence is the most widespread and has resulted in the largest economic losses, while karst collapses appeared the earliest and caused significant challenges for Hangzhou in the past when technology was not yet advanced. Urban road collapse is caused by the formation and expansion of underground voids, often resulting from groundwater erosion, drainage system leaks, or underground construction activities (Wang et al. 2022). These collapses jeopardize road safety, disrupt residents’ mobility, and can lead to significant property losses, sometimes resulting in casualties (Wang and Xu 2022; Wang et al. 2023). Karst collapse occurs when soluble rocks like limestone are dissolved by solution processes, creating underground voids that, when large enough, cause the surface to lose support and collapse (Papadopoulou-Vrynioti et al. 2013; Gutiérrez et al. 2014). Such collapses are common in karst geological areas and threaten the stability of buildings and infrastructure (De Waele et al. 2011). Land subsidence is typically caused by excessive groundwater extraction, overloading of the land, or changes in geological structures, which, over time, can damage urban infrastructure, affecting the efficiency of surface water discharge and urban drainage systems (Hu et al. 2004; Bagheri-Gavkosh et al. 2021; Shirzaei et al. 2021).
Susceptibility mapping is a critical component in evaluating and predicting geological hazards (Sun 2024; Yan et al. 2024; Yu et al. 2024), which integrates geological environmental conditions with factors that cause and trigger hazards, aiming to forecast the likelihood of geological disasters in specific areas. For susceptibility mapping of urban areas, considering that multi-hazards are crucial, the concept of multi-hazard analysis, a term used by the United Nations in sustainable development and Agenda 21 for risk reduction and disaster management (Gray 1990), becomes vital for better regional planning, as it allows for a comprehensive understanding of the interplay between different hazards, enabling a thorough assessment of geological safety risks in a given area. Over the past decades, scientific research on multi-hazards has become more common, yet remains a challenge for twentyfirst century researchers due to the complexity of integrating diverse datasets, the need for advanced modeling techniques, and the difficulty in predicting the combined effects of multiple hazards (Shi et al. 2016; Pourghasemi et al. 2020; Shi et al. 2020; Alikaei et al. 2023). Due to the complexity of urban regions and the smaller, more dispersed nature of disaster points, knowledge-driven methods, particularly analytical hierarchy process (AHP), have been commonly used in such evaluations (Wu et al. 2018; Wei et al. 2021; Haghiri et al. 2024). However, as the demand for more accurate disaster assessments grows, the limitations of the AHP method, notably its reliance on the subjective judgment of experts for weighting factors, become increasingly apparent (Ishizaka and Labib 2009; Munier et al. 2021). This has led researchers to explore data-driven models, which have been noted for their broad application in assessing the susceptibility of large-scale geological disasters like landslides and floods (Li et al. 2023; Liu et al. 2023). Unlike traditional models, data-driven models can handle more complex datasets and ensure prediction accuracy through extensive data training (Jordan and Mitchell 2015; Sharifani and Amini 2023). Decision tree models, as an essential part of supervised learning, are favored for their ability to visually represent decision processes and ensure model stability (Kotsiantis 2013; Costa and Pedreira 2023). Among these models, CatBoost is particularly effective at handling categorical data without extensive preprocessing. Unlike other models such as XGBoost, its unique algorithm for dealing with categorical features prevents overfitting and improves prediction accuracy. Additionally, CatBoost uses ordered boosting to reduce target leakage and enhance generalization. Known for its fast training speed and efficiency with large datasets, CatBoost proves superior for our binary classification problem. These advantages enable more accurate and reliable predictions in assessing small-scale geological hazards in Hangzhou (Hancock and Khoshgoftaar 2020). Meanwhile, in geological evaluations, outcomes often represent just one aspect. The evaluation process and subsequent actions hold more significance in practical applications, leading to the underutilization of data-driven models in real-world scenarios due to their “black box” nature (Castelvecchi 2016; Rudin 2019). Thus, explainable models have become a crucial link between data-driven models and real-world decision making. Within the realm of explainable AI (XAI), SHAP (SHapley Additive exPlanations) emerges as a key tool (Van den Broeck et al. 2022). It treats each model feature as a player in a “game,” revealing the relationships between features or between features and the model (Marcílio and Eler 2020), enhancing the reliability of machine learning and facilitating urban decision makers in making informed plans. Although the application of machine learning interpretability model in urban hazard assessment has seen some exploration, it remains a relatively uncharted territory with significant potential for further development.
Our study introduced a novel CatBoost-SHAP model for the assessment of multi-hazards within the plain area of Hangzhou, marking its first application in evaluating urban geological hazards. The integration of the SHAP interpretability model into the multi-hazard analysis helps enhance the transparency and understanding of the model’s decision-making process, thus facilitating a deeper insight into the factors that influence geological hazards, which is designed to aid urban planners and policymakers by providing a comprehensive and interpretable tool for better informed decision making in urban development. In conclusion, by integrating SHAP-based multi-hazard susceptibility assessments with analyses of urban economic conditions and population dynamics, policymakers can more efficiently distribute resources and govern various sectors in harmony with the city’s development objectives. This approach also provides a replicable model of reference for other major cities around the world.
2 Background
In this section, we provide an overview of the study area and the geological hazard background. We also introduce the evaluation indicators selected for the susceptibility assessment. The data used in this study include two parts. The first part consists of evaluation indicators and the status of hazards, which were derived from the internal documents of the Hangzhou Urban Geological Safety Survey ProjectFootnote 1 by the China Geological Survey, Nanjing Center, and they are currently unavailable to the public. The second part consists of publicly accessible data, such as zoning and economic and population statistics for Hangzhou City. Although we obtained these data through collaboration with the Geological Survey of Zhejiang Province, they are also accessible via the Hangzhou City government website.Footnote 2
2.1 Study Area Overview
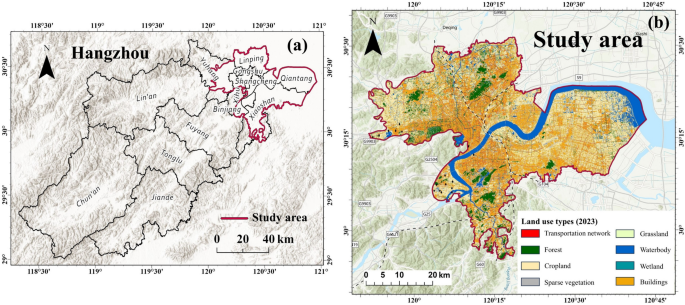
Hangzhou is in the eastern part of China, in the northern region of Zhejiang Province (Fig. 1a). As of 2023, it has a permanent population of 12.522 million and its gross domestic product (GDP) has reached RMB 2005.9 billion yuan. The Hangzhou Plain area (Fig. 1b), situated in the northeastern part of the city, covers a total area of 4381.3 m2, accounting for 26.4% of the city’s total area. Despite its size, this area contributes over 50% of Hangzhou’s GDP.
2.2 Geological Hazards
In this section, we describe the three primary geological hazards in the study area, encompassing their distribution characteristics, the nature of the hazards, and their impacts on the study region. This section provides a detailed overview of each hazard type, illustrating where these hazards are most prevalent and discussing their specific attributes and consequences.
2.2.1 Land Subsidence
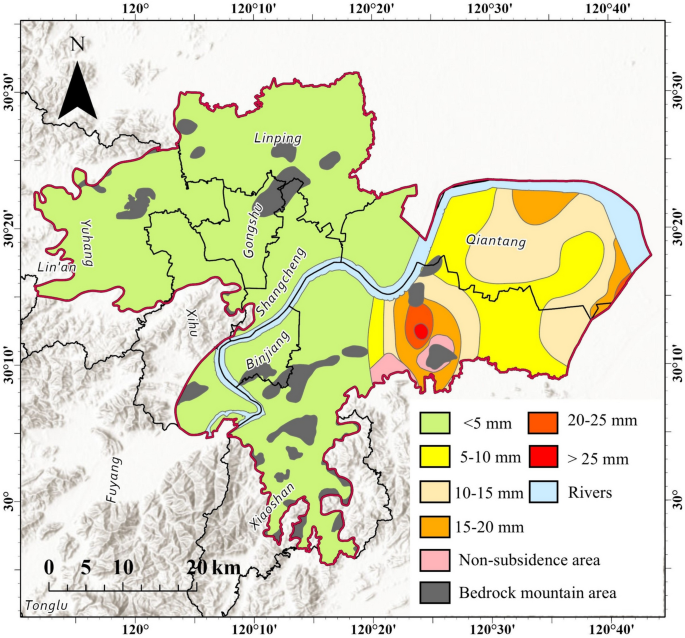
Between 2010 and 2021, the area in Hangzhou that experienced a cumulative land subsidence of more than 100 mm was approximately 8.4 km2, accounting for about 0.3% of the total area in the city. Moreover, over 80% of the total subsidence area in Hangzhou occurred within the study area. These subsidence areas are widely distributed within the study region, causing an average annual loss of over USD 1 billion. According to the Geological Survey of Zhejiang Province, the main areas affected include Xiaoshan District, Qiantang District, Linping District, and Xihu District, with the highest recorded subsidence reaching 127.5 mm within Xiaoshan District. The Hangzhou Plain is influenced by complex ancient topography and geomorphology, as well as drastic changes in ancient climate, multiple fluctuations in the sea level, and neotectonic movements since the Quaternary period. The region’s Quaternary sediments have undergone multiple cycles of accumulation and erosion, developing a complex set of terrestrial and marine-terrestrial interfacial sedimentary strata. The status of cumulative land subsidence of the study area is shown in Fig. 2.
2.2.2 Urban Road Collapse
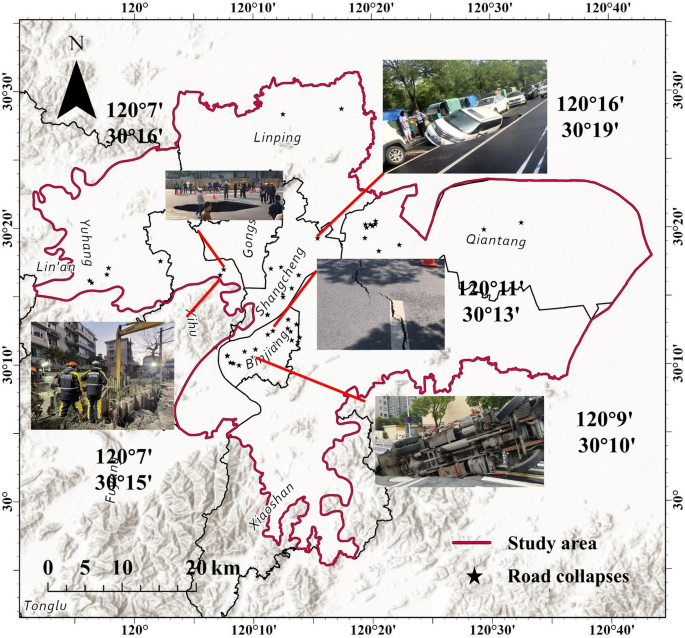
Road collapses in Hangzhou City are primarily located in the Binjiang, Xihu, and Xiaoshan Districts. Over the past 20 years, there have been a total of 14 collapse incidents in these areas, resulting in 6 deaths and over USD 300 million in economic losses. Within the study area, several serious urban road collapse incidents have occurred. For instance, on 29 December 2020, a sudden road collapse occurred on the pedestrian path of the Qingfeng New Village section of Xixi Road in Xihu District, covering an area of about 25 m2 and resulting in two fatalities. These areas are widely distributed with silty soil, sandy soil, soft soil, and hidden rivers, along with widespread artificial fill, making the geological conditions complex. Based on the analysis of 14 road collapse cases, the collapse depth was generally within the fill range or within 3 m of the boundary between the fill layer and the underlying strata, with a fill thickness of generally 1–5 m, and a collapse depth of generally 1–3 m. Artificial fill and silty soil are the main geological factors leading to road collapses in Hangzhou. The spatial distribution of road collapses is significantly correlated with the distribution of sandy soil layers, artificial fill, and underground utilities. The urban road collapses of the study area are shown in Fig. 3.
2.2.3 Karst Collapse
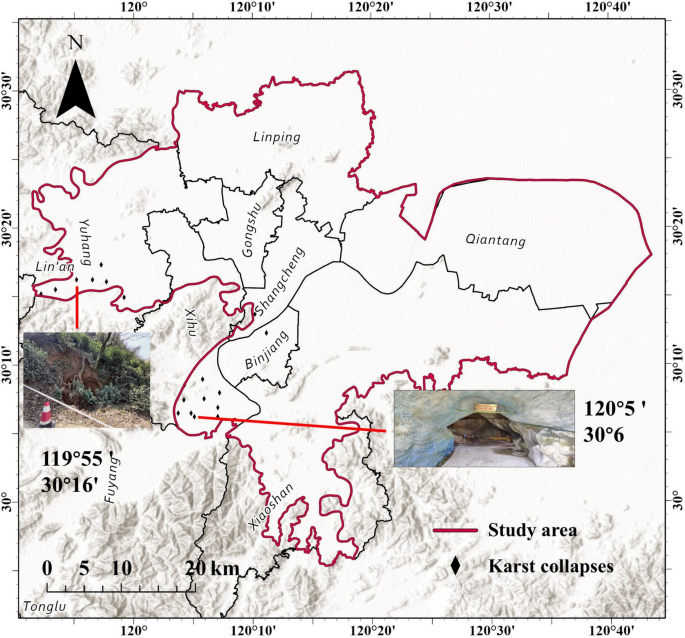
Since records began in 1964, Hangzhou City has experienced 26 instances of karst collapse of varying sizes, primarily located in the Xihu area, with a total of 14 collapses. These incidents resulted in one fatality, two injuries, and caused uneven land subsidence, cracking, building damage, and building collapse, leading to significant economic losses. The occurrence of karst collapses is closely related to human activities such as water extraction, underground construction, and drainage. Geologically, the development of underground karst, with calcium oxide content generally above 45%, and limestone that is easily eroded by surface water and groundwater contribute to the complexity of hydrogeological conditions. Human engineering activities such as subway and tunnel construction are a major cause of karst collapse in the study area. The status of karst collapses of the study area is shown in Fig. 4.
2.3 Evaluation Indicators
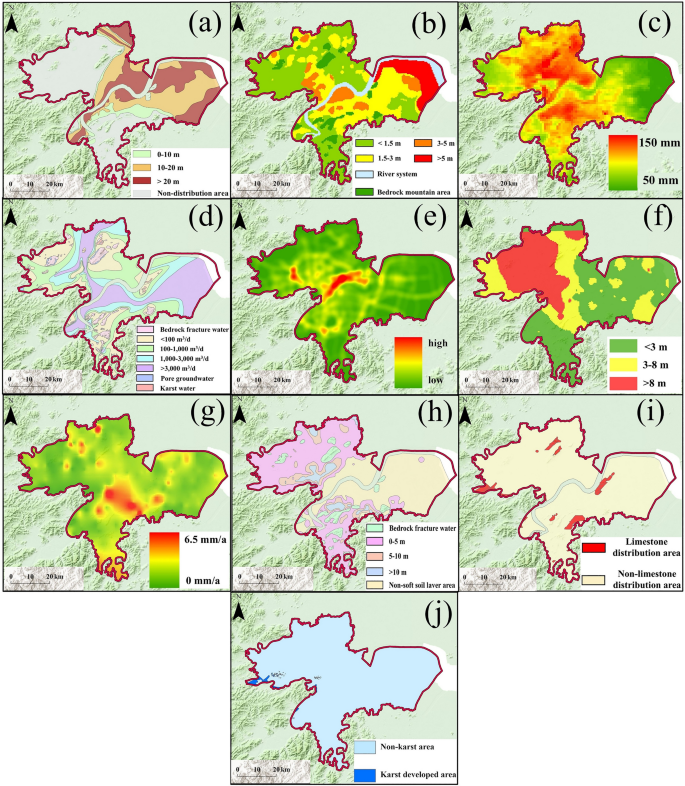
Following a comprehensive inspection of urban hazards in the study area by the Zhejiang Geological Survey and the China Geological Survey, Nanjing Center, the research identified that the urban geological hazards in the study area are primarily related to marine and river-lake soft soils, the abundance of groundwater, rainfall, and the disturbance of groundwater levels and strata by human engineering activities. Consequently, the 10 factors presented in Table 1 and Fig. 5 were selected as evaluation indicators for susceptibility mapping in this study. The ten factors were categorized into three groups based on their characteristics: hydrological conditions, geological conditions, and human activity intensities. Hydrological conditions include groundwater richness, the burial depth of the underground confined water level, and rainfall, which influence ground stability by altering underground waterflow and pressure (Miller and Sias 1998; Machowski et al. 2016). Geological conditions encompass factors that affect soil and rock stability, such as the burial depth of the top layer of saturated silty sand soil, thickness of the surface fill layer, karst and limestone distribution, thickness of the soft soil layer, and subsidence rate. These factors are directly related to the potential for land collapse or subsidence (Cui et al. 2015). Human activity intensities, primarily represented by the density of major linear projects, affect geological stability through increased ground load or alterations in underground water dynamics (Al-Qubatee et al. 2022; Zhang and Wang 2022). Table 2 presents the factors associated with different hazards and their categories.
Multi-hazard risk evaluation indicators: a Burial depth of the top layer of saturated silty sand soil; b thickness of the surface fill layer; c rainfall; d groundwater richness; e major linear project density; f burial depth of the underground confined water level; g subsidence rate; h soft soil layer thickness; i limestone distribution; j Karst distribution
3 Methodology
In this section, we introduce the principles and advantages of the CatBoost model, as well as the parameters we used for training the model. We also explain the principles of the SHAP interpretability method.
3.1 Categorical Boosting (CatBoost) Model
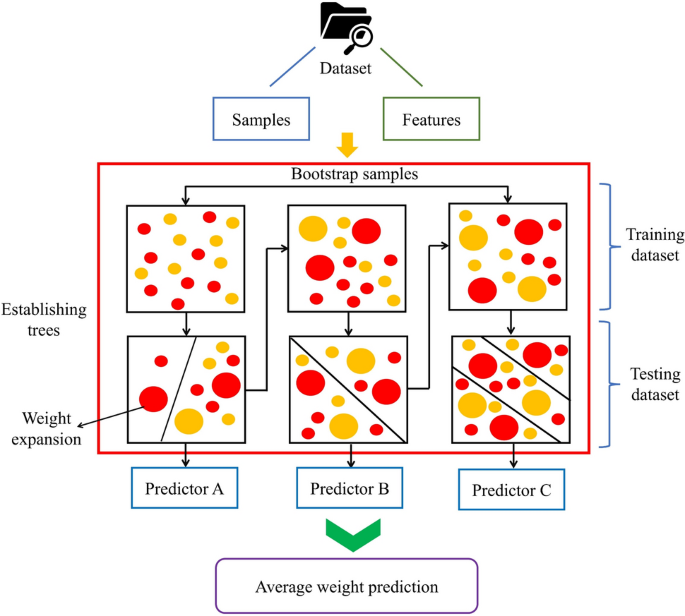
Categorical Boosting distinguishes itself as an innovative gradient boosting algorithm, specifically engineered to enhance the handling of categorical data with unparalleled efficiency and accuracy (Prokhorenkova et al. 2018). This algorithm, developed in 2018, is achieved through a distinctive ensemble of decision trees constructed sequentially, utilizing an additive approach to progressively correct the residuals from preceding trees. The principles of the CatBoost algorithm are illustrated in Fig. 6. Unique to CatBoost are two pivotal innovations: ordered boosting and direct categorical feature processing. Ordered boosting diverges from traditional boosting methods by leveraging a randomly selected data subset at each iteration for gradient learning, effectively minimizing overfitting and thereby augmenting the model’s generalizability (Hancock and Khoshgoftaar 2020; Ibrahim et al. 2020). Concurrently, CatBoost’s native processing of categorical variables circumvents the need for one-hot encoding, employing a specialized algorithm that calculates statistics on categorical features in relation to the target variable. The predictive model in CatBoost is formalized as Eq. 1:
where \(\hat{y}_{i}\) denotes the predicted outcome for the \(i\)-th instance, \(f_{k}\) represents the decision function of the \(k\)-th tree, and \(k\) is the total number of trees in the ensemble. The objective function of CatBoost integrates a loss component and a regularization term to effectively control the model’s complexity, which is shown as Eq. 2:
where \(l\) signifies the loss function, measuring the discrepancy between predicted values \(\hat{y}_{i}\) and actual targets \(y_{i}\), and \(\Omega\) denotes the regularization term, imposing penalties on the model’s complexity to avert overfitting.
Before training the model, it is essential to meticulously prepare the data, ensuring that it is appropriately organized and clean (Brownlee 2020). Moreover, dividing the data into training and testing sets is imperative. The training set is used to train the model, allowing it to learn the underlying patterns within the data. In contrast, the testing set serves as a separate, unbiased dataset to evaluate the model’s performance and generalizability to unseen data. This division helps in minimizing overfitting and maximizing the model’s ability to make accurate predictions on new data (Storkey 2009; Medar et al. 2017). In our study, 70% of the data was allocated as the training set, with the remaining portion serving as the test set, which is a standard practice in machine learning for assessing various geological hazards (Tehrany et al. 2014). The evaluation indicators extracted using ArcGIS 10.8 software were delineated into “target” and “features,” where the target refers to hazard samples and the features are the evaluation factors. Within the framework of the training set, the model is tasked with discerning the intricate correlations between these “target” and “features” to facilitate accurate predictions (Bishop 2006). Distinct regions are annotated with binary values, 1 or 0, indicative of severe and mild urban geological hazards, respectively. Consequently, the model evaluates the probability of each area within the study domain being identified as severely impacted by hazards (denoted by a value of 1). The derived probabilities are then employed in susceptibility mapping, an established method for assessing susceptibility to geological hazards (Ganesh et al. 2023; Lyu and Yin 2023). During model training, to ensure reliable comparisons, the CatBoost model was configured with 100 trees (weak learners), and the maximum depth of each tree was limited to 3 to avert overfitting. The learning rate was fixed at 0.1. The prediction mechanism of the ensemble model aligned with that of the individual models.
3.2 SHapley Additive exPlanations (SHAP)
In the realm of machine learning, understanding the influence of individual features on model predictions is paramount. SHapley Additive exPlanations (SHAP), a method grounded in cooperative game theory, serves as a pivotal tool for this purpose. It employs the Shapley value concept to equitably attribute the outcome of a collaborative effort among features in a predictive model. SHapley Additive exPlanations elucidates how each feature contributes to shifting the model’s prediction away from a baseline value, typically the mean of the target values in the training set. The consistency principle is central to SHAP’s approach, which ensures that any change in a model’s dependency on a feature is accurately reflected in the SHAP values. This makes SHAP a reliable method for detailing the importance and effect of features on model predictions.
The computation of SHAP values considers the marginal contribution of a feature by examining all possible combinations of features. This is formally represented as Eq. 3:
where \(F\) is the set of all features, \(S\) represents a subset of these features excluding feature \(j\), \(f\left( S \right)\) is the model’s prediction with the subset \(S\), and \(f\left( {S \cup \left\{ j \right\}} \right)\) is the prediction when feature \(j\) is included. This formula assesses the average impact of adding feature \(j\) to different combinations of features, highlighting its unique contribution.
4 Results
This section presents the results from our analyses. In Sect. 4.1, we demonstrate the process of evaluating model accuracy using the receiver operating characteristic (ROC) curves. In Sect. 4.2, we display the susceptibility maps for individual hazards and multi-hazards in the study area. In Sect. 4.3, we present the results and analysis of model interpretation using SHAP plots. In Sect. 4.4, we provide a further analysis of the susceptibility results in relation to the current economic and demographic conditions of the study area.
4.1 Accuracy Assessment
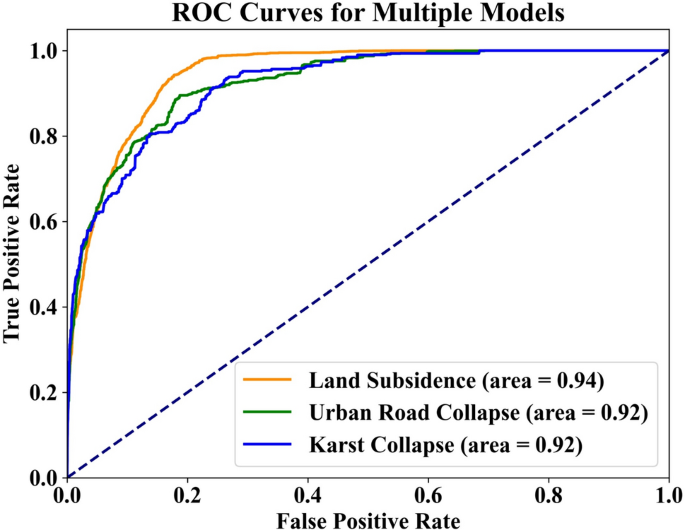
After completing the predictions, the model’s accuracy was assessed using the area under the curve-receiver operating characteristic (ROC-AUC) metric, which serves as a pivotal metric for evaluating and comparing the efficacy of predictive models in geological hazards analysis (Pham et al. 2020; Wang et al. 2020). The AUC represents the integral of the ROC curve, offering a single scalar value between 0 and 1 to quantify model discrimination capacity, that is, how well the model can differentiate between positive and negative instances without being tied to a specific classification threshold. Ideal performance is indicated by an AUC of 1, implying perfect separation of classes, whereas an AUC of 0.5 suggests no better accuracy than random guessing. For this study, the ROC-AUC curve is shown in Fig. 7. As indicated by the curve, the model demonstrates excellent performance in predicting all three types of hazards.
4.2 Susceptibility Mapping
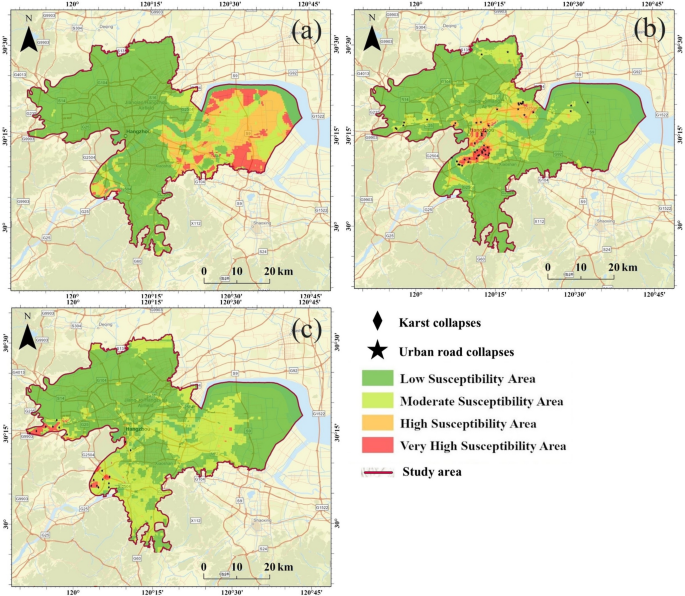
Following the completion of model predictions, the training and testing datasets were combined. Subsequently, all datapoints were collected and integrated into the ArcGIS 10.8 software, facilitating the generation of susceptibility maps for the entire area under investigation. The likelihood of subsidence areas being allocated a value of 1 (within a range of 0 to 1) underwent reclassification via the equal interval method. This process delineated the study area into four distinct susceptibility categories: low (0–0.25), moderate (0.25–0.5), high (0.5–0.75), and very high susceptibility (0.75–1). In the single-hazard susceptibility map, Qiantang and Xiaoshan Districts are primarily susceptible to land subsidence. Binjiang, Xihu, and Xiaoshan Districts are mainly susceptible to road collapse, while karst areas, specifically West Lake District, along with sporadic distribution in other limestone-developed areas, are susceptible to karst collapse. The susceptibility mapping results show a high degree of overlap with the distribution of hazard points. The susceptibility mapping outcomes for each type of hazard are depicted in Fig. 8, which shows the specific susceptibility zones and hazard incidents. Table 2 includes their respective shares of the total study area and further details.
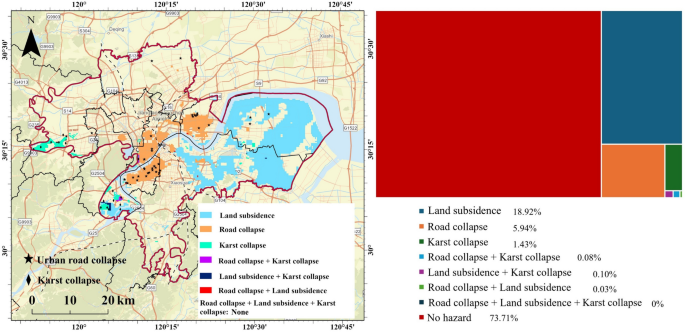
Although the susceptibility map of a single hazard can effectively show the likelihood of different areas in the study area being affected by a particular hazard, from the perspective of the city as a whole, the same area may be subjected to multiple hazards. For urban decision makers, zoning the city based on the hazard characteristics of different areas can save resources while facilitating efficient governance. To obtain a comprehensive susceptibility map of the study area, based on the susceptibility classification discussed earlier, we compiled data on areas of high and very high susceptibility, overlaying the susceptibility scenarios of different hazards. According to the analysis, 73.71% of the study area does not fall within the high susceptibility zones for urban geological hazards, with only a low proportion of small-scale hazards such as collapses. The detailed comprehensive susceptibility zoning map and the proportion of different conditions are presented in Fig. 9.
4.3 Model Interpretability
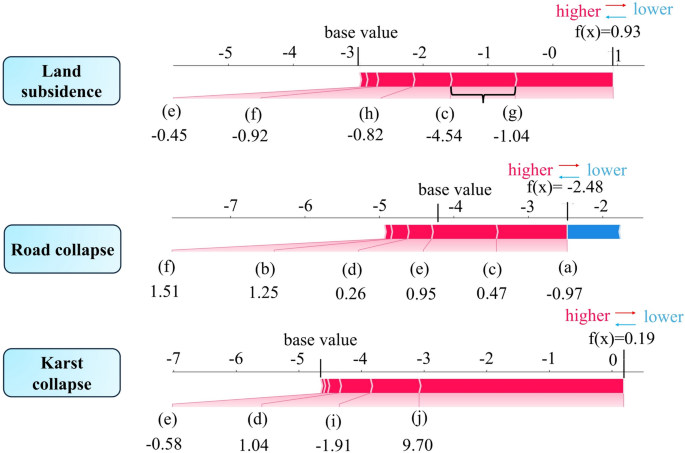
The SHAP plots, as a way to showcase SHAP’s interpretability, come in three varieties—force, summary, and decision plots—each offering a unique way to visualize and understand the data and the model’s behavior without delving into their specific functions (Yang et al. 2022). The force plot (Fig. 10), presented from the micro perspective of a specific sample point, visualizes how different features impact the model’s prediction of land subsidence, road collapse, and karst collapse. The length and direction of each arrow represent the strength and direction of each feature’s effect. A feature with a red arrow contributes to an increase in the prediction value, while a blue arrow denotes a feature that decreases the prediction value. For example, in the case of land subsidence, the contribution of “Rainfall” (c) corresponds to the portion indicated by the black curly brace in Fig. 10. When the contribution of a feature is negligible, the program may not label its contribution on the graph. For instance, this is the case for “Groundwater richness” (d) in land subsidence, as well as “Rainfall” (c) and “Burial depth of the underground confined water level” (f) in karst collapse. Each plot starts with a base value (the average prediction over the dataset), and the combined effect of all the features leads to the final prediction (f(x)) at the end of the plot. Each sample point has a different f(x). To interpret the plot, one observes the balance of red and blue arrows, their lengths, and the final prediction point relative to the base value, which together convey the cumulative effect of all features for the specific prediction. Also, the numbers indicated below the factors in the figure represent the transformed or standardized values of the sample data used in the model’s prediction process and do not have a specific inherent meaning.
SHapley Additive exPlanations (SHAP) force plot of the test dataset. a Burial depth of the top layer of saturated silty sand soil; b thickness of the surface fill layer; c rainfall; d groundwater richness; e major linear project density; f burial depth of the underground confined water level; g subsidence rate; h soft soil layer thickness; i limestone distribution; j Karst distribution
Figure 10 shows that in the land subsidence analysis of this sample, each relevant factor contributed positively to the model’s prediction, especially “Subsidence rate” (g). In the road collapse analysis, all relevant factors, except for “Burial depth of the top layer of saturated silty sand soil” (a), contributed positively. Finally, in the karst collapse analysis, all relevant factors, particularly “Karst distribution” (j), made significant contributions to the model’s prediction.
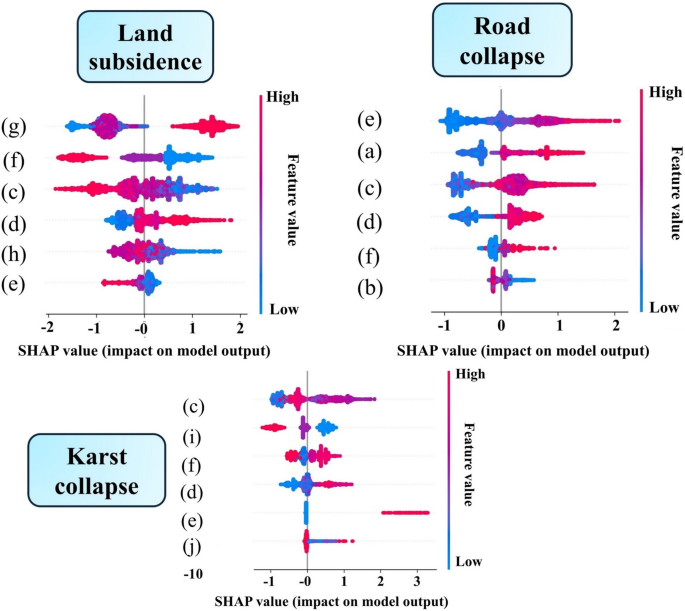
Unlike the force plot that analyzes the individual prediction of a specific sample, the summary plot in Fig. 11 displays the distribution and average impact of each feature across all observations. On the vertical axis, the order of the factors from top to bottom represents a decreasing importance of factors in the model’s prediction. The horizontal axis shows the SHAP values for each sample point, with each point representing a sample. Wider sections along the horizontal axis indicate a higher concentration of samples. In terms of the color of the points, the redder the color, the higher the feature value; the bluer the color, the lower the feature value. For example, in the land subsidence analysis, overall, “Subsidence rate” (g) contributes the most to the model’s prediction, while “Major linear project density” (e) contributes the least. In the road collapse analysis, there is a large concentration of low feature values (near −1) for “Major linear project density” (e), and the maximum feature value for this factor is around 2, which indicates relatively high feature values.
SHapley Additive exPlanations (SHAP) summary plot of the test dataset. a Burial depth of the top layer of saturated silty sand soil; b thickness of the surface fill layer; c rainfall; d groundwater richness; e major linear project density; f burial depth of the underground confined water level; g subsidence rate; h soft soil layer thickness; i limestone distribution; j Karst distribution
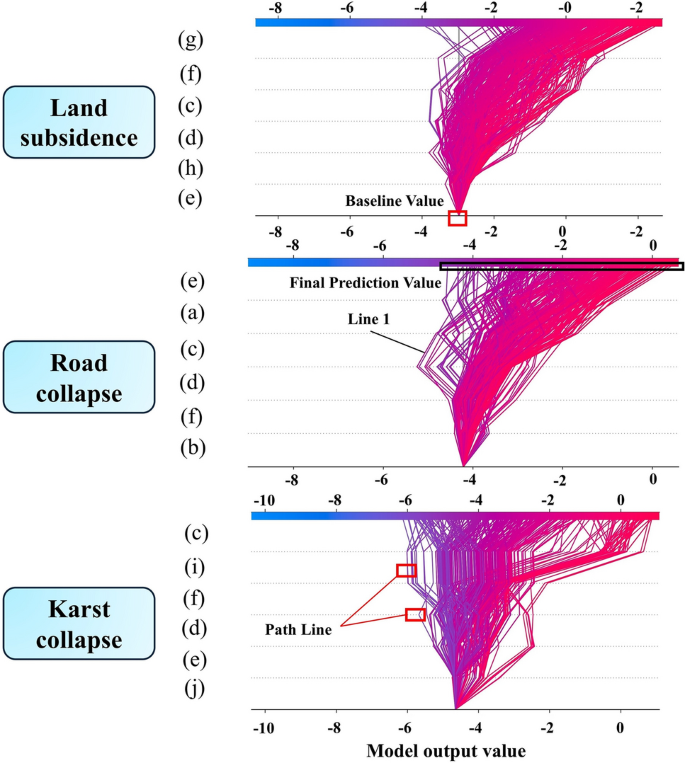
The decision plot in Fig. 12 captures the influence of discriminative features on the model’s predictions across 500 individual samples for land subsidence, road collapse, and karst collapse scenarios. Each line traces a journey from a baseline value, without any feature impact, to one where all six relevant features have shaped the outcome, that is, the final prediction value (the features selected for each type of hazard are shown in Table 1). The vertical axis ranks the factors from top to bottom based on their overall contribution to the model’s prediction, consistent with the vertical axis of the summary plot. The color of each line corresponds to the magnitude of the final prediction value—the redder the line, the higher the value; the bluer the line, the lower the value. For example, in Line 1 of the road collapse scenario, the line is purple, corresponding to a final prediction value of approximately − 4, with significant fluctuations due to the influence of “Rainfall” on this sample. These plots illustrate the cumulative contribution of factors to the model’s output, with the final position of each line on the right signifying the integrated effect of the factors.
SHapley Additive exPlanations (SHAP) decision plot of the test dataset. a Burial depth of the top layer of saturated silty sand soil; b thickness of the surface fill layer; c rainfall; d groundwater richness; e major linear project density; f burial depth of the underground confined water level; g subsidence rate; h soft soil layer thickness; i limestone distribution; j Karst distributionn.
Baseline Value: The starting point of every path line in the graph, which represents the model’s expected output without any input features; Path Line: Each line represents the prediction process for a data point, starting from the baseline value and ending at the actual output value of the model; Final Prediction Value: The endpoint of each line, indicating the model’s final predicted output after considering all features.
4.4 Socioeconomic Comprehensive Mapping
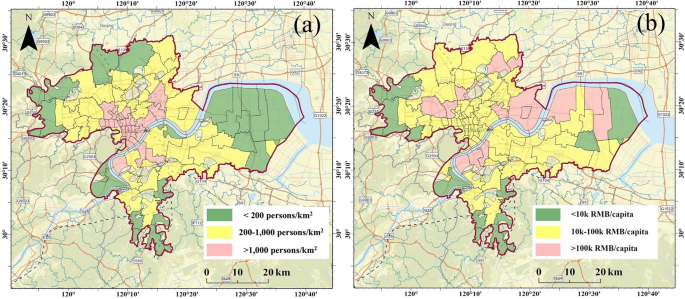
Figure 13 shows Hangzhou’s per capita GDP in 2023 and population density. Integrating urban development levels into multi-hazard management can yield superior outcomes. This method ensures that resources are allocated efficiently, focusing on areas where the impact of disasters on human lives and economic assets is likely to be greatest. Such an approach aligns more closely with the principles of sustainable development, which call for the harmonious progression of socioeconomic factors, population, and the environment.
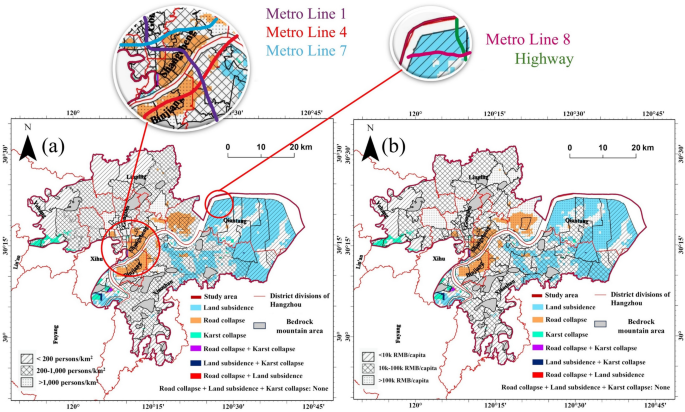
In our research, we overlaid the comprehensive assessment results of urban geological hazards with per capita GDP and population density, given that GDP and population density may not always be directly proportional (Hou et al. 2016; Pradhan et al. 2023). According to our mapping outcomes, Binjiang and Shangcheng Districts not only exhibit high population density and per capita GDP but also show a high susceptibility to urban road collapse, necessitating a prioritized allocation of resources towards monitoring and mitigation efforts in these areas. Meanwhile, along the banks of the Qiantang River in Qiantang District, despite the lower population density, the area’s highly developed economy calls for significant attention to land subsidence prevention and control. Further specifics are presented in Fig. 14.
Susceptibility map of multiple hazards combined with population density and GDP data in Hangzhou City in 2023. a Multiple hazards and population density (persons/km2); b Multiple hazards and GDP (RMB yuan per capita). Hazard and population/GDP details, and metro lines and railway are also shown in the enlarged maps of Binjiang and Shangcheng Districts and Qiantang District.
5 Discussion
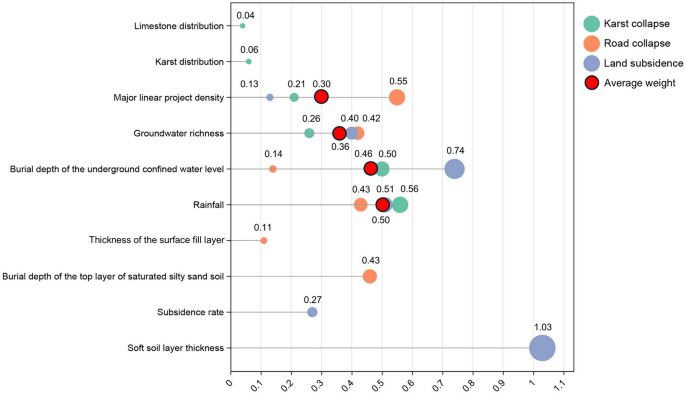
In this study, we proposed a CatBoost-SHAP model tailored for the Hangzhou Plain area, which is characterized by complex geological conditions, significant human activity impact, and dispersed hazard zones. During the prediction phase, the CatBoost algorithm demonstrated exceptional performance with AUC values of 0.92, 0.92, and 0.94 for three distinct types of hazards, approaching the perfect accuracy mark of 1. However, despite the high AUC scores, the underlying principles of the model’s judgments remained obscure, making it challenging for urban decision makers to effectively manage and mitigate risks based on the analysis. To address this, our research integrated the well-developed SHAP interpretability model. Through the examination of various SHAP visualizations and the factor weight distribution graph in Fig. 15, we identified that hydrological factors such as “Rainfall” and “Burial depth of the underground confined water level” universally and significantly influence the occurrence of urban geological hazards. The model’s predictive analysis also exhibited variability, likely due to dispersed data distribution, necessitating further in-depth discussion in future research. Notably, “Thickness of the soft soil layer,” a unique factor in road collapse scenarios, held a substantial weight in the analysis, aligning with the primary cause of road subsidence in Hangzhou being the inadequate bearing capacity of the surface fill soil. This correlation further validates the accuracy of our study and analysis. The proposed CatBoost-SHAP model excels in prediction and offers reasonable explanations for its outputs, demonstrating its application potential. As research progresses, our team will continue to advocate for its broader application.
Our research also provides new directions for disaster prevention in Hangzhou City. Specifically, for areas like Binjiang and Qiantang Districts, where urban road collapse is prevalent, further monitoring of underground voids is recommended. For the significantly impactful factor of “Soft soil layer thickness,” further borehole data collection in road collapse-prone areas is advised to gain clearer insights into the stratigraphic conditions. Regarding hydrological conditions and other factors examined in the study, the construction of a groundwater monitoring network and further expansion of the land subsidence monitoring network are necessary to provide technical support for the smart city construction of Hangzhou City. To address the issue of karst collapse, it is crucial to enhance the identification of hidden adverse geological conditions such as concealed karst and ancient river channels, especially around the West Lake area, by intensifying geophysical exploration efforts.
This research, based on geological data and simulations, aimed to guide further geological investigations with its accurate results. It reaffirmed the directive role of integrating geological science with computer technology in actual sustainable urban construction, offering valuable experience for cities worldwide facing similar challenges with multiple urban geological hazards. This translation emphasizes the practical application of interdisciplinary approaches in enhancing urban sustainability, reflecting the significance of tailored geological and technological interventions in mitigating the risks associated with urban development.
6 Conclusion
To align urban construction for sustainable development with the safety of people’s lives and property in Hangzhou City, this study introduced a CatBoost-SHAP model for multi-geological hazards assessment in the plain area of the city. This marks the first application of the well-known CatBoost model in the field of dispersed geological hazards in urban areas, where it has demonstrated exceptional performance with AUC values of 0.92, 0.92, and 0.94 for three types of hazards. Upon validating the accuracy of the results, a susceptibility map for each hazard was created, along with a multi-hazard susceptibility map for the study area. The comparison of hazard point distribution and the mapping results also confirmed the effectiveness of our approach.
The primary aim of this research was to apply our findings to support sustainable development initiatives in Hangzhou City. To assist decision makers in urban planning and to increase the credibility of the research, we innovatively incorporated the SHAP interpretability model. By opening the “black box” of the CatBoost, the impact and contribution of each factor to the modeling results were clearly determined. This undoubtedly boosts the confidence of urban policymakers in applying machine learning.
By overlaying the susceptibility of multi-hazards with the urban economic and population situation, decision makers can allocate resources and manage different regions more effectively in line with urban development. We believe that this approach has significant implications for balancing economic development, social inclusivity, and environmental protection in the process of sustainable urban development.
Notes
Project No. DD20190281.
References
Alikaei, S., M. Rahmani, F. Jamalabadi, M.E. Akdogan, and S. Khoshnevis. 2023. Multi-hazard-based land use planning in isolated area; Learning from the experience of Pule-Khumri City, Afghanistan. Sustainable Cities and Society 99: Article 104873.
Al-Qubatee, W., F.A. Hasan, H. Ritzema, G. Nasher, and P. Hellegers. 2022. Natural and human-induced drivers of groundwater depletion in Wadi Zabid, Tihama coastal plain, Yemen. Journal of Environmental Planning and Management 65(14): 2609–2630.
Bagheri-Gavkosh, M., S.M. Hosseini, B. Ataie-Ashtiani, Y. Sohani, H. Ebrahimian, F. Morovat, and S. Ashrafi. 2021. Land subsidence: A global challenge. Science of the Total Environment 778: Article 146193.
Bishop, C.M. 2006. Pattern recognition and machine learning. New York: Springer.
Brownlee, J. 2020. Data preparation for machine learning: Data cleaning, feature selection, and data transforms in Python. https://github.com/aaaastark/Data-Scientist-Books/blob/main/Data%20Preparation%20for%20Machine%20Learning%20Data%20Cleaning%2C%20Feature%20Selection%2C%20and%20Data%20Transforms%20in%20Python%20by%20Jason%20Brownlee%20(z-lib.org).pdf. Accessed 15 Jun 2024.
Castelvecchi, D. 2016. Can we open the black box of AI?. Nature 538(7623): 21–23.
Chen, F., H. Lin, Y. Zhang, and Z. Lu. 2012. Ground subsidence geo-hazards induced by rapid urbanization: Implications from InSAR observation and geological analysis. Natural Hazards and Earth System Sciences 12(4): 935–942.
Chen, Y., J. Song, S. Zhong, Z. Liu, and W. Gao. 2022. Effect of destructive earthquake on the population-economy-space urbanization at county level – A case study on Dujiangyan County, China. Sustainable Cities and Society 76: Article 103345.
Costa, V.G., and C.E. Pedreira. 2023. Recent advances in decision trees: An updated survey. Artificial Intelligence Review 56(5): 4765–4800.
Cui, Z.-D., J.-Q. Yang, and L. Yuan. 2015. Land subsidence caused by the interaction of high-rise buildings in soft soil areas. Natural Hazards 79(2): 1199–1217.
De Waele, J., F. Gutiérrez, M. Parise, and L. Plan. 2011. Geomorphology and natural hazards in karst areas: A review. Geomorphology 134(1–2): 1–8.
Etinay, N., C. Egbu, and V. Murray. 2018. Building urban resilience for disaster risk management and disaster risk reduction. Procedia Engineering 212(6): 575–582.
Ganesh, B., S. Vincent, S. Pathan, and S.R. Garcia Benitez. 2023. Machine learning based landslide susceptibility mapping models and GB-SAR based landslide deformation monitoring systems: Growth and evolution. Remote Sensing Applications: Society and Environment 29(19): Article 100905.
Godschalk, D.R. 2003. Urban hazard mitigation: Creating resilient cities. Natural Hazards Review 4(3): 136–143.
Gray, M.A. 1990. The United Nations Environment Programme: An assessment. Environmental Law 20(2): Article 291.
Gu, H., S. Du, B. Liao, J. Wen, C. Wang, R. Chen, and B. Chen. 2018. A hierarchical pattern of urban social vulnerability in Shanghai, China and its implications for risk management. Sustainable Cities and Society 41: 170–179.
Gutiérrez, F., M. Parise, J. De Waele, and H. Jourde. 2014. A review on natural and human-induced geohazards and impacts in karst. Earth-Science Reviews 138: 61–88.
Haghiri, M., N. Raeisi, R. Azizi, K. Shabani, and M. Ghadiri. 2024. Evaluation of karst aquifer development and karst water resource potential using fuzzy logic model (FAHP) and analysis hierarchy process (AHP): A case study, North of Iran. Carbonates and Evaporites 39(2). https://doi.org/10.1007/s13146-024-00925-w.
Hancock, J.T., and T.M. Khoshgoftaar. 2020. CatBoost for big data: An interdisciplinary review. Journal of Big Data 7(1): Article 94.
Hou, J., J. Lv, X. Chen, and S. Yu. 2016. China’s regional social vulnerability to geological disasters: Evaluation and spatial characteristics analysis. Natural Hazards 84(1): 97–111.
Hu, R.L., Z.Q. Yue, L.C. Wang, and S.J. Wang. 2004. Review on current status and challenging issues of land subsidence in China. Engineering Geology 76(1–2): 65–77.
Ibrahim, A.A., R.L. Ridwan, M.M. Muhammed, R.O. Abdulaziz, and G.A. Saheed. 2020. Comparison of the CatBoost classifier with other machine learning methods. International Journal of Advanced Computer Science and Applications 11(11): 738–748.
Ishizaka, A., and A. Labib. 2009. Analytic hierarchy process and expert choice: Benefits and limitations. OR Insight 22(4): 201–220.
Jordan, M.I., and T.M. Mitchell. 2015. Machine learning: Trends, perspectives, and prospects. Science 349(6245): 255–260.
Kotsiantis, S.B. 2013. Decision trees: A recent overview. Artificial Intelligence Review 39(4): 261–283.
Li, Y., F.B. Osei, T. Hu, and A. Stein. 2023. Urban flood susceptibility mapping based on social media data in Chengdu City, China. Sustainable Cities and Society 88: Article 104307.
Liu, H., G. Zhou, R. Wennersten, and B. Frostell. 2014. Analysis of sustainable urban development approaches in China. Habitat International 41: 24–32.
Liu, S., L. Wang, W. Zhang, Y. He, and S. Pijush. 2023. A comprehensive review of machine learning-based methods in landslide susceptibility mapping. Geological Journal 58(6): 2283–2301.
Lu, H., X. Lu, L. Jiao, and Y. Zhang. 2022. Evaluating urban agglomeration resilience to disaster in the Yangtze Delta city group in China. Sustainable Cities and Society 76: Article 103464.
Lyu, H.-M., and Z.-Y. Yin. 2023. An improved MCDM combined with GIS for risk assessment of multi-hazards in Hong Kong. Sustainable Cities and Society 91: Article 104427.
Machowski, R., M.A. Rzetala, M. Rzetala, and M. Solarski. 2016. Geomorphological and hydrological effects of subsidence and land use change in industrial and urban areas. Land Degradation & Development 27(7): 1740–1752.
Marcílio, W.E., and D.M. Eler. 2020. From explanations to feature selection: Assessing SHAP values as feature selection mechanism. In Proceedings of the 2020 33rd SIBGRAPI Conference on Graphics, Patterns and Images (SIBGRAPI), 7–10 November 2020, Porto de Galinhas, Brazil, 340–347.
Medar, R., V.S. Rajpurohit, and B. Rashmi. 2017. Impact of training and testing data splits on accuracy of time series forecasting in machine learning. In Proceedings of the 2017 International Conference on Computing, Communication, Control and Automation (ICCUBEA), 17–18 August 2017, Pune, India, 1–6.
Miller, D.J., and J. Sias. 1998. Deciphering large landslides: Linking hydrological, groundwater and slope stability models through GIS. Hydrological Processes 12(6): 923–941.
Munier, N., E. Hontoria, N. Munier, and E. Hontoria. 2021. Shortcomings of the AHP method. In Uses and limitations of the AHP method: A non-mathematical and rational analysis, ed. N. Munier, and E. Hontoria, 41–90. Cham: Springer.
Papadopoulou-Vrynioti, K., G.D. Bathrellos, H.D. Skilodimou, G. Kaviris, and K. Makropoulos. 2013. Karst collapse susceptibility mapping considering peak ground acceleration in a rapidly growing urban area. Engineering Geology 158: 77–88.
Pham, B.T., T. Nguyen-Thoi, C. Qi, T. Van Phong, J. Dou, L.S. Ho, H. Van Le, and I. Prakash. 2020. Coupling RBF neural network with ensemble learning techniques for landslide susceptibility mapping. Catena 195: Article 104805.
Pourghasemi, H.R., A. Gayen, M. Edalat, M. Zarafshar, and J.P. Tiefenbacher. 2020. Is multi-hazard mapping effective in assessing natural hazards and integrated watershed management?. Geoscience Frontiers 11(4): 1203–1217.
Pradhan, B., S. Lee, A. Dikshit, and H. Kim. 2023. Spatial flood susceptibility mapping using an explainable artificial intelligence (XAI) model. Geoscience Frontiers 14(6): Article 101625.
Prokhorenkova, L., G. Gusev, A. Vorobev, A.V. Dorogush, and A. Gulin. 2018. CatBoost: Unbiased boosting with categorical features. In Proceedings of the 32nd Conference on Neural Information Processing Systems (NeurIPS 2018), 3–8 December 2018, Montréal, Canada. https://proceedings.neurips.cc/paper_files/paper/2018/file/14491b756b3a51daac41c24863285549-Paper.pdf. Accessed 13 Jul 2023.
Redclift, M. 1989. The environmental consequences of Latin America’s agricultural development: Some thoughts on the Brundtland Commission report. World Development 17(3): 365–377.
Rudin, C. 2019. Stop explaining black box machine learning models for high stakes decisions and use interpretable models instead. Nature Machine Intelligence 1(5): 206–215.
Sharifani, K., and M. Amini. 2023. Machine learning and deep learning: A review of methods and applications. World Information Technology and Engineering Journal 10(7): 3897–3904.
Shi, P., X. Yang, W. Xu, and J. Wang. 2016. Mapping global mortality and affected population risks for multiple natural hazards. International Journal of Disaster Risk Science 7(1): 54–62.
Shi, P., T. Ye, Y. Wang, T. Zhou, W. Xu, J. Du, J. Wang, and N. Li et al. 2020. Disaster risk science: A geographical perspective and a research framework. International Journal of Disaster Risk Science 11(4): 426–440.
Shirzaei, M., J. Freymueller, T.E. Törnqvist, D.L. Galloway, T. Dura, and P.S.J. Minderhoud. 2021. Measuring, modelling and projecting coastal land subsidence. Nature Reviews Earth & Environment 2(1): 40–58.
Storkey, A. 2009. When training and test sets are different: Characterizing learning transfer. In Dataset shift in machine learning, ed. J. Quiñonero-Candela, M. Sugiyama, A. Schwaighofer, and N.D. Lawrence. Cambridge, MA: The MIT Press.
Sun, D. 2024. Land subsidence susceptibility mapping in urban settlements using time-series PS-InSAR and random forest model. Gondwana Research 125: 406–424.
Tehrany, M.S., B. Pradhan, and M.N. Jebur. 2014. Flood susceptibility mapping using a novel ensemble weights-of-evidence and support vector machine models in GIS. Journal of Hydrology 512: 332–343.
Van den Broeck, G., A. Lykov, M. Schleich, and D. Suciu. 2022. On the tractability of SHAP explanations. Journal of Artificial Intelligence Research 74: 851–886.
Wang, Y., S. Li, X. Liu, J. Zhang, and W. Cheng. 2020. Comparative study of landslide susceptibility mapping with different recurrent neural networks. Computers & Geosciences 138: Article 104445.
Wang, K., J. Zhang, G. Gao, J. Qiu, Y. Zhong, C. Guo, W. Zhao, K. Tang, and X. Su. 2022. Causes, risk analysis, and countermeasures of urban road collapse in China from 2019 to 2020. Journal of Performance of Constructed Facilities 36(6): Article 04022054.
Wang, Y., Y. Qiao, W. Deng, F. Wang, W. Bai, J. Jiang, J. Liu, S. Xu, et al. 2023. Construction of an urban road collapse risk assessment model and its case study in Guangzhou. In Computational and experimental simulations in engineering: Proceedings of the International Conference on Computational & Experimental Engineering and Sciences 2023, ed. S. Li, 269–290. Cham: Springer.
Wang, J., and D. He. 2015. Sustainable urban development in China: Challenges and achievements. Mitigation and Adaptation Strategies for Global Change 20(5): 665–682.
Wang, X.-W., and Y.-S. Xu. 2022. Investigation on the phenomena and influence factors of urban ground collapse in China. Natural Hazards 113(1): 1–33.
Wei, A., D. Li, Y. Zhou, Q. Deng, and L. Yan. 2021. A novel combination approach for karst collapse susceptibility assessment using the analytic hierarchy process, catastrophe, and entropy model. Natural Hazards 105(1): 405–430.
Wu, Y., X. Jiang, Z. Guan, W. Luo, and Y. Wang. 2018. AHP-based evaluation of the karst collapse susceptibility in Tailai Basin, Shandong Province, China. Environmental Earth Sciences 77: 1–14.
Yan, G., D. Lu, S. Li, S. Liang, L. Xiong, and G. Tang. 2024. Optimizing slope unit-based landslide susceptibility mapping using the priority-flood flow direction algorithm. Catena 235: Article 107657.
Yang, Y., Y. Yuan, Z. Han, and G. Liu. 2022. Interpretability analysis for thermal sensation machine learning models: An exploration based on the SHAP approach. Indoor Air 32(2): Article e12984.
Yu, L., Y. Wang, and B. Pradhan. 2024. Enhancing landslide susceptibility mapping incorporating landslide typology via stacking ensemble machine learning in Three Gorges Reservoir, China. Geoscience Frontiers 15(4): Article 101802.
Zhang, Z., and Y. Li. 2020. Coupling coordination and spatiotemporal dynamic evolution between urbanization and geological hazards - A case study from China. Science of the Total Environment 728: Article 138825.
Zhang, H., and Z. Wang. 2022. Human activities and natural geographical environment and their interactive effects on sudden geologic hazard: A perspective of macro-scale and spatial statistical analysis. Applied Geography 143: Article 102711.
Zhou, Y., T. Wu, and Y. Wang. 2022. Urban expansion simulation and development-oriented zoning of rapidly urbanising areas: A case study of Hangzhou. Science of the Total Environment 807: Article 150813.
Zhou, N.-Q., and S. Zhao. 2013. Urbanization process and induced environmental geological hazards in China. Natural Hazards 67: 797–810.
Acknowledgments
This research is supported by the China Geological Survey, Nanjing Center, Zhejiang Geological Survey, and China University of Geosciences (Wuhan). The work described in this article was funded by the Laboratory of Geological Safety of Underground Space in Coastal Cities, Ministry of Natural Resources (Project No. BHKF2022Z02), and the China Geological Survey, Nanjing Center (Project No. DD20190281).
Author information
Authors and Affiliations
Corresponding author
Rights and permissions
Open Access This article is licensed under a Creative Commons Attribution 4.0 International License, which permits use, sharing, adaptation, distribution and reproduction in any medium or format, as long as you give appropriate credit to the original author(s) and the source, provide a link to the Creative Commons licence, and indicate if changes were made. The images or other third party material in this article are included in the article's Creative Commons licence, unless indicated otherwise in a credit line to the material. If material is not included in the article's Creative Commons licence and your intended use is not permitted by statutory regulation or exceeds the permitted use, you will need to obtain permission directly from the copyright holder. To view a copy of this licence, visit http://creativecommons.org/licenses/by/4.0/.
About this article
Cite this article
Yu, B., Yan, J., Li, Y. et al. Risk Assessment of Multi-Hazards in Hangzhou: A Socioeconomic and Risk Mapping Approach Using the CatBoost-SHAP Model. Int J Disaster Risk Sci (2024). https://doi.org/10.1007/s13753-024-00578-2
Accepted:
Published:
DOI: https://doi.org/10.1007/s13753-024-00578-2


