
Abstract
The disproportionate risks and impacts of climate change and extreme weather on older adults are increasingly evident. While especially true in disaster-prone areas, human-caused climate change introduces an element of uncertainty even in previously identified “safe” regions such as the Midwestern United States. Using a cumulative disadvantage and vulnerability-informed framework and descriptive statistics from multiple data sources, this article provides an overview of climate impacts, vulnerabilities, and county-level characteristics, focusing on older adults living in Central Ohio. A comparative multiple-case study methodology was used to triangulate regionally representative primary and secondary data sources to examine state and county-level measures of vulnerability, emergency preparedness, and disruptions caused by extreme weather among older adults across eight counties in Central Ohio. Seventy-eight percent of older adults in the sample reported being prepared for emergencies per Federal Emergency Management Agency guidelines. Older adults in Union County reported the highest rates of preparedness, while those in Fayette County reported the lowest. County-level rates of disruption of life activities by extreme weather ranged widely. Among the most rural in the region, Fayette County emerged as uniquely disadvantaged, with the lowest median income, the most vulnerable across multiple social vulnerability dimensions, and the most reported disruptions to life activities from extreme weather. County profiles offer a snapshot of existing vulnerabilities, socioeconomic conditions, special needs, preparedness, and current disruptions among older adults in the region and can inform resource mobilization across community and policy contexts.
1 Introduction
Studies have documented the disproportionate effects of climate change, including increasingly frequent extreme weather events and disasters, on older adults (Merdjanof 2021; Bryant et al. 2022). Besides the risk of loss of life and functioning, older adults experiencing extreme weather risk losing access to essential medication, housing, food, or transportation. Older adults are at greater risk of harm during disasters and extreme weather events, making emergency preparedness for this population a top priority (Al-Rousan et al. 2014; EPA 2016a). While this is especially true in disaster-prone regions, human-caused climate change has introduced an element of uncertainty even in regions previously considered “safe,” such as the Midwestern United States, which also are experiencing extreme and unprecedented weather events (Seneviratne et al. 2021).
1.1 Disaster Preparedness Among Older Adults
Scholars underscore the importance of emergency and disaster preparedness to minimize adverse impacts of climate disasters and extreme weather events (Killian et al. 2017; Rao et al. 2023), and this is particularly true for older adults (Al-Rousan et al. 2014; Kim and Zakour 2017; Bell et al. 2021). Based on prior scholarship, key predictors of lower preparedness among older adults in the United States include living alone, earning less than USD 30,000 a year, having a high school degree or less formal education, and identifying as Black or Hispanic (Bell et al. 2021). Another study, among respondents with an average age of 72 and across sociodemographic and regional contexts, found that a majority were underprepared for emergencies (Killian et al. 2017).
Examining disaster preparedness, response, and advocacy among organizations supporting older adults in the rural Midwest, Ashida et al. (2018) found that although the organizations reported high collaboration in disaster response and management, there were relatively fewer tools and lower collaboration on emergency preparedness. This confirms the continued emphasis on response instead of preparedness, highlighting the need for adequate support for older adults before, during, and after emergencies and greater effort in preparing for the future as climate change accelerates. At the same time, it is also important to characterize the contextual determinants and to track the prevalent disruptions in the lives of older adults in key regions of the country.
1.2 Climate Change, Extreme Weather, and Population Aging in Ohio
The US National Climate Assessment provides an outlook for the future of the United States, examining the effects of climate change on the country (US Global Change Research Program 2018). These effects are felt along the rural-urban continuum and ripple across regions. For instance, food and water security in the United States have been compromised by rising temperatures in the Midwest that decrease crop yields and increase harmful algal blooms (NOAA 2022). Ohio is among the Midwestern states slated to be most impacted by the climate crisis (Angel et al. 2018; NOAA 2022). Ohio is part of Federal Emergency Management Agency (FEMA) Region 5, spanning five Midwestern states. Climate projections suggest that Ohio will experience intensifying weather patterns with a higher risk of droughts, heavy precipitation events, extreme heat, and air pollution (EPA 2016c; NOAA 2022). Ohio does not have a statewide climate adaptation plan; however, local entities have advanced strategies to help communities plan for climate change (see Georgetown Law 2023).
Annual average temperatures in Ohio have risen more than 1.5 degrees Fahrenheit since the beginning of the twentieth century (NOAA 2022), compared to an average 0.23 degrees Fahrenheit in North America (EPA 2016b). Given its midlatitude location, Ohio sees impacts of both Arctic air and warm, humid air masses from the Gulf of Mexico (NOAA 2022). Annual precipitation is expected to increase, per future projections, and heavy precipitation events are already more frequent in the region (EPA 2016c; Angel et al. 2018; NOAA 2022).
In 2022, about 18% of Ohioans were over 65 years of age (US Census Bureau 2022), and in line with global trends, this number is growing. By 2030, adults older than 60 are predicted to make up more than a quarter of Ohio’s population. Ohio’s adults 65 and older are some of the most socially isolated in the United States, ranking 33 out of 50 states in social connection (Aly et al. 2020). Older adults in Ohio already face multiple risks linked to poorer disaster outcomes, including less than adequate and accessible transportation options (Age-Friendly Innovation Center et al. 2021), which can worsen outcomes for older adults, especially those with fewer resources, in times of disasters (Phillips and Morrow 2007; Henderson et al. 2010). The growing number of immigrants and refugees living in urban areas face language barriers and require additional social support to access services (Dabelko-Schoeny et al. 2021). Significant social, economic, and health disparities by race and citizenship status exist in the state, resulting in a more than 21-year gap in life expectancy, depending on where older Ohioans reside (Aly et al. 2020).
This complex reality necessitates convergent efforts toward transforming communities to be more age friendly. Disaster readiness, on the individual and community levels, has significant potential to improve the lived experiences of older adults in the region. The present study addressed a gap in the literature to characterize emergency preparedness and extreme weather-related disruptions among older adults in one Midwestern US region and ties in secondary data to aid scholars, professionals, and practitioners in social services, public health, and emergency preparedness to assist older adults in this region. Findings from this study may also inform other regions of the United States and areas across the globe that are facing a growing aging population and new extreme weather patterns.
2 Theoretical Framework
We used a cumulative disadvantage and vulnerability-informed framework to identify and situate the key aspects of interlocking disadvantages that complicate or ease extreme weather impacts on older adults. Cumulative disadvantage theory posits that levels of advantage among groups diverge over time because of systemic tendencies that expose the disadvantaged to risk and the advantaged to opportunity (Dannefer 2003). This theory has been used to explain how various social inequities are perpetuated across both lifetimes and generations (Ferraro and Kelley-Moore 2003; Shuey and Willson 2008; Kurlychek and Johnson 2019). Disadvantages accumulate over time, widening the gap between those with advantages and those without. Often used in the social sciences, this theory helps to explain how social inequities are entrenched and perpetuated across generations. It highlights the importance of addressing social inequalities to prevent their aggregate effects over time.
Vulnerability theory emphasizes that vulnerability is shaped by broader social and contextual structures and power relations that require individual-level interventions and larger shifts in social structures and power relations to reduce risks (Adger 2006; Zakour and Gillespie 2013). Social vulnerability is “the susceptibility of social groups to the adverse impacts of natural hazards, including disproportionate death, injury, loss, or disruption of livelihood” (FEMA 2023). Age and associated disability increase the risk of poverty and coincide with a dearth of resources to deal with disaster impacts in addition to everyday stressors. Older adults may lack the financial resources, physical ability, and assets to relocate or to make necessary home improvements to protect themselves from extreme weather events.
3 Research Questions
This study examined state and county data to characterize emergency preparedness, social vulnerability, and extreme weather-related disruptions among older adults in Central Ohio. To this end, we asked three broad questions:
-
(1)
What key county and state socioeconomic characteristics are pertinent to understanding the vulnerability of residents to extreme weather events and disasters?
-
(2)
What percentage of older adults are prepared for extreme weather emergencies in and across eight counties of Central Ohio?
-
(3)
How is extreme weather disrupting the lives of older adults in and across eight counties in Central Ohio?
For the first question, we examined secondary data to identify current and future risks in Ohio. We included data at the individual and county levels to characterize residents’ disaster risk and vulnerability. Questions 2 and 3 were answered using primary and regionally representative data from eight counties in Central Ohio.
4 Methods
We used a multiple-case study approach to facilitate synthesis of an understanding of older residents’ vulnerability to and experiences of extreme weather events among eight counties in Central Ohio (Bartlett and Vavrus 2017; Yin 2018). Case studies are a research strategy to understand a social unit (Yin 1981, 2018; Priya 2021) and can use several kinds of data, both qualitative and quantitative, to examine a phenomenon (Yin 2018). This descriptive multiple-case study utilized a combination of secondary and primary survey data. Case study research grounded in theory but flexible and open to revision informed by empirical data can produce valid and reliable research findings (Rule and John 2015). Therefore, this method was deemed apt for this descriptive study as we examined the contemporary phenomenon of climate and weather-related emergencies pertaining to older adults’ preparedness and the disruptions caused by extreme weather in their lives. We situated this within “the broader range of contextual conditions” that help an empirical inquiry about this phenomenon within the context of Central Ohio (Yin 2011, p. 4). Case studies are particularly relevant when questions necessitate an in-depth description of a less understood social phenomenon (Bartlett and Vavrus 2017; Yin 2018). The triangulation of data allowed us to conduct a cross-case analysis to infer preparedness for and disruptions from extreme weather events in the current and projected climate of Central Ohio. Figure 1 represents the location of the eight counties in the Central Ohio region comprising the multiple cases that we examined.
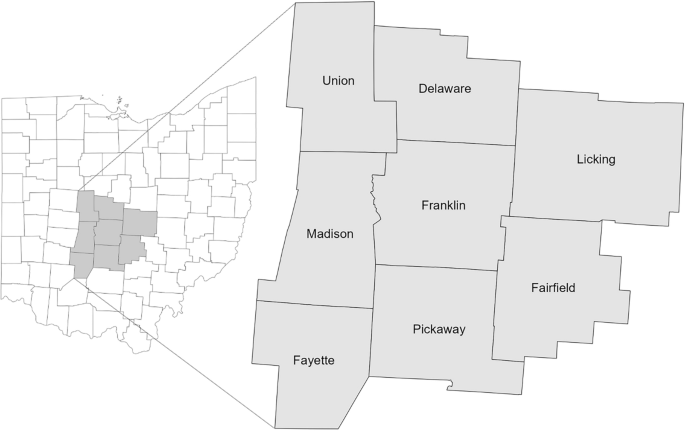
Visual representation of eight Central Ohio counties included in the study. Note: This image is not to scale and is for illustrative purposes. The state capital, Columbus, is located in Franklin County
4.1 Data
Eight Central Ohio counties—Delaware, Fairfield, Fayette, Franklin, Licking, Madison, Pickaway, and Union—were included in the study. These counties represent the multiple cases, and each county is treated as a separate case in this multiple-case study.
4.1.1 Primary Data
Primary data for the study are from the 2021 Central Ohio Regional Assessment on Aging (CORAA) Survey. The assessment was conducted by the Central Ohio Area Agency on Aging, Franklin County Office of Aging, and Age Friendly Innovation Center to understand the social services and built environment in which older residents of Central Ohio live. The eight-county regional assessment used a stratified random sample, ensuring a minimum of 70 surveys per county for statistically valid and regionally representative results. Larger counties, such as Delaware, Franklin, and Licking, completed more than 70 surveys each. The sample was randomly selected in these counties from residential addresses that were likely to have at least one occupant over 50. Data Axel provided the marketing list used as the source for this sample. The administering agency, ETC Institute, aimed for a 15% response rate, selecting roughly seven times the desired number of surveys from each county. The sample was stratified by county and weighted to accurately reflect the region’s population distribution. Analyses for survey data, including weighted means and percentages, were tabulated using Stata MP version 18.
4.1.2 Central Ohio Regional Assessment on Aging (CORAA) Data Management
Sociodemographic characteristics included age, race, county, education, income, primary language, immigrant status, and gender identity. Respondents could choose all that applied in answer to the question “Who lives in your household?” This was recoded to indicate whether the respondent lived alone. Annual household income was measured with eight response options: Under USD 10,000; USD 10,000 to 24,999; USD 25,000 to 39,999; USD 40,000 to 59,999; USD 60,000 to 74,999; USD 75,000 to 99,999; USD 100,000 or more; and Prefer not to answer. Gender identity included four options: man, woman, transperson, and nonbinary. Given their low variability, the final two categories were merged for descriptive statistics. Education was measured with six categories from No formal/high school education to Graduate degree.
Race/ethnicity was a categorical measure, with options including Asian/Pacific Islander, Black/African American, Native American, White/Caucasian, Hispanic/Latino, Prefer not to answer, and Other (write-in) response options. Respondents could choose all that applied. Responses to this item were collapsed for reporting and analysis. Respondents who selected multiple races were coded Multiracial. Those who selected Asian/Pacific Islander or Native American and also chose another race were coded Multiracial. Four respondents who selected both White and Prefer not to answer were coded White.
The Federal Emergency Management Agency (FEMA) recommends that residents have at least a three-day supply of necessities to sustain life during emergencies, including food, water, clothing, flashlights, and medicine. Emergency preparedness was measured based on these recommendations; respondents could choose Yes, No, or Don’t know to each question. Respondents also were asked whether extreme weather events (extreme heat, power outages, or flooding) had prevented them from multiple life activities such as getting to health-related appointments or work, attending community events, reaching a family member, or remaining home; again, response options were Yes, No, or Don’t know. Social engagement was measured using the Lubben Social Network Scale-6, an abbreviated six-item scale designed specifically for older adult populations (Lubben et al. 2006). These were summed for a total score; a higher score indicated a higher social network and engagement. A cutoff point of less than 12 was used to create a binary variable (less than 12 = socially isolated; 12 and more = not socially isolated) (Lubben et al. 2006).
4.1.3 Secondary Data
Primary data were triangulated with secondary sources of county-level characteristics to inform the study context. County-level estimates of the percentage and numbers of adults over 65, of the median income of older adults, of those living with disability, of those living alone, and of those considered housing cost-burdened (paying over 30% of income toward housing) were derived from the 2017–2021 American Community Survey five-year estimates (US Census Bureau 2022). The prevalence of adults over 62 living in three categories of rental housing funded by the US Department of Housing and Urban Development (HUD)—public housing, tenant-based housing, and privately owned project-based housing—was sourced from the Picture of Subsidized Households data set (HUD 2021). Urbanization was defined in accordance with the National Center for Health Statistics Urban-Rural Classification Scheme for Counties, which includes six levels: large central metro, large fringe metro, medium metro, small metro, micropolitan, and noncore (Ingram and Franco 2012). The CDC/ATSDR Social Vulnerability Index (SVI) captures a range of key measures to characterize social vulnerability related to dimensions of socioeconomic status, household characteristics, minority status, housing and transportation, and a combined SVI percentile ranking (ATSDR 2020). Scores closer to 1 indicate higher vulnerability. For this exploratory study, we focused on descriptive analyses and examined patterns across eight counties to present a synopsis of social vulnerability and disaster readiness to inform strategies for Central Ohio.
5 Results/Synthesis
In keeping with guidelines for multiple-case studies, each county was treated as a separate case and used as a comparative across the region. We examined older adult emergency preparedness and disruptions due to extreme weather using individual-level primary data from the CORAA, allowing for a more comprehensive examination of the experiences of older adults in Central Ohio counties. Within each county, we used secondary data to capture demographic information pertaining to older adults.
5.1 Primary Data
We derived weighted descriptive statistics (means and percentages) for our primary sample of older adults from the CORAA. Respondents were on average 70 years old (range 50–95 years). Most older adults surveyed were white (80.13%), reported speaking English as the primary language at home (96.53%), were mostly women (56.37%), were nonimmigrants (93.85%), and had at least some college experience (78.9%). About 12.15% of older adults identified as Black, with Asian, Latine, multiracial, and other ethnoracial identities making up the rest of the sample. About 10% of the older adults reported an annual income of under USD 10,000. Nearly 32% of the older adults across the eight counties reported that they lived alone. Employing the recommended cutoff point for the Lubben Social Network Scale, about 76% of all older adults reported a high social network while about 24% had low social networks and social supports. Detailed descriptive statistics for the primary sample are presented in Table 1.
The CORAA results on extreme weather disruptions among older adults for each county are presented in Table 2. A higher number of respondents faced difficulties reaching community events or places of worship or accessing health appointments. Fewer respondents faced difficulties obtaining medicine or getting to work or volunteering. A higher proportion of older adults in Fayette County (19.18%) were prevented from attending health appointments. In Union, Fairfield, and Madison Counties, the fewest respondents (1.27 to 2.74%) were prevented from attending health appointments due to extreme weather. Less than 2% of respondents from Fairfield, Pickaway, and Union Counties were prevented from getting medicine. However, 15.07% of Fayette County respondents reported being prevented from obtaining medicine due to extreme weather. Delaware (5.66%), Fairfield (6.54%), Franklin (4.59%), Licking (3.92%), Madison (4.11%), and Pickaway (4.23%) Counties had similar percentages of older adults who had trouble getting to work or volunteer events due to extreme weather. In contrast, 16.44% of those in Fayette County and 1.27% of those in Union County experienced disruptions to working or volunteering. A higher percentage of Fayette County respondents (19.18%) were prevented from reaching a community event compared to only 2 to 3% of respondents from Union and Madison counties. Delaware, Fairfield, Franklin, Licking, Madison, Pickaway, and Union Counties experienced similar rates (3.77 to 8.31%) of being unable to reach family during severe weather events. In contrast, 19.18% of Fayette County respondents had difficulties reaching family due to extreme weather. A small percentage of respondents—zero in Union County and 1.87% in Fairfield County—and a similar percentage of older adults (4.72% to 7.84%) in Delaware, Franklin, Licking, Madison, and Pickaway Counties were prevented from remaining in their homes during severe weather events, while 20.55% of Fayette County respondents were unable to remain at home due to extreme weather conditions. Overall, fewer older adults in Union and Fairfield Counties faced weather disruptions, and older adults in Fayette County experienced the most disruptions due to weather.
As seen in Table 3, in the Central Ohio region, around 78% of the respondents were prepared for emergencies, and nearly 13% were not. Emergency preparedness ranged from 68% to 94% when examined by county; respondents from Union County reported the highest preparedness and those from Fayette County reported the lowest. Respondents in Licking, Madison, Delaware, and Pickaway Counties indicated similar levels of emergency preparedness, ranging from 82 to 88%.
5.2 Secondary Data
Table 4 presents county-level social vulnerability indices and key socioeconomic and housing information pertaining to older adults, using secondary data sources. Across the eight counties, older adults comprise approximately 13% of the total population, with county-level percentages ranging from 12 to 18%. Rates of disability among older adults vary by county and correlate with measures of economic well-being. Approximately 23% of older adults in the high-income Delaware County live with a disability compared to 41% in Fayette County, the region’s poorest and most rural county. Franklin County, which includes the city of Columbus, the state capital, is the urban center where nearly 60% of all older adults in the region reside. It is also the county with the highest rates of housing cost burden (with residents spending more than 30% of income on housing) and single-person households among older adults.
The CDC/ATSDR Social Vulnerability Index uses a percentile ranking from zero to 1, with higher rankings indicating higher vulnerability. In our sample, Franklin County had the highest overall social vulnerability (0.89) in the region (see Table 4). Delaware (0.06) and Union (0.02) Counties were the least socially vulnerable per the SVI. Fayette County’s high SVI percentile rank (0.70) reflects the trend of increasing vulnerability when moving outward from the suburban fringe into rural areas. Examining SVI subthemes, Fayette County was the most vulnerable on the socioeconomic status (0.90) and household characteristics (0.85) themes. Franklin County was the most vulnerable on the minority status theme (0.99), followed by Delaware (0.84) and Fairfield (0.82) Counties. On housing and transportation, Franklin County was the most socially vulnerable (0.85) followed by Pickaway County (0.62). All counties in the sample had higher scores on minority status compared to other themes, indicating relatively higher vulnerability on this dimension.
5.3 County Case Profiles
Using these data, we created county case profiles on older adult preparedness and weather-related life disruptions with additional contextual information.
5.3.1 Delaware County
Delaware County is classified as a large fringe metro with roughly 80,000 housing units, and the percentage of HUD-subsidized older residents was 46%. The median income for older adults in the county was around USD 71,000. The county’s population included approximately 14% older adults over 65, about 23% of whom lived with a disability, while another 22% lived alone. The vulnerability indices for Delaware County highlight one principal area of concern: minority status. With respect to severe weather events, the majority of older residents in Delaware County reported no significant disruptions, and most older adults (86.79%) reported being prepared for emergencies.
5.3.2 Fairfield County
Fairfield County is a large fringe metro with about 62,000 housing units, and the percentage of HUD residents over the age of 62 was about 40%. The median income for older adults was USD 50,733. Sixteen percent of the county’s population was over 65. Of all older adults, 35% lived with some form of disability, 17% were housing cost-burdened, and 25% lived alone. While the overall SVI ranking is lower for Fairfield County, dimensions of household characteristics and minority status show aspects of their context that make some residents vulnerable to disasters and other stresses. Most respondents did not report major life disruptions due to extreme weather events. About 75% of the older adults reported being prepared for emergencies.
5.3.3 Fayette County
Smaller and classified as micropolitan, Fayette County had about 12,640 housing units, and 37% of HUD residents were over 62 years old. Eighteen percent of the county’s population was over 65, with a median income under USD 40,000. Forty-one percent of older adults lived with some form of disability, and 3% lived alone. Fayette County scored high on vulnerability in terms of socioeconomic status, household characteristics, and overall SVI. Compared to other counties, more Fayette County older residents reported disruptions in accessing health appointments, getting medicine, reaching their work or place of volunteering, attending a community event or place of worship, or reaching family or friends. One-fifth of older Fayette County residents also reported that extreme weather events had prevented them from staying home. Half of the older residents in Fayette County reported being prepared for emergencies, 12% reported being unprepared, and 11% were unsure.
5.3.4 Franklin County
As the only large central metro in the sample, Franklin County had about 600,000 housing units, with 34% of the HUD residents over 62 years old. With a larger urban population, Franklin County had a higher number of older adults than other counties. Older adults ages 65 or older constituted about 12% of the population, with a median income of USD 51,000. Thirty-one percent of these older adults lived with a disability, and 31% reportedly lived alone. Franklin County had high vulnerability across all SVI dimensions, especially in the minority status and housing and transportation dimensions. Disruptions from extreme weather events in Franklin County were low, except in the case of extreme weather preventing older adults from attending a community event or place of worship; about 10% reportedly could not attend these events. Just under 75% of older adults in the survey reported being prepared for emergencies, while 16% were not prepared.
5.3.5 Licking County
Another large fringe metro, Licking County, had about 72,000 housing units, with nearly 32% of HUD residents over 62 years old. Sixteen percent of the county’s population was older than 65, with the median income for older adults being less than USD 51,000. About 36% of older adults in the county lived with a disability, and about a quarter reported living alone. While Licking County had lower vulnerability across most SVI dimensions, the county was relatively more vulnerable in terms of minority status. County respondents did not report very high rates of disruptions, except for difficulty reaching work or volunteering, attending a community event, or reaching family members or friends during an emergency. Around 8% of the respondents reported that extreme weather prevented them from staying home. Most respondents (82%) were prepared for emergencies, and 10% said they were not prepared.
5.3.6 Madison County
As a large fringe metro area with a smaller population, Madison County had around 16,180 housing units. Roughly half of the HUD residents were ages 62 or older, and about 15% of county residents were over 65. The median income for older adults was more than USD 53,000, and approximately 36% of this group was living with a disability, while roughly a quarter lived alone. While rankings indicated higher vulnerability related to minority status in Madison County, overall SVI indicated lower vulnerability. Disruptions to daily activities among older adults mainly impacted work or volunteer commitments and participation in community events or worship services. These disruptions also affected contact with family or friends and the ability to stay home. However, most of surveyed older adults (82%) reported being prepared for emergencies.
5.3.7 Pickaway County
Pickaway County, a fringe metro area, had more than 22,000 housing units, with 42% of HUD residents being older than 62. The county’s median income for older adults was USD 44,253, and around 15% of its population was over 65. Thirty-eight percent of these older adults had a disability, and one-fourth lived alone. The SVI showed higher vulnerability in housing and transportation; however, respondents reported fewer disruptions across all dimensions. Almost nine out of 10 respondents were adequately prepared for emergencies.
5.3.8 Union County
Union County, a large fringe metro, had approximately 22,663 housing units, with about 60% of the HUD residents over age 62, the highest across all eight counties. The population included nearly 12% of people ages 65 or older, with a median income slightly above USD 60,000. Around one-third of older adults lived with some form of disability, while roughly one-fifth reported living alone. Although Union County was less vulnerable in most respects compared to other counties, it showed higher vulnerability regarding minority status per the SVI. Union County also saw fewer disruptions than other counties among its older adults. Notably, 94% of older adults reported being prepared for emergencies according to FEMA guidance—the highest among all surveyed counties.
5.3.9 Central Ohio
In summary, across counties in the sample, older adults were overrepresented among HUD-subsidized residents compared to their population share. In Fayette County, nearly 17% of older adults were not prepared for emergencies and reported relatively higher levels of disruption from extreme weather events. Fayette and Franklin Counties exhibited the highest social vulnerability in Central Ohio, while Union and Delaware Counties had the lowest—a pattern that also aligned with median income differences among older adults.
6 Limitations and Strengths
While not exhaustive, the secondary data used in these analyses provide valuable insight into vulnerability factors at various social-ecological levels. Future studies could benefit from integrating contextual policy information into regional surveys for inferential analysis. The primary survey data are cross-sectional, with only one wave of the data; subsequent waves would enable comparisons and more advanced analyses. The theoretical framework and reviewed literature helped to identify variables, such as historical data on disadvantage and inequality in the area, that can inform analyses of current and future impacts. Older adults face a range of physical, social, economic, and political risks, which can be compounded by various factors such as poverty, discrimination, and social exclusion. Although the survey covered eight representative counties, these counties do not reflect all of Ohio. Much state-level climate and disaster information was generalized across the state and cannot be solely attributed to Central Ohio. Some strengths of the study include primary regionally representative data focused on older adults, a group recognized as vulnerable in many climate, disaster, and health studies. This was bolstered by county-level secondary data from multiple sources to highlight older adults’ unique experiences and has relevance for regional planning and interventions centered on their realities.
7 Discussion
We sought to answer questions about disaster preparedness and weather-related disruptions among older residents in Ohio. Using eight counties in Central Ohio as multiple cases helped us to explore and compare patterns or trends that can present the groundwork for further analysis locally and in other areas facing new extreme weather patterns and growing numbers of older residents. Per the multiple-case study methodology (Yin 2018), we examined each county on its own as well as in comparison with other counties. There are several takeaways of significance.
First, given scholarship on the importance of socioeconomic status and housing conditions to disaster preparedness, we noted key socioeconomic features at the county level to characterize Central Ohio’s older residents’ abilities to withstand extreme weather events. Many HUD-subsidized residents in the region are older adults. Subsidized housing, especially for older adults, is a vital resource, with demand typically surpassing supply (Gonyea et al. 2018). However, studies indicate that such housing is more likely to be in disaster-prone areas and to have a higher representation of underserved demographic groups, who also often report higher rates of loneliness (Gonyea et al. 2018; Public and Affordable Housing Research Corporation and National Low Income Housing Coalition 2021). Subsidized renters live in worse housing conditions and are significantly less prepared for disasters compared to nonsubsidized renters and homeowners (McCarthy and Friedman 2023).
While homeownership among older adults stood at 77.9% in 2020 (Urban Institute 2020), given the data on racial disparities in housing, this figure is likely skewed by race, further entrenching vulnerabilities. This is especially relevant as county SVI assessments included in our analysis show higher percentile rankings for racial and ethnic minority status. It should be noted that the SVI dimension on minority status explicitly assumes both historical and contemporary socioeconomic and policy discrimination against specific racial and ethnic groups as the basis for the measure (Flanagan et al. 2011). The relatively high vulnerability in this dimension across many counties underscores the need for consideration and inclusion of minoritized communities in disaster preparedness and response activities. Recognizing the intersectionality between socioeconomic status, race, ethnicity, and age in emergency preparedness scholarship is critical for developing effective interventions. Examinations of experiences recognizing this intersectionality of lived and living experiences among older adults can inform interventions that are community led and will build on existing strengths and knowledge in the communities.
Second, our analysis found that more than three-quarters of older residents in eight counties across Central Ohio believed that they were prepared for emergencies based on FEMA guidelines. The high levels of preparedness among older adults in the region are consistent with other national-level studies showing higher preparedness among families with older adults (Rao et al. 2023) and could point to community strengths and connections (Howard et al. 2017) or a robust service landscape catering specifically to older adult priorities (Shih et al. 2018). At the same time, nearly 10% of older respondents were uncertain of their readiness, indicating a lack of awareness about and understanding of extreme weather events or other emergencies. Union County respondents reported the highest household preparedness per FEMA guidance, followed by Pickaway and Delaware Counties. Research indicates that socioeconomic status greatly influences disaster readiness and can be a protective factor in dealing with various stressors, including disasters and extreme weather (Zamboni and Martin 2020; Rao et al. 2023). This needs to be examined in the regional context in Central Ohio as well as with diverse populations.
The cumulative disadvantage framework suggests that communities facing multiple disadvantages struggle to protect against less immediate threats. Fayette County’s older adults had a median income of less than USD 40,000 and were the least prepared in our sample. This highlights an opportunity for policymakers and practitioners to focus on communities with limited resources at both county and state levels—particularly areas beyond urban centers, such as Fayette County, which is more rural. Fayette County is the only county in the sample without a local aging levy to support home- and community-based services for older residents. This could be one policy-level factor that might influence responses seen in the county regarding difficulties accessing necessary services during extreme weather (Muttillo 2018). Further, practice experience among the authors suggests that older immigrant and refugee adults may not understand what it means to have a three-day supply of “shelf-stable food,” raising questions about the cross-cultural validation of FEMA’s measure of preparedness among some older adult populations. Questions about effective communication techniques and motivations for preparing for emergencies must be explored, especially within the rural context.
Third, it is crucial to note that extreme weather not only risk lives and livelihoods through disease or disability; it also disrupts older adults’ everyday activities. There was substantial variation in these disruptions across the counties, with Fayette County reporting the most disruption. Nearly one-fifth of its older residents reported missing health appointments, community events, visits to places of worship, or even reaching out to their family members due to disruptions caused by severe weather conditions. Future studies should examine the differences in preparedness by different socioeconomic and contextual characteristics within these eight counties to identify needs and strengths within these communities.
Sudden and severe thunderstorms, and the resulting power outages and flooding, are now more frequent in the Midwestern United States, including Ohio, with projections of more such events. Since 2010, an average of two “billion-dollar disasters” have occurred in Ohio each year, but the number has steadily increased over the past three years (Smith 2020). The emergency preparedness funding in Ohio, provided by the state public health agency for public health emergency preparedness cooperative agreement funding, however, is currently lower than similar allocations in 43 other states (Akah et al. 2023) and can be a source of increased support. Both urban and rural communities have unique circumstances and ways to deal with climate impacts. While urban areas dominate the public imagination on climate impacts, higher percentages of people live in poverty in rural areas without access to the economic, service, and technological infrastructure available in urban areas. Reaching rural populations for input and participation in the development of strategies to prepare for disasters can be more challenging. Creative engagement strategies such as meetings at the local grocery stores or convenience market/gas stations in the area are warranted.
Community case profiles to highlight rural and urban areas in the context of climate change and increased likelihood of extreme weather events are helpful in enabling us to understand the unique circumstances older adults face in these regions and how communities of varying characteristics can be better prepared. Improved access to resources, including specialized medical care and plans to deal with power and service interruptions, creating tailored evacuation plans specific to individual needs, and receiving timely, accurate, and reliable information on preparedness and response all are ways in which counties can ensure older adult well-being in disaster contexts. Our results identify unique dimensions of vulnerability and arenas of intervention for policymakers and practitioners.
Using the cumulative disadvantage and vulnerability frameworks, Fayette County emerged as uniquely disadvantaged, with the lowest median income, the highest social vulnerability across multiple dimensions, and the most reported disruptions to life activities due to extreme weather events. Recent explorations of climate change beliefs and risk perceptions in the United States by Marlon et al. (2022) shed light on the relationship between experiences, beliefs, and action. While 60% of Fayette County residents believed that global warming was taking place, 46% believed that human activities cause it, and 34% had experienced the effects of this warming. Notably, only 36% of Fayette County residents believed that global warming would harm them personally, and less than 30% reported hearing about global warming in the media once a week. These conclusions, alongside our findings, suggest the disconnect between residents’ experiences, risk perception, and awareness. This also underscores the need to include older adults in study samples to understand their specific beliefs, experiences, and behaviors around climate change and extreme weather impacts.
8 Conclusion
We used a multiple-case study methodology and data from primary and secondary sources to examine emergency preparedness and disruptions caused by extreme weather among older adults across eight counties in Central Ohio. The role of socioeconomic status and other contextual determinants in older adults’ abilities to withstand extreme weather events should be further explored in the regional context. We noted a variation in emergency preparedness among older adult residents of Central Ohio, an area of emerging climate-driven emergencies. It is important to focus on the unique experiences of older adults on preparedness and disruptions to their lives from extreme weather to inform targeted disaster information exchange, knowledge, and resource mobilization across community and policy contexts.
The county profiles in our study offer important learning points for other counties in the Midwestern United States, providing an overview of existing vulnerabilities, socioeconomic and housing conditions, assessment of special needs, and emergency preparedness and current disruptions. Further study is needed to determine whether FEMA’s widely used preparedness assessment is valid for use with diverse populations and to examine the relationship between key characteristics identified in the study and preparedness and disruptions. Extreme weather events in Central Ohio have disrupted older adults’ access to health appointments, community events, places of worship, and friends and family. Findings identified vulnerable counties in the region and also hint at a disconnect between residents’ disaster-related experiences, risk perception, and awareness.
References
Adger, W.N. 2006. Vulnerability. Global Environmental Change 16(3): 268–281.
Age-Friendly Innovation Center, Central Ohio Area Agency on Aging, and Franklin County Office on Aging. 2021. Regional assessment on aging survey report. Olathe, KS: ETC Institute. https://public.tableau.com/app/profile/christy.kranich/viz/CORAA2021/Home. Accessed 27 Feb 2024.
Akah, H., C. Almasi, A.B. Stevens, and N. Wiselogel. 2023. 2023 health value dashboard. Columbus, OH: Health Policy Institute of Ohio. https://www.healthpolicyohio.org/wp-content/uploads/2023/04/2023HealthValueDashboard_Final.pdf. Accessed 27 Feb 2024.
Al-Rousan, T.M., L.M. Rubenstein, and R.B. Wallace. 2014. Preparedness for natural disasters among older US adults: A nationwide survey. American Journal of Public Health 104(3): 506–511.
Aly, R., H. Akah, and Z. Reat. 2020. Summary assessment of older Ohioans. Columbus, OH: Ohio Department of Aging. https://aging.ohio.gov/about-us/reports-and-data/summary-assessment-of-older-ohioans-2020. Accessed 29 Feb 2024.
Angel, J., C. Swanston, B.M. Boustead, K. Conlon, K. Hall, J. Jorns, K. Kunkel, and M. Lemos et al. 2018. Midwest. In Impacts, risks, and adaptation in the United States: Fourth national climate assessment, vol II, ed. D.R. Reidmiller, C.W. Avery, D.R. Easterling, K.E. Kunkel, K.L.M. Lewis, T.K. Maycock, and B.C. Stewart, 872–940. Washington, DC: U.S. Global Change Research Program.
Ashida, S., X. Zhu, E.L. Robinson, and A. Schroer. 2018. Disaster preparedness networks in rural Midwest communities: Organizational roles, collaborations, and support for older residents. Journal of Gerontological Social Work 61(7): 735–750.
ATSDR (Agency for Toxic Substances and Disease Registry). 2020. CDC/ATSDR Social Vulnerability Index (SVI). https://www.atsdr.cdc.gov/placeandhealth/svi/index.html. Accessed 27 Feb 2024.
Bartlett, L., and F. Vavrus. 2017. Comparative case studies: An innovative approach. Nordic Journal of Comparative and International Education. https://doi.org/10.7577/njcie.1929.
Bell, S.A., D. Singer, E. Solway, M. Kirch, J. Kullgren, and P. Malani. 2021. Predictors of emergency preparedness among older adults in the United States. Disaster Medicine and Public Health Preparedness 15(5): 624–630.
Bryant, N., R. Stone, C. Connelly, and K. Boerner. 2022. The impact of climate change: Why older adults are vulnerable. Boston, MA: LeadingAge LTSS Center. https://ltsscenter.org/reports/The_Impact_of_Climate_Change_Why_Older_Adults_are_Vulnerable.pdf. Accessed 27 Feb 2024.
Dabelko-Schoeny, H., A. Maleku, Q.C. Cao, K. White, and B. Ozbilen. 2021. We want to go, but there are no options: Exploring barriers and facilitators of transportation among diverse older adults. Journal of Transport & Health 20: Article 100994.
Dannefer, D. 2003. Cumulative advantage/disadvantage and the life course: Cross-fertilizing age and social science theory. The Journals of Gerontology 58(6): S327–S337.
EPA (US Environmental Protection Agency). 2016a. Climate change and the health of older adults. https://www.epa.gov/climateimpacts/climate-change-and-health-older-adults. Accessed 28 Jul 2023.
EPA (US Environmental Protection Agency). 2016b. Climate change indicators: US and global temperature. https://www.epa.gov/climate-indicators/climate-change-indicators-us-and-global-temperature. Accessed 28 Jul 2023.
EPA (US Environmental Protection Agency). 2016c. What climate change means for Ohio. EPA 430-F-16-037. https://19january2017snapshot.epa.gov/sites/production/files/2016-09/documents/climate-change-oh.pdf. Accessed 27 Feb 2024.
FEMA (Federal Emergency Management Agency). 2023. Risk comparison report. National risk index. https://hazards.fema.gov/nri/report/viewer?dataLOD=Census%20tracts&dataIDs=T48201334100#SectionSocialVulnerability. Accessed 3 Nov 2023.
Ferraro, K.F., and J.A. Kelley-Moore. 2003. Cumulative disadvantage and health: Long-term consequences of obesity?. American Sociological Review 68(5): 707–729.
Flanagan, B.E., E.W. Gregory, E.J. Hallisey, J.L. Heitgerd, and B. Lewis. 2011. A social vulnerability index for disaster management. Journal of Homeland Security and Emergency Management. https://doi.org/10.2202/1547-7355.1792.
Georgetown Law. 2023. Preparing for climate change in Ohio. Washington, DC: Georgetown Climate Center. https://www.georgetownclimate.org/adaptation/state-information/ohio/overview.html. Accessed 27 Feb 2024.
Gonyea, J.G., A. Curley, K. Melekis, N. Levine, and Y. Lee. 2018. Loneliness and depression among older adults in urban subsidized housing. Journal of Aging and Health 30(3): 458–474.
Henderson, T.L., K.A. Roberto, and Y. Kamo. 2010. Older adults’ responses to Hurricane Katrina: Daily hassles and coping strategies. Journal of Applied Gerontology 29(1): 48–69.
Howard, A., T. Blakemore, and M. Bevis. 2017. Older people as assets in disaster preparedness, response and recovery: Lessons from regional Australia. Ageing and Society 37(3): 517–536.
Ingram, D.D., and S.J. Franco. 2012. NCHS urban–rural classification scheme for counties. Vital Health Statistics 166(154): 1–65.
Killian, T.S., Z.K. Moon, C. McNeill, B. Garrison, and S. Moxley. 2017. Emergency preparedness of persons over 50 years old: Further results from the health and retirement study. Disaster Medicine and Public Health Preparedness 11(1): 80–89.
Kim, H., and M. Zakour. 2017. Disaster preparedness among older adults: Social support, community participation, and demographic characteristics. Journal of Social Service Research 43(4): 498–509.
Kurlychek, M.C., and B.D. Johnson. 2019. Cumulative disadvantage in the American criminal justice system. Annual Review of Criminology 2(1): 291–319.
Lubben, J., E. Blozik, G. Gillmann, S. Iliffe, W. von Renteln Kruse, J.C. Beck, and A.E. Stuck. 2006. Performance of an abbreviated version of the Lubben social network scale among three European community-dwelling older adult populations. The Gerontologist 46(4): 503–513.
Marlon, J., L. Neyens, M. Jefferson, P. Howe, M. Mildenberger, and A. Leiserowitz. 2022. Yale climate opinion maps 2021. New Haven, CT: Yale Program on Climate Change Communication. https://climatecommunication.yale.edu/visualizations-data/ycom-us. Accessed 27 Feb 2024.
McCarthy, S., and S. Friedman. 2023. Disaster preparedness and housing tenure: How do subsidized renters fare?. Housing Policy Debate 33(5): 1100–1123.
Merdjanof, A.A. 2021. Climate, disasters, and extreme weather events: Vulnerability, resources, and interventions for lower-income older adults. Generations 45(2): 1–10.
Muttillo, E. 2018. Should your address determine access to aging services? An analysis of senior tax levies in Ohio. Cleveland, OH: Center for Community Solutions. https://www.communitysolutions.com/address-determine-access-aging-services-analysis-senior-tax-levies-ohio. Accessed 27 Feb 2024.
NOAA (National Oceanic and Atmospheric Administration). 2022. State climate summaries 2022—Ohio. Boulder, CO: NOAA National Centers for Environmental Information. https://statesummaries.ncics.org/chapter/oh. Accessed 27 Feb 2024.
Phillips, B.D., and B.H. Morrow. 2007. Social science research needs: Focus on vulnerable populations, forecasting, and warnings. Natural Hazards Review 8(3): 61–68.
Priya, A. 2021. Case study methodology of qualitative research: Key attributes and navigating the conundrums in its application. Sociological Bulletin 70(1): 94–110.
Public and Affordable Housing Research Corporation and National Low Income Housing Coalition. 2021. Taking stock: Natural hazards and federally assisted housing. https://www.pahrc.org/wp-content/uploads/2021/06/Taking-Stock.pdf. Accessed 27 Feb 2024.
Rao, S., F.C. Doherty, S. Teixeira, D.T. Takeuchi, and S. Pandey. 2023. Social and structural vulnerabilities: Associations with disaster readiness. Global Environmental Change 78: Article 102638.
Rule, P., and V.M. John. 2015. A necessary dialogue: Theory in case study research. International Journal of Qualitative Methods. https://doi.org/10.1177/1609406915611575.
Seneviratne, S.I., X. Zhang, M. Adnan, W. Badi, C. Dereczynski, A. Di Luca, S. Ghosh, I. Iskandar, et al. 2021. Weather and climate extreme events in a changing climate. In Climate change 2021: The physical science basis. Contribution of Working Group I to the Sixth Assessment Report of the Intergovernmental Panel on Climate Change, 1513–1766. Cambridge, UK: Cambridge University Press.
Shih, R.A., J.D. Acosta, E.K. Chen, E.G. Carbone, L. Xenakis, D.M. Adamson, and A. Chandra. 2018. Improving disaster resilience among older adults. Rand Health Quarterly 8(1): Article 3.
Shuey, K.M., and A.E. Willson. 2008. Cumulative disadvantage and black-white disparities in life-course health trajectories. Research on Aging 30(2): 200–225.
Smith, A.B. 2020. US billion-dollar weather and climate disasters, 1980–present (NCEI Accession 0209268). Boulder, CO: NOAA National Centers for Environmental Information.
Urban Institute. 2020. Forecasting state and national trends in household formation and homeownership: Ohio. https://www.urban.org/policy-centers/housing-finance-policy-center/projects/forecasting-state-and-national-trends-household-formation-and-homeownership/ohio. Accessed 28 Jul 2023.
US Census Bureau. 2022. American community survey 5-year estimates. https://www.census.gov/data/developers/data-sets/acs-5year.html. Accessed 28 Jul 2023.
US Department of Housing and Urban Development (HUD). 2021. Picture of subsidized households. https://www.huduser.gov/portal/datasets/assthsg.html. Accessed 18 Jan 2023.
US Global Change Research Program. 2018. Fourth national climate assessment, Vol. 2: Impacts, risks, and adaptation in the United States. Washington, DC: US Global Change Research Program.
Yin, R.K. 1981. The case study as a serious research strategy. Science Communication, Knowledge 3(1): 97–114.
Yin, R.K. 2011. Applications of case study research. Thousand Oaks, CA: Sage Publications Inc.
Yin, R.K. 2018. Case study research and applications—Design and methods, 4th edn. Thousand Oaks, CA: Sage.
Zakour, M.J., and D.F. Gillespie. Community disaster vulnerability: Theory, research, and practice. New York: Springer.
Zamboni, L.M., and E.G. Martin. 2020. Association of US households’ disaster preparedness with socioeconomic characteristics, composition, and region. JAMA Network Open 3(4): Article e206881.
Author information
Authors and Affiliations
Corresponding author
Rights and permissions
Open Access This article is licensed under a Creative Commons Attribution 4.0 International License, which permits use, sharing, adaptation, distribution and reproduction in any medium or format, as long as you give appropriate credit to the original author(s) and the source, provide a link to the Creative Commons licence, and indicate if changes were made. The images or other third party material in this article are included in the article's Creative Commons licence, unless indicated otherwise in a credit line to the material. If material is not included in the article's Creative Commons licence and your intended use is not permitted by statutory regulation or exceeds the permitted use, you will need to obtain permission directly from the copyright holder. To view a copy of this licence, visit http://creativecommons.org/licenses/by/4.0/.
About this article

Cite this article
Rao, S., Doherty, F.C., Traver, A. et al. Extreme Weather Disruptions and Emergency Preparedness Among Older Adults in Ohio: An Eight-County Assessment. Int J Disaster Risk Sci 15, 213–225 (2024). https://doi.org/10.1007/s13753-024-00548-8
Accepted:
Published:
Issue Date:
DOI: https://doi.org/10.1007/s13753-024-00548-8