
Abstract
The aim of this pilot study conducted by the consortium for capacity building was to develop a prototype concept and methodology for the classification and visualization of the geographic impacts of El Niño on annual climates and seasonality. Our study is based on the Köppen–Geiger climate classification scheme for a set of selected countries affected by strong El Niños in Latin America. By identifying and visualizing the annual and seasonal changes in regional, national, or subnational climate regimes that generally accompany an El Niño event, this research proposes an efficient way to detect and describe climate shifts and variability across time and space. Such knowledge provides a support tool for risk analysis and can potentially enhance government efforts of climate risk management, including disaster risk reduction activities that prevent, mitigate, and improve coping responses to El Niño-related hydrometeorological threats. Details of the conceptual approach and methodology to classifying and mapping El Niño’s impacts are described and explained using the Central American and circum-Caribbean region as a case study. The potential applications for disaster risk reduction as well as its limitations and future work are also discussed.
1 Introduction
El Niño is the most significant climate variability pattern after the changing of the seasons. It originates in the equatorial Pacific Ocean, occurs every 2–8 years, and is often associated with atmospheric teleconnectionsFootnote 1 and hydrometeorological (hydromet) hazards, such as floods, droughts, and extreme temperatures (McPhaden et al. 2006; Glantz 2015). About one-fourth of the time the equatorial Pacific Ocean is likely to be affected by El Niño conditions (Trenberth 1997) and thus its recurring nature and disturbance of “normal” (that is, expected) regional climate patterns provide considerable insight with regards to Earth’s climate, water, or weather-related future. Perturbations associated with El Niño are not only rainfall and temperature anomalies, but also seasonal changes. Therefore, a goal of this present study, which is part of a broader investigation of El Nino “readiness” (Glantz et al. 2018) conducted by the Consortium for Capacity Building (CCB), was to identify the changes in regional climate regimes, including the seasonality that generally accompanies an El Niño event. Such knowledge, we argue, is valuable to disaster risk reduction (DRR) efforts and may improve a government’s strategic, tactical, and operational preparedness plans to prevent and mitigate the impacts of El Niño-related hydromet hazards.
An impact map is one important source of knowledge and tool for decision makers seeking to increase their readiness towards hydromet hazards expected during El Niño. Arguably, the most significant mapsFootnote 2 are those associated with the work of Ropelewski and Halpert (1987). Using data from 1877 to 1983, these researchers developed teleconnection maps of impacts on precipitation patterns. Until the present, these teleconnection maps are likely among the most referred conceptions. While the work of Ropelewski and Halpert has certainly proven an important guide to the impacts of El Niño on geographies worldwide, today the conception is outdated and in several instances potentially misleading given that several El Niños have occurred since the mid-1980s, including episodes in 1986–1987, 1991–1992, 1997–1998, and the “Godzilla El Niño” of 2015–2016 (Schiermeier 2015). In addition, Ropelewski and Halpert (1987) did not include the 1982–1983 El Niño, then-labeled as “The El Niño of the Century.” Furthermore, one could argue that the maps are too general to be effectively used as a decision-support tool because they encompass large areas and do not capture impacts within climate zones or ecological regions at the subnational level, which, if available, may provide societies and governments with more precise information about the climate shifts that occur during El Niños.
The objective of this pilot study was to develop and update El Niño impact maps that visualize the potential climate regime shifts or “El Niño climate” that accompany El Niños at regional to subnational levels. Furthermore, we provide a method for classification of El Niño-related climate shifts. In addition, a sub-objective was to conceptualize and map “El Niño seasonality,” which refers to its impact over the expected seasonal climate pattern of a region. To date, such an approach to impacts has not been adequately considered. Our prototype concept and methodology for mapping “El Niño climate” and “El Niño seasonality” is based on the Köppen–Geiger climate classification scheme (Lutgens and Tarbuck 2014, pp. 412–414) for Central America and the circum-Caribbean.
By conceptualizing “El Niño climate” and “El Niño seasonality,” this study addresses the following questions: to what degree do El Niño episodes disrupt the expected “normal” climate of a region? And is the El Niño signal strong enough to modify a region’s climatic classification, that is, climate zone and its seasonality? In doing so, this work proposes an efficient and practical analysis tool to support government efforts to improve climate risk management, including DRR activities that use available El Niño-related knowledge to prevent, mitigate, and improve coping responses to hydromet threats and seasonal shifts.
Following this introduction is the conceptual approach developed by CCB to map El Niño’s impacts. The next sections describe the prototype methodology for classifying El Niño’s related climate shifts and data based on the Köppen–Geiger classification system. The results include a map of El Niño annual climate shifts and seasonality in Central America and the circum-Caribbean, and conclusions, which summarize the study, suggest implications for DRR and its limitations, as well as discuss next steps in the project.
2 Conceptual Approach to Mapping El Niño’s Impacts
The CCB has developed a prototype concept and methodology for mapping El Niño’s impacts based on the Köppen–Geiger classification of world climates. The Köppen–Geiger system categories are based on annual and monthly averages of temperature and precipitation. This classification recognizes five major climatic types, each of which is designated by a capital letter. Table 1 displays these major types, which can be further divided into subtypes based on the precipitation pattern (second letter) and the temperature (third letter).
The Köppen–Geiger system is widely used for teaching climate literacy (for example, geography and earth and environmental sciences). It has also been utilized for research applications, including the regionalization of climates (Peel et al. 2007) and the impacts of a changing climate (Shi et al. 2016). In the latter study, the authors reclassified climate regions around the globe in order to identify changes in regional climates in the period of contemporary global warming—1961–2010. Their study provided a basis for countries and regions of the world to develop plans for adapting to climate change, especially for managing extreme weather and climate disasters and environmental risks. In CCB’s study, we suggest a basis for DRR planning by governments for El Niño’s quasiperiodic hydromet and seasonal change threats.
El Niño teleconnections and impacts on climate could be conceptualized in two ways: (1) a change in weather patterns occurs that produces anomalous hydromet events, but throughout the year the seasonal regime remains as expected; and (2) a change in weather patterns takes place that generates anomalous hydromet events so persistent or appear in a such way that they temporarily change the seasonality of the climate within the year. For example, a shift drives a Tropical Monsoon climate type to Savannah or even to a semiarid climate type, which is found in the “Dry Corridor” of Central America during El Niño events.
In the first conception, during El Niños, there is no anomalous shift in terms of the seasonal climate (considered as “normal”) of a region. Theoretically, the Köppen–Geiger classification for a region would not change. In the second conception, during El Niños, the expected climate regime in a given region would be altered temporarily, shifting to a different climate regime and, therefore, to different associated hydromet conditions for the season, which could be visualized using the Köppen–Geiger classification system.
In this study, the visualization of El Niño-related climate shifts based on the Köppen–Geiger classification is represented by qualitative maps of El Niño and its foreseeable impacts on regional climate regimes. The changes captured in a Köppen–Geiger map for El Niño events in a specific region, coupled with consideration of other influences over the regional climate have the potential to make the El Niño-related information more comprehensive and meaningful for decision makers as well as to society. Thus, this work contributes to establishing a more “definitive” picture about the impacts of El Niño on the climate of a region, which is an ongoing task in climate and disasters research.
3 Methodology and Data
The prototype Köppen–Geiger El Niño climate maps were constructed using geographic information systems (GIS) to represent temporary shifts from the long-term average of the region’s annual climate. The area of study is the Central American and circum-Caribbean region which comprises of 11 countries located between Mexico and South America and the western Caribbean (Greater Antilles).
The traditional Köppen–Geiger climate types served as the baseline input data to analyze climate shifts during an El Niño episode. The interannual Köppen–Geiger climate classification data at a global scale (resolution of 0.5 degree by 0.5 degree longitude/latitude) were obtained from an existing dataset for the period 1901–2010 from Chen and Chen (2013) (http://hanschen.org/koppen/). Relevant information was derived in order to construct: (1) a long-term average Köppen–Geiger climate map using a color scheme described in Peel et al. (2007); a 60-year average (1951–2010) was used as the long-term mean to avoid the effect of any trend in the data; and (2) an individual year average (according to the calendar year—January–December) based on the Köppen–Geiger climate classification scheme for El Niño years. This information is contrasted with the long-term map to identify change. To capture the potential outstanding signals of El Niño over the climate regime, the analysis focused on five strong and very strong El Niño events based on the ONI index (NOAA 2017): 1957–1958, 1965–1966, 1972–1973, 1982–1983, and 1997–1998. Strong El Niño events were chosen because teleconnection signals in the region of study can be assumed as stronger during such events. The analysis considered the evolution of El Niño impacts across calendar years according to Ha et al. (2012), also based on the ONI index. Their study suggests that El Niño year 0 impacts occur in the Northern Hemisphere (NH) summer, autumn, and early winter, while in Year + 1 impacts could occur in the NH late winter, spring, and early summer. Taking this information into account, our analysis focused on the year of onset and the year of decay as follows:
-
Year 0 (El Niño year of onset): 1957, 1965, 1972, 1982, and 1997.
-
Year + 1 (El Niño year of decay): 1958, 1966, 1973, 1983, and 1998.
The Köppen–Geiger climate data were imported into ArcGIS (version 10.2, ESRI 2017) to create a continuous spatial dataset. El Niño-related climate shifts were calculated using the differences between the long-term average of the Köppen–Geiger climate data and classifications derived from considering only years with very strong El Niño events. All geographic areas that underwent a climate shift (when difference was other than zero) were kept and areas that did not undergo a climate shift were removed. El Niño climate shift subsets were then created. Only those areas of climate shift, which fulfill the condition that their spatial area were equal to or higher than 1% of the total area of all climate difference classes were selected. The final outputs were Köppen–Geiger climate difference maps visualized in Matlab (version R2017a, MATHWORKS 2017) that represent El Niño climate shifts.
4 Results
The following section presents the main findings of our conceptual approach using the prototype methodology described earlier, in the Central American and circum-Caribbean region. The more relevant configurations of the Köppen–Geiger climate classification during El Niño’s years are analyzed describing the temporary changes from the long-term configuration, which include annual and seasonality shifts and how those changes were classified.
4.1 El Niño Climate Köppen–Geiger Maps
Figure 1 is a map of the long-term average Köppen–Geiger climate for the Central American and the circum-Caribbean region. As stated earlier, annual climate shifts were defined as the difference between the long-term average Köppen–Geiger climate and the individual calendar year in which an El Niño event occurred. In Fig. 2, black regions indicate areas where the Köppen–Geiger climate type changed from the long-term average, at least once during an El Niño year. The black regions are potential areas likely to be sensitive to El Niño-related climate variations. They represent climate shifts that could be consistently considered an El Niño signal in the year-to-year variability of the Köppen–Geiger climate classification in the region. The colored regions identify spatially stable regions, where climate shifts did not occur.

Source: Adapted from Chen and Chen (2013)
Köppen–Geiger climate classification based on long-term average (1951–2010) climate data for the Central American and circum-Caribbean region.

Köppen–Geiger variability from a 60-year average (1951–2010) for El Niño Year 0 (left) and Year + 1 (right) based on five strong El Niños in the Central American and circum-Caribbean region. Black regions indicate areas where the Köppen–Geiger climate type changed from the long-term average, at least once during an El Niño year
Approximately 42 types of temporary climate shifts were identified that could be related to El Niño-related impacts in the region. Although most of the shifts change within the same original major climate type, for example, tropical rainforest (Af) to tropical savannah (Aw), there were some climate shifts that changed to different climate types. These alterations were basically related to extreme dry conditions that changed from tropical climates to arid or semiarid, for example, tropical savannah (Aw) to hot semiarid (BSh).
Figure 3 shows the spatial coverage of the different climate classes in terms of percentage of the total area for the Central American and the circum-Caribbean region for El Niño Year 0, El Niño Year + 1, and the long-term average Köppen–Geiger climate, respectively. During El Niño years, the climate structure of the region experiences a significant spatial reconfiguration in terms of the previous distribution of different Köppen–Geiger climate types and their subtypes. In El Niño Year 0, 50% of the region underwent a shift from its long-term average climate pattern, while in Year + 1 the affected area increased to 53%. As a consequence, new patterns of Köppen–Geiger climate types and their subtypes emerged. In temperate areas, north of the study area and corresponding with southeastern North America, there is, in the long-term average, predominance of the Humid Subtropical climate (Cfa), which corresponds with a Humid Subtropical climate with rainfall often showing a summer peak, although usually having a uniform or slowly varying rainfall cycle.

Average spatial coverage distribution of Köppen–Geiger subtypes for El Niño Year 0 (top panel), El Niño Year + 1 (middle panel), and long-term average (bottom panel)
The development of an El Niño in the second half of Year 0 imposes significant changes in the study region, which trigger a shift towards other climate subtypes due to a sharper contrast between summer and winter rainfall. In fact, what this observation suggests is that strong El Niños change the characteristics of the expected flow of the seasons (that is, seasonality). For example, the spatial coverage of the Humid Subtropical climate (Cfa) is reduced by more than 15% of its original size (Fig. 4). Over the tropical areas of the region, there is a shift in an El Niño year toward drier conditions. The predominant Tropical climate type in the long-term average pattern is the Tropical Savannah climate (Aw) with the driest month in the winter accounting for more than 19% of the region. Other important types are the Tropical Rainforest climate (Af) and Tropical Monsoon climate (Am), which are usually found in Central America and some Caribbean islands. During El Niño Year 0 and Year + 1, Am and Af climate types decrease in area. However, this change is more significant in the case of the Af climate type. Most climate shifts are to the driest versions of Aw and the Semiarid climate type (BSh). Noticeable is the increase in area of a very unusual Köppen–Geiger climate subtype, the Savannah climate with dry summer (As), usually found in the north of Hispaniola Island (Haiti and the Dominican Republic) and the Bahamas. During an El Niño event, basically in Year 0, some places, mainly in Central America and the Caribbean, experience dry conditions that last into the usual rainy season (NH summer). Consequently, the so called “mid-summer drought” (a relative short dry period into the summer) tends to be stronger and longer lasting. Under these conditions, if the rainfall of one summer month falls below 60 mm and if the winter behaves normally or is abnormally rainy, the region’s seasonality suffers a “reversal” in terms of the occurrence of the driest month.

Comparison of spatial coverage of changes (%) in climate subtypes in response to El Niño in Year 0 and Year + 1 based on five strong El Niños
Figures 5 and 6, which depict the Köppen–Geiger climate evolution during El Niño Year 0 and Year + 1, respectively, reveal a strong spatial variability. Climate shifts look more extensive during Year + 1, basically because of the expansion of the impacts over Cuba, the south of Mexico, and Central America.

Köppen–Geiger climate classification during El Niño Year 0 based on five strong El Niños in the Central American and circum-Caribbean region

Köppen–Geiger climate classification during El Niño Year + 1 based on five strong El Niños in the Central American and circum-Caribbean region
4.2 Classifying Climate Shifts During a Calendar Year During El Niño
The number of observed climate shifts among Köppen–Geiger climate types or subtypes presents a complex picture that is hard to comprehend at first glance. If one focuses on the “direction” of the change, however, specifically concentrating on how a climate shift affects seasonality, many similarities can be found. These consistencies may describe a more coherent illustration of what could be called an “El Niño Climate Shift.” For instance, shifts from Tropical Savannah (Aw) to Hot Semiarid (BSh) and Humid Subtropical (Cfa) to Cold Semiarid (BSk), although different in nature, indicate a shift toward severe dryness, likely expressed in more frequent and intense drought events. These perturbations consequently are coincidental, and indicate a similar direction of a climate shift.
To give a more simplified view, based on the nature of the observed Köppen–Geiger climate shifts during El Niño, CCB developed a classification focused on the result of what a shift means in terms of “drier” and “wetter” climate types (Table 2). The classification is divided into two main groups by type of climate shifts and of subtypes.
Group 1 includes climate shifts where the most significant changes occur over the precipitation regime. This includes two types of the traditional “wet to dry” impacts but with some subtypes giving information about the most affected seasons and links to temperature changes. One example is the climate shift from tropical monsoon (Af) to tropical savanna (Am). The most significant characteristic is a reinforcement and likely prolonging of the dry season, which is clearly a shift to a drier climate (type 1), but with no significant changes in temperature (subtype 1).
Two additional types of climate shifts were included in Group 1 that are related to changes in the seasonal regime: a shift towards an increased contrast between the wet and dry seasons and a shift towards a rainfall seasonal reversal in the rainfall minimum month. The first of these two types indicates changes that are not necessarily linked to a drier or a wetter climate, but are related to significant changes in rainfall conditions in one or more seasons that increase the seasonal contrast between the wet and dry seasons. One example is the climate shift from humid subtropical (Cfa) to mediterranean (Csa) during which the seasonally stable Humid Subtropical climate changes where the most significant rainfall is concentrated in the winter season.
Seasonal reversal in the rainfall minimum includes those changes in the rainfall regime that bring a significant shift, likely a reversal in the dry to wet seasons regime. One example is the climate shift from Tropical Savanna with a dry winter to Tropical Savanna with a dry summer. Such a change is found in some places of Central America that experience intense and prolonged mid-summer drought conditions during El Niño.
Group 2 includes shifts that are more significant in the temperature regime. It is a small group almost marginal in the study region that tends to be concentrated in the continental highlands. This group is composed of two types of climate shifts. The first is a “cool to warm” type, which can be found in a climate shift from Subtropical Highland (Cwb—from average temperatures below 22 °C (all months)) to Monsoon-influenced Humid Subtropical (Cwa—at least 1 month averaging over 22 °C), for example, in the mountainous areas of Guatemala. The second is a “warm to cool” type. An example is the climate shift from Hot Semiarid (Bsh) to Cold Semiarid (Bsk), which is basically due to the abnormal irruption of cold air masses that are found in the semiarid areas in northern Mexico.
Figures 7 and 8 show a more simplified view of the Köppen–Geiger climate shifts depicted in Figs. 5 and 6. Based on these configurations some general patterns can be identified during an El Niño Year 0:

Major climate shift types for rainfall regime in El Niño Year 0 based on five strong El Niños in the Central American and circum-Caribbean region

Major climate shift types for rainfall regime in El Niño Year + 1 based on five strong El Niños in the Central American and circum-Caribbean region
-
The stable Humid Subtropical (Cfa) climate prevailing in the southeast of North America is disrupted by abnormal NH fall-winter rainfall conditions generated by El Niño teleconnections. Consequently, Year 0 conditions shift to a more “seasonal” variant of the Subtropical climate with an increasing contrast of the dry to wet season. This effect is more consistent in areas bordering the semiarid region in the southwestern United States (for example, over Texas) and the northeastern tip of Mexico, where rainfall amounts in the summer season are relatively low.
-
In the dry climate (arid-semiarid) areas prevailing in northern Mexico and the southwest of the United States, changes look quite irregular. But these patterns show trends of an expansion of semiarid conditions southward and a relaxation of the desert conditions in the northwest tip of the area due to the onset of winter rains.
-
In Central America, conditions tend to shift toward drier versions of Tropical climates. For example, areas of Humid Tropical climates such as Af (Rainforest) and Am (Monsoon), which prevail in the Atlantic slope, are reduced, shifting to Tropical Savannah conditions due to the rapid shift towards rainfall deficit status with the onset of El Niño. Over the Pacific slope, some areas of Tropical Savannah could shift to a semiarid state.
-
Drier conditions tend to prevail over some areas of the circum-Caribbean region, where small zones of Humid Tropical (Cfa) climate found in eastern Cuba and Hispaniola practically disappear during El Niño Year 0.
The observed Köppen–Geiger climate shifts during El Niño Year + 1 show similar trends to Year 0 in many areas across Central America and southeast of the United States. But significant differences can be found in the northwest area of the region, which is dominated by dry climates, where arid and semiarid areas decrease in spatial extent and shift towards more Humid Subtropical (Cfa) conditions. This shift is consistent with late NH winter rainfall anomalies and cooler temperatures in some areas. Climate shifts over the southeast of the Gulf of Mexico (Cuba and Yucatan) seem more important in Year + 1 than in Year 0. This is mainly due to the increase of storms in late NH winter in this area during El Niños (Naranjo 2000).
The El Niño climate shifts classification in Table 2 could be considered a comprehensive typology of the observed Köppen–Geiger climatic shifts during an El Niño event. However, to get a realistic picture of El Niño climate shifts requires an adequate understanding and analysis of the processes involved. El Niño impacts over the average climate patterns in the study region are concentrated only in part of the calendar year, so what happens before or after El Niño’s teleconnected impacts is crucial to define a climate shift. There is no unique way to reach a new Köppen–Geiger climate type or subtype because this depends not only on observed climate anomalies in 1 month or season; it is also contingent on the way that climate anomalies interact with the previous seasonal regime.
4.3 “El Niño Seasonality”: Central America as an Example
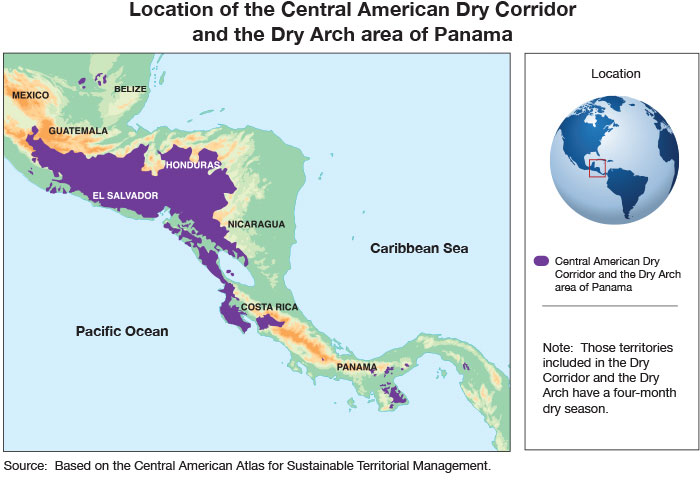
One important feature of Central America’s tropical climate is the so called “Dry Corridor”Footnote 3 that extends across Honduras, Salvador, and Nicaragua (FAO 2012). It is a stressed area in terms of rainfall that is characterized by a well-marked dry season from December to April (ECLAC 2010). Drought in the region is mostly related to below average precipitation during the rainy season and a so called annual mid-summer drought known as canicula, which is an intraseasonal period of relatively dry conditions in the middle of the rainy season in July and August (Magaña et al. 1999; FAO 2012). The term Dry Corridor, although climatic, has an ecological basis defined by a group of ecosystems that exists in the dry tropical forest of Central America. Its extent begins in Chiapas, Mexico and covers the low-lying areas of the Pacific slope and of the central region, which includes Guatemala, El Salvador, Honduras, Nicaragua, and part of Costa Rica (to Guanacaste). The corridor also includes fragments along the Caribbean coast in Honduras.
Drought in Central America is a cyclical hazard that contributes to food insecurity and disasters both in terms of social as well as environmental and economic productivity at the national and regional levels (FAO 2016). Droughts along with storms and floods represent about 94% of climate-related hazards in the region since 1930, a trend that has been increasing since the 1970s, mostly likely associated with a changing climate (ECLAC 2010). The physical causes of cyclical drought are associated with seasonal shifts of the InterTropical Convergence Zone and sometimes linked to El Niño, although it is not always the reason for drought in the region. Nevertheless, during strong El Niños there is a tendency towards drier conditions in the region, particularly in 1982–1983, 1997–1998, and 2015–2016. In terms of impacts, the Economic Commission for Central America and the Caribbean estimated that droughts contributed to USD 27 million in losses (annual average) between 1972 and 2010 (Bello et al. 2014). Overall, El Nino-related disasters (including floods) contributed to an estimated USD 222 million in losses (average) of which the greatest impacts were reported in agriculture and forestry. During the most recent event in 2015–2016, El Niño worsened an ongoing drought in the region, which affected approximately 4 million people in terms of livelihood, food security, and public health, including severe malnutrition and waterborne disease exposure (UNOCHA 2015; WHO 2016). Developing a map that shows how El Niño-related climate shifts affect a region’s flow of the season (seasonality) may assist policymakers in DRR efforts to minimize if not avoid economic, social, and health impacts.
To explore how El Niño affects the flow of the seasons in Central America, CCB applied the prototype classification of Köppen–Geiger climate shifts associated with strong El Niños in the region. Figure 9 depicts the expected impacts of El Niño in Central America considering major climate shifts. Gray regions represent where the original Köppen–Geiger climate classification did not change. Overall there is a predominant shift in the region towards drier conditions. Normally, the onset of an El Niño occurred in the NH spring, so dry conditions propagated soon into local climates. The observed seasonal shifts show differences between the Caribbean and the Pacific slopes. In the first zone, the seasonal shift points mainly towards drier conditions. The tropical rainforest (Af) climate, predominant in that area, changes to a drier version, such as Monsoon (Am) or Savannah (Aw or As), although some areas on the Caribbean coast of Nicaragua and Honduras show shifts towards wetter conditions. In the Central and Pacific areas, coincidental with the so called Dry Corridor, where a Savannah climate is predominant, drier conditions appear in the NH summer as a consequence of El Niño impacts with such severity in some locations that the monthly rainfall minimum for the entire year is reached in this season. This defines a seasonal reversal of this climatic feature. Most of the more significant effects on seasonality were observed in areas close to the “Dry Corridor.” These results depict not only a high coherence with previous knowledge about El Niño impacts in Central America (UNEP 2003; Rojas et al. 2014), but also have implications for impacts on food and water security, public health, and livelihoods during strong El Niños.

Major shifts of El Niño climate regime for Central America according to our Köppen–Geiger classification
5 Conclusions
El Niño is a known hazard-spawner associated with teleconnected impacts on physical, ecological, and human systems. It also has a creeping environmental effect because it can alter or modify the “normal” flow of the seasons of geographic regions that in turn creates definable climate shifts with the potential for calamitous effects, but also opportunities, depending on how societies prepare for and respond to those effects. Using the Köppen–Geiger climate classification scheme, this pilot study developed a prototype concept and methodology for mapping and classifying the geographic impacts of strong El Niños on annual climates and seasonality. Although the study focused on the Central American and circum-Caribbean region, the methodology can be adapted to other El Niño sensitive regions. To the authors’ knowledge, this is the first study to map El Niño’s teleconnections using the Köppen–Geiger climate classification, complementing the traditional impact-based maps of Ropelewski and Halpert (1987). The pilot results demonstrate the usability of the concept and methodology as a way to view El Niño’s impacts in a more comprehensive and practical manner for planning purposes by considering not only its effects in terms of weather or climate-related hazards, but also its effects on the seasons, which societies and ecosystems live by. Understanding and geovisualizing El Niño-related climate shifts at annual and seasonal scales can assist decision makers to improve strategies and tactics for DRR policy at regional, national, and subnational levels. Furthermore, the approach has potential applications in development planning for agriculture, food security, water management, energy, conservation, public health, and socioeconomic sectors affected by seasonal changes and shifts.
Some issues must be considered, however, before this concept and methodology can be utilized to its full potential. The calculation of Köppen–Geiger climate types and the shifts associated with El Niños depend on the existence of reliable rainfall and temperature data with adequate spatial and temporal resolutions. An inherent challenge is that almost all long-term global data sets such as the Global Precipitation Climatology Project (GPCP), Climate Hazards Group InfraRed Precipitation with Station data (CHIRPS), and Global Satellite Mapping of Precipitation (GSMaP) data sets, among others (Hylke et al. 2017), have low resolution in terms of regional, national, and subnational scales. Furthermore, observational networks with long-term climate data are limited in regions and countries that are particularly vulnerable to El Niño’s impacts. Although the use of the calendar year gives us an approximation of the contribution of El Niño’s effect on a regional climate (that is, a shift to a new climate regime), it does not capture the real time frame of El Niño’s evolution (and therefore, the actual El Niño climate). Because El Niños have a tendency to develop in the NH spring (for example, March not January) and collapse in the NH winter, in order to better estimate the actual El Niño climate in a region it will be necessary to isolate “El Niño months” based on the actual onset and end dates of events. These occurrences are not based on the calendar year. Moreover, one must also take into account that El Niños can vary from one event to another.
Currently at CCB, a new approach to the Köppen–Geiger climate classification (a modified version of this study’s prototype) that represents the actual signal of El Niño is in development, using Guatemala as a case study based on the calendar year, as well as applying the concept and methodology to La Niña impacts and disease-risk mapping. We are also exploring higher resolution data in order to better localize El Niño impacts and make the climate information more useable for DRR planning and climate risk management. Critical to the project will be collaborations with national institutions, especially national hydrological and meteorological services, which can provide data and local expert knowledge about the impacts of El Niño for the region and each respective country. The long-term goal is to provide a strategic mapping methodology that can help countries reduce their risks and work towards an acceptable level of El Niño “readiness,” while at the same time supporting their sustainable development goals.
Notes
Teleconnections are defined as atmospheric interactions between widely separated regions (Glantz 2015).
See map of the Dry Corridor at http://coffeelands.crs.org/wp-content/uploads/2016/04/Dry-corridor2.jpg.
References
Bello, O., L. Ortiz, and J. Samaniego. 2014. Estimation of the effects of disasters in Latin America, 1972–2010 (La estimacion de los efectos de los desastres en America Latina, 1972–2010). Environment and development series No. 157. Santiago: The Economic Commission for Latin America and the Caribbean (ECLAC). http://repositorio.cepal.org/bitstream/handle/11362/37104/S2014127_es.pdf?sequence=1. Accessed 5 Nov 2017 (in Spanish).
Chen, D., and H.W. Chen. 2013. Using the Köppen Classification to quantify climate variation and change: An example for 1901–2010. Environmental Development 6: 69–79.
ECLAC (Economic Commission for Central America and the Caribbean). 2010. The economics of climate change in Central America: Summary 2010. http://repositorio.cepal.org/bitstream/handle/11362/35229/1/lcmexl978i.pdf. Accessed 19 Dec 2017.
FAO (Food and Agriculture Organization). 2012. Study of the characterization of the Dry Corridor in Central America. Honduras: FAO. https://reliefweb.int/sites/reliefweb.int/files/resources/tomo_i_corredor_seco.pdf. Accessed 1 Oct 2017.
FAO (Food and Agriculture Organization). 2016. El Niño: Preparedness and response situation report—July 2016. http://www.fao.org/resilience/resources/resources-detail/en/c/423055/. Accessed 5 Sept 2017.
Glantz, M.H. 2015. Shades of chaos: Lessons learned about lessons learned about forecasting El Niño and its impacts. International Journal of Disaster Risk Science 6(1): 94–103.
Glantz, M.H., L. Naranjo, M. Baudoin, and I.J. Ramírez. 2018. What does it mean to be El Niño Ready? Atmosphere 9(3): 94.
Ha, K., S. Yoon, K. Yun, J. Kug., Y. Jang, and J.C.L. Chan. 2012. Dependency of typhoon intensity and génesis locations on El Niño phase and SST shift over the western North Pacific. Theoretical and Applied Climatology 109(3–4): 383–395.
Hylke, E.B., N. Vergopolan, M. Pan, V. Levizzani, A.I.J.M. van Dijk, G. Weedon, L. Brocca, F. Pappenberger, G. Huffman, and E.F. Wood. 2017. Global-scale evaluation of 23 precipitation datasets using gauge observations and hydrological modeling. Hydrology and Earth System Sciences 21: 6201–6217.
Lutgens, F.K., and E.J. Tarbuck. 2014. The atmosphere: An introduction to meteorology, 13th edn. New York: Pearson.
Magaña, V., J.L. Pérez, J.L. Vázquez, E. Carrisoza, and J. Pérez. 1999. El Niño and climate (El Niño y el clima). In The impacts of El Niño in Mexico (Los impactos de El Niño en México), ed. R.V.O Magaña, 23–68. Mexico: Sep-CONACYT (in Spanish).
McPhaden, M.J., S.E. Zebiak, and M.H. Glantz. 2006. ENSO as an integrating concept in earth science. Science 314: 1740–1745.
NOAA (National Oceanic and Atmospheric Administration). 2017. Cold and warm episodes by season. http://origin.cpc.ncep.noaa.gov/products/analysis_monitoring/ensostuff/ONI_v5.php. Accessed 17 Aug 2017.
Naranjo, L. 2000. Impact of extratropical cyclones in Cuba. In STORMS, ed. R. Pielke Jr. and R. Pielke Sr., 526–538. New York: Routledge Press.
Peel, M.C., B.L. Finlayson, and T.A. McMahon. 2007. Updated world map of the Köppen–Geiger climate classification. Hydrology and Earth System Sciences 11(5): 1633–1644.
Rojas, O., Y. Li, and R. Cumani. 2014. Understanding the drought impact of El Niño on the global agricultural areas: An assessment using FAO’s Agricultural Stress Index (ASI). Rome: Food and Agriculture Organization of the United Nations.
Ropelewski, C., and M. Halpert. 1987. Global and regional scale precipitation patterns associated with the El Niño/Southern Oscillation. Monthly Weather Review 115: 1606–1626.
Schiermeier, Q. 2015. Hunting the Godzilla El Niño. Nature 526: 490–491.
Shi, P., S. Sun, D. Gong, and T. Zhou. 2016. World regionalization of climate change (1961–2010). International Journal of Disaster Risk Science 7(3): 216–226.
Trenberth, K.E. 1997. The definition of El Niño. Bulletin of American Meteorological Society 78(12): 2771–2777.
UNEP (United Nations Environmental Program). 2003. GEO Latin America and the Caribbean: Environment outlook 2003. Mexico: United Nations Environment Programme, Regional Office for Latin America and the Caribbean.
UNOCHA (UN Office for the Coordination of Humanitarian Affairs). 2015. Guatemala/Honduras: 2016 humanitarian response plan (January–December 2016). http://reliefweb.int/report/guatemala/guatemala-honduras-2016-humanitarian-response-plan-january-december-2016. Accessed 10 Sept 2017.
WHO (World Health Organization). 2016. El Niño and health, Central America—January 2016. http://www.who.int/hac/crises/el-Niño/who_el_Niño_and_health_global_report_central_america_21jan2016.pdf?ua=1. Accessed 10 Oct 2017.
Acknowledgements
This study was made possible through the support provided by the Office of US Foreign Disaster Assistance, Bureau for Democracy, Conflict and Humanitarian Assistance, US Agency for International Development. The opinions expressed in this publication are those of the authors and do not necessarily reflect views of the US Agency for International Development. We thank the reviewers and editorial staff for their suggestions to improve the manuscript.
Author information
Authors and Affiliations
Corresponding author
Rights and permissions
Open Access This article is distributed under the terms of the Creative Commons Attribution 4.0 International License (http://creativecommons.org/licenses/by/4.0/), which permits unrestricted use, distribution, and reproduction in any medium, provided you give appropriate credit to the original author(s) and the source, provide a link to the Creative Commons license, and indicate if changes were made.
About this article

Cite this article
Naranjo, L., Glantz, M.H., Temirbekov, S. et al. El Niño and the Köppen–Geiger Classification: A Prototype Concept and Methodology for Mapping Impacts in Central America and the Circum-Caribbean. Int J Disaster Risk Sci 9, 224–236 (2018). https://doi.org/10.1007/s13753-018-0176-7
Published:
Issue Date:
DOI: https://doi.org/10.1007/s13753-018-0176-7