
Abstract
• Key message
The aim of the study was to distinguish orchards from other lands with forest vegetation based on the data from airborne laser scanning. The methods based on granulometry provided better results than the pattern analysis. The analysis based on the Forest Data Bank/Cadastre polygons provided better results than the analysis based on the segmentation polygons. Classification of orchards and other areas with forest vegetation is important in the context of reporting forest area to international organizations, forest management, and mitigating effects of climate change.
• Context
Agricultural lands with forest vegetation, e.g., orchards, do not constitute forests according to the forest definition formulated by the national and international definitions, but contrary to the one formulated in the Kyoto Protocol. It is a reason for the inconsistency in the forest area reported by individual countries.
• Aims
The aim of the study was to distinguish orchards from other lands with forest vegetation based on the data from airborne laser scanning.
• Methods
The study analyzed the usefulness of various laser scanning products and the various features of pattern and granulometric analysis in the Milicz forest district in Poland.
• Results
The methods based on granulometry provided better results than the pattern analysis. The analysis based on the Forest Data Bank/Cadastre polygons provided better results than the analysis based on the segmentation polygons.
• Conclusion
Granulometric analysis has proved to be a useful tool in the classification of orchards and other areas with forest vegetation. It is important in the context of reporting forest area to international organizations, forest management, and mitigating effects of climate change.
1 Introduction
There are a number of forest definitions around the world. Some of them are formulated in national legislation and apply only to the forests of the respective state, and some are international. Poland, like many other countries, is obliged to report forest area for the Climate Convention (Kyoto Protocol) and the Food and Agriculture Organization of the United Nations (FAO/UN). Aerial and satellite imagery has been successfully used since the early 2000s to estimate forest area with an accuracy of 80–99% for forest areas, 95% for forests developed during the secondary succession, and 75% for trees on agricultural land. The accuracies were calculated for the whole study sites and represent the percentage of area classified correctly according to the reference data (Kunz et al. 2000; Haapanen et al 2004; Wężyk and de Kok 2005; Próchnicki 2006; Wang et al 2007a; b; 2008; Pekkarinen et al 2009; McRoberts et al 2012; Pujar et al 2014; Kolecka et al 2015; Hościłło et al 2015; Thompson et al 2016; Szostak et al 2017). Unlike data from Airborne Laser Scanning (ALS, active remote sensing technology), passive remote sensing data do not contain information on elevation, which is important for the forest definition formulated for reporting purposes. Currently, ALS data are available in many countries of the world (in Poland within the ISOK project—IT system of Country Protection) and are increasingly used in remote sensing analyzes. The use of ALS data makes it possible to achieve or improve the results of forest area estimates (Castillo-Núñez et al. 2011; McRoberts et al. 2012; Kolecka et al. 2015; Thompson et al. 2016; Naesset et al. 2016; Szostak et al. 2017). Land use is an important factor responsible for differences in official forest area statistics (Seebach et al., 2011). However, using remote sensing methods, land area can only be classified in terms of its coverage. From aerial or satellite coverage, it is not possible to determine the land use category according to BDOT (Terrain Object Database) or other national land use/land cover databases. There are areas covered with forest vegetation that are not forests according to the forest definition of the FAO/UN and the Polish Law on Forests 1991 (e.g., post-agricultural areas with secondary succession, swamps, and orchards).
However, it is difficult to distinguish urban green (forests and forest vegetation in communal areas) from regular forest complexes and secondary succession with remote sensing; it is possible to distinguish orchards. In this paper, we have chosen to compare two approaches, vector- and grid-based. The vector-based approach assumes that the regular spatial distribution of trees is reflected by the regular distribution of points representing their vertices, expressed in numerical form by corresponding statistical coefficients. Pattern analysis-based methods have been used by Tanada and Blanco (2016) to detect orchards with an accuracy (the percentage of area classified correctly according to the reference data) of 73–99%. The grid-based approach assumes that the different structure of various forms of land use and cover (LULC) is reflected in satellite and aerial photographs in the form of raster images with a characteristic distribution of pixel values. Methods based on texture analysis and granulometry have been used by Aksoy et al. (2010, 2012), Mougel et al. (2008), Ranchin et al. (2001), Trias-Sanz (2006), Helmholz and Rottensteiner (2009), Ursani et al. (2012), Erfanifard and Rezayan (2014), Komba et al. (2015), Kupidura (2019), and Kupidura et al. (2019), with accuracy up to 96%. The use of both approaches is based on the assumption that the specific regular structure of trees in orchards is different from the irregular structure of forests (and other types of trees). According to this hypothesis, this difference is so important that both the analysis of the distribution of the regularity of trees in the orchard and the analysis of the texture, depending on this distribution, should allow us to distinguish the distinctive features of these two different types of tree stands.
2 Materials and methods
2.1 Brief presentation of tested methods
The study was conducted using two methods: pattern analysis of the mutual distribution of points representing tree crowns and texture analysis using the granulometric method. The main assumptions of the two methods used are presented below.
2.1.1 Pattern analysis
The basic concept that describes the distribution of points based on density is homogeneity. The distribution of points is homogeneous if the density of points is the same in all identical subareas. It can be tested using the χ2-test. Conversion of point data into continuous data allows their analysis with areas (after reclassification) or geostatistical data. Point distribution analysis as a method of analyzing the distribution of objects in geographic space dates back to the turn of the 1950s and early 1960s (Gatrell et al. 1995). This distribution can be described as clumped, scattered, and random (Pielou 1959; Ek 1969; Robeson et al. 2014). The distribution factor is a statistical measure expressed in numbers. It requires establishing the null hypothesis that objects are randomly distributed and then proving or disproving this hypothesis with a certain margin of error expressed by the significance level “p.” Li and Zhang (2007) compared various methods of tree distribution analysis in spruce-fir stands, including nearest neighbor, K-Ripley function, and autocorrelation. Pattern analysis algorithms are inferential statistics; they start with the null hypothesis that your traits or the values associated with your traits have a spatially random pattern. They then calculate a p-value, which is the probability that the null hypothesis is correct (that the observed pattern is simply one of many possible versions of complete spatial randomness). Calculating a probability can be important when you need to have a high degree of confidence. The following list has some of the most popular algorithms for pattern analysis and gives a brief description of each (https://pro.arcgis.com/en/pro-app/latest/tool-reference/spatial-statistics/an-overview-of-the-analyzing-patterns-toolset.htm):
-
Average nearest neighbor—Calculates a nearest neighbor index based on the average distance of each feature to its nearest neighbor feature
-
High/low clustering—Measures the degree of clustering for either high or low values using the Getis-Ord General G statistic
-
Incremental spatial autocorrelation—Measures spatial autocorrelation for a range of distances and optionally produces a line plot of these distances and their corresponding z-values. Z-values reflect the intensity of spatial clustering, and statistically significant peak z-values indicate distances where spatial processes that promote clustering are most pronounced. These peak distances are often appropriate values for tools with a distance band or distance radius parameter.
-
Multi-distance spatial cluster analysis (Ripley’s k-function)—Determines whether features or the values associated with features exhibit statistically significant clustering or dispersion over a range of distances.
-
Spatial autocorrelation—Measures spatial autocorrelation based on feature locations and attribute values using Global Moran’s I-statistic.
2.1.2 Texture analysis using granulometry
Granulometry was introduced by Haas et al. (1967) for binary images. This was later extended to grayscale images; also local granulometric analysis was introduced (Dougherty et al. 1992; Vincent 1996), allowing to analyze the neighborhood of each pixel. Granulometry is based on a series of morphological operations: opening and closing with a successively increasing size of the structuring element that determines the scope of the operation. This allows for the quantification of the occurrence of texture elements of various types and sizes. In this way, each pixel is assigned a set of values that allow analysis of the texture in this vicinity. The effectiveness of local granulometry in relation to other methods of texture analysis as a tool to support land cover/land use classification in satellite imagery has been demonstrated by Kupidura and Uwarowa (2017) and Kupidura (2019), among others.
In the research, also opening by reconstruction and closing by reconstruction have been tested. Morphological operations by reconstruction are based on geodesic reconstruction, which consist in the morphological operations of erosion and geodesic dilation (Nieniewski 2005). The application of these operations does not change the shape of the image elements that are not completely removed, unlike simple opening and closing operations. The reason for applying granulometric analysis based on operations of this type is the possibility of occurrence of younger forest areas with a regular planting distance, which may resemble orchards in texture. At the same time, these areas occur within or are directly adjacent to larger forest areas. Granulometric analysis based on operations by reconstruction should therefore, it is assumed, differentiate these two types of areas—artificial regeneration in the immediate vicinity of forest areas and orchard meadows.
2.2 Study area and data
The Milicz forest district is located in the Katowice Regional Directorate of state forests in Lower Silesia (Fig. 1). The information on habitats, species, age, and volume of the stands is summarized in Table 1.
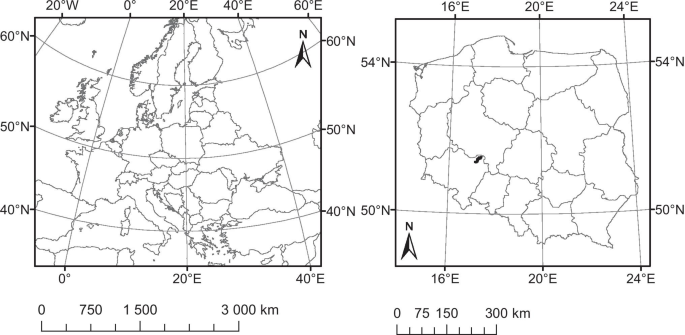
The area of investigation—the Milicz Forest management
Airborne laser scanning data (ALS) were acquired in August 2015 using a Riegl LMSQ680i laser scanning system with a pulse frequency of 360 kHz, resulting in point clouds with an average of 10 pulses/m2. The mean flight altitude was 550 m, and the field of view of the scanning system was 60 degrees. Together with the point clouds, the data provider generated a digital surface model (DSM) and a digital terrain model (DTM) with a very high spatial resolution of 0.5 m using TerraSolid software. This DTM was used to normalize all returns from the raw point clouds (Stereńczak et al., 2018). Based on the digital terrain model and the digital surface model, the canopy height model and the normalized differential surface model, respectively, were generated. Based on the point cloud from airborne laser scanning, the “Intensity Image” was generated, i.e., the image representing the average intensity of laser beam reflection for individual pixels.
Vector data representing forest divisions (in the state forests) available on the website Forest Data Bank as of 2016 (www.bdl.lasy.gov.pl) and agricultural plots (in the areas surrounding the state forests) available on LPIS Agricultural Plots Identification System as of 2016 (www.geoportal.gov.pl) were combined into a set of polygons for which the statistics for pattern and granulometry analysis will be calculated. The second set of polygons was generated based on the digital land cover model in ENVI 5.0. (https://www.l3harrisgeospatial.com/Software-Technology/ENVI) using the feature extraction extension. The value of the variable defining the number and size of polygons—0.95 was chosen by trial and error.
Based on the vegetation indices and canopy height model, a mask of forest vegetation (2 m) was also used, generated as part of the REMBIOFOR project “Remote sensing determination of wood biomass and carbon stocks in forests” (BIOSTRATEG1/267755/4/NCBR/2015), conducted at the Forest Research Institute between 2014 and 2018 (www.rembiofor.pl). A digital orthophotomap in false color representation (CIR) and the spatial resolution of 0.2 m was also used to create reference layers and as a basis for illustrations (Fig. 2).

Datasets: Ortophotomap, canopy height model, vegetation mask, digital forest map/Cadastre
2.3 Pre-processing
The general scheme of the analysis is presented in Figure 3.

Analysis scheme
The values of average nearest neighbor and Ripley’s K-function ratios were calculated for the Forest Data Bank/Cadastre and object segmentation polygons. The analysis was performed using a script written in the Python programming language in ArcGIS Pro (www.arcgis.com, ESRI corporation—www.esri.com). Points representing tree canopies higher than 2 m were generated based on the canopy height model in the software Impact Lidar (Deutscher et al., 2016).
The following datasets were used for the granulometric analysis:
-
An image representing the average intensity of reflectivity (“int”) at a resolution of 0.5 m
-
An image representing the average intensity of reflectance, clipped to the boundaries of the areas occupied by forest vegetation > 2 m (“clip”) at a resolution of 0.5 m
-
An image representing mask of forest vegetation > 2 m (“mask”) at a resolution of 0.5 m.
2.4 Layer preparation
The average nearest neighbor and K-Ripley coefficients were mapped to the Forest Data Bank/Cadastre and object segmentation polygons. The tools are available in the ArcGIS toolbox and are designed to perform the pattern analysis based on the location of points representing single trees. They are explained in the “pattern analysis” section. Raster layers were then created for further classification.
Twelve layers were created based on three datasets each for granulometric analysis in the software Blue Note 1.1.5 (https://sourceforge.net/projects/bluenote/):
-
3 granulometric maps by opening (“1–3”)
-
3 granulometric maps by closing (“4–6”)
-
3 granulometric maps by opening by reconstruction (“rec1-3”)
-
3 granulometric maps by closing by reconstruction (“rec4-6”)
The terms “opening”, “closing,” and “reconstruction” are explained in the “Texture analysis using granulometry” section. In total, 36 layers were generated. The selection was determined by the diversity of the products of the granulometric analysis. For the polygons Forest Data Bank/Cadastre and object segmentation, the average pixel values were calculated from the layers representing the results of the granulometric analysis. The mean values of average nearest neighbor, the K-Ripley coefficient, and 36 layers resulting from the granulometric processing described in this section were assigned to the polygons representing orchards and other lands with forest vegetation. Raster layers were created for further classification.
2.5 Layer selection
To perform a first discrimination analysis, groups of test polygons were selected from Forest Data Bank/Cadastre and object segmentation representing orchards and other areas with forest vegetation (Fig. 4).

Test polygons from the Forest Data Bank/Cadastre and the object segmentation for the discriminant analysis
The basic statistics, i.e., minimum, maximum, amplitude, mean, standard deviation, and quartiles, were calculated for these polygons and 36 layers resulting from the granulometric processing. The differences (∆) between the mean values for orchards and other lands with forest vegetation are shown in the “Results” section. Further analyses were performed on the layers for which the difference between the means was more than 30 (where 255 is the maximum value) for the polygons representing orchards and other lands with forest vegetation. The threshold was selected based on visual analysis of the results of the granulometric analysis. One layer was discarded based on the visual analysis. The results of the pattern analysis are not included here, due to different extreme values, possible to obtain (0-undefined, in case of the pattern analysis, and 0–255, in case of the granulometric analysis). However, the results of the pattern analysis were included in the subsequent processing.
2.6 Classification
Selected layers representing different combinations of pattern analysis and granulometric processing results (separately for Forest Data Bank/Cadastre and object segmentation polygons) were thresholded. In each case, we selected the best possible thresholds using the “trial and error” method. Two classes were distinguished on the resulting maps: “Orchards” and “Other areas with forest vegetation”. Selected layers representing different combinations of pattern analysis and granulometric processing results (separately for Forest Data Bank/Cadastre and object segmentation polygons) were combined into 4 separate band compositions (2 methods vs. 2 sets of polygons) and subjected to the supervised parametric classification of maximum likelihood using the 40 training polygons (twenty for each class) randomly dispersed across the study site but within the borders of Forest Data Bank/Cadastre and the object segmentation polygons representing “Orchards” and “Other areas with forest vegetation.”
2.7 Accuracy assessment
We chose a number of randomly dispersed non-orchard polygons of similar area to the orchard polygons and assessed how well we discriminated between orchards and non-orchards using a confusion matrix. We repeated the selection of non-orchards 3 times to obtain a measure of uncertainty in our results. The accuracy of the analysis carried out in this way was determined using the overall accuracy, Kappa coefficient, and commission (overestimation) and omission (underestimation) values. Overall accuracy is the amount of correctly classified pixels of total pixels of the image. Cohen’s Kappa coefficient is a statistic that is thought to be a more robust measure as it takes into account the possibility of the agreement occurring by chance. The omission and commission values represent the underestimation and overestimation of each class.
3 Results
The values of average nearest neighbor, the K-Ripley coefficient, and the mean values of 36 layers (resulting from the granulometric processing described in the previous section) were assigned to the polygons representing orchards and other lands with forest vegetation. Then, basic statistics, i.e., minimum, maximum, amplitude, mean, standard deviation, and quartiles, were calculated for these polygons. The differences (∆) between the mean values for orchards and other lands with forest vegetation are shown in Tables 2 and 3.
Further analysis was performed on the layers for which the difference between the mean values (for orchards and other areas with forest vegetation) was more than 30, both for the Forest Data Bank/Cadastre and object segmentation polygons. The threshold was chosen based on visual analysis of the results of the granulometric analysis. One of the layers (“clip _rec_close1”) was rejected, based on the visual analysis as well.
The following layers were selected for further analysis:
-
3rd band of the granulometric analysis based on closing on the image representing the average reflectance intensity—“Int_close3”.
-
3rd band of the granulometric analysis based on closing on the image representing the average reflectance intensity clipped to the borders of areas with forest vegetation—“Clip_close3”.
-
1st band of the granulometric analysis based on opening by reconstruction on the image representing the average reflectance intensity clipped to the borders of areas with forest vegetation—“Clip_rec_open1”.
-
2nd band of the granulometric analysis based on opening by reconstruction on the image representing the average reflectance intensity clipped to the borders of areas with forest vegetation—“Clip_rec_open2”.
-
1st band of granulometric analysis based on opening on an image representing a mask of tall vegetation—“Mask_open1”.
-
3rd band of granulometric analysis based on closing on an image representing a mask of tall vegetation—“Mask_close3”.
-
3rd band of granulometric analysis based on opening by reconstruction on an image representing a mask of tall vegetation—“Mask_rec_open1”.
Two classes were distinguished in the resulting images: “Orchards” and “Other tree vegetation.” In this way, two sets of layers (created on the basis of polygons from Forest Data Bank/Cadastre and object segmentation) were obtained, 7 layers each. In both cases, a composition was created from 7 selected bands and put under a supervised classification using the maximum likelihood algorithm, based on the “training points” layer. Two compositions were made out of four pattern analysis bands for the Forest Data Bank/Cadastre and the object segmentation polygons. As in the case of the resulting images, two classes were distinguished on the two obtained reference maps: “Orchards” and “Other areas with forest vegetation.”
The Kappa values of the classification based on the granulometric bands and the Forest Data Bank/Cadastre polygons varied between the 3 sets of test polygons and achieved higher values (89.2–95.3%) than the classification based on the pattern analysis bands (15.5–47.2%). The Kappa values of the classification based on the granulometric bands and the object segmentation polygons were also higher values (79.4–92.8%) than the classification based on the pattern analysis bands (43–58.7%) (Table 4). The Kappa values of the classification based on the granulometric bands achieved higher values (89.2–95.3%) for the Forest Data Bank/Cadastre polygons than the object segmentation polygons (79.4–92.8%). This may be associated with greater regularity and consistency of the areas separated in this way. However, in the case of pattern analysis composition, the trend is opposite. The values of the classification based on the pattern analysis bands achieved higher values (15.5–47.2%) for the Forest Data Bank/Cadastre polygons than the object segmentation polygons (43–58.7%). The classification performed on the composition of granulometric analysis seems to be more reliable here (Table 4).
In the accuracy analysis performed using polygons from Forest Data Bank/Cadastre and the reference map, the higher accuracy was obtained for the 1st band of the granulometric analysis based on opening by reconstruction derived from the image representing the intensity of reflectance clipped to the borders of areas with high forest vegetation (“Clip_rec_open1”; Kappa = up to 73.5%) and the 3rd band of the granulometric analysis based on closing performed on the image representing a high vegetation mask (> 2 m) (“Mask_close3”; Kappa = up to 80.6%). The indices of the granulometric maps most useful in distinguishing the two analyzed classes indicate the characteristic features of the grains of the analyzed texture (Table 5).
In the accuracy analysis performed using object segmentation polygons and the reference map, the ranking of granulometric analysis products, based on the accuracy of classification, is generally the same, as in the case of the analysis presented in Table 5. However, the results are significantly (and systematically) worse than in the previous case. Again, the highest accuracy was obtained for the 1st granulometric map based on opening by reconstruction, representing the reflectance intensity clipped to the borders of areas with high vegetation (“Clip_rec_open1”; Kappa = up to 57.4%) and the 3rd granulometric band based on closing derived from the image representing a mask of high vegetation (> 2 m) (“Mask_close3”; Kappa = up to 60.3%) (Table 6).
The same as for the classification performed based on the composition of bands, the Kappa values of the classification based on the granulometric bands achieved higher values for the Forest Data Bank/Cadastre polygons than the object segmentation polygons. Figure 5 shows the results of the classifications based on the granulometric analysis using Forest Data Bank/Cadastre and object segmentation polygons. For representative purposes, the results were compared with a fragment of a digital orthophotomap with the spatial resolution of 0.5 m representing the largest orchard clusters in the research area of Milicz. The areas representing orchards are marked with dark gray and other areas with light gray. The figures also show the boundaries between the polygons representing orchards and other areas with forest vegetation (or without it) from the reference maps created on the basis of the Forest Data Bank/Cadastre and object segmentation polygons.

The results of orchard classification based on 2 best results of granulometric analysis and the Forest Data Bank/Cadastre and the segmentation polygons
4 Discussion
Due to the nature of the structure of forests and orchards, this study uses an analysis based on morphological operations (opening and closing)—simple and by reconstruction. The rationale for the use of the reconstruction-based granulometric analysis is the possibility of sparsely planted wooded areas with an orchard-like texture in the vicinity of much denser tree stands, and these areas should be differentiated by this analysis. The extraction of orchards, vineyards, and other regularly distributed high-growing crops, performed by numerous authors, resulted in an accuracy over 90% (Tanada and Blanco, 2016; Gordon and Philipson, xxxx; Geneletti and Gorte 2003; Viau et al. 2005; Warner and Steinmaus 2005; Trias-Sanz 2006; Kumar et al. 2008; Mathews and Jensen, 2012; Fieber et al. 2013; Sicre et al. 2014; Nolan et al. 2015; Karakizi et al. 2016; Mirakhorlou et al. 2017; Roy et al. 2018), using various types of indicators, classification types, models, and other methods.
The pattern analysis resulted in relatively low and unstable accuracy which does not reflect the regularity of the granulometric analysis results. The single band thresholding results were not included, due to the inability to visually distinguish orchards and other areas with forest vegetation, even closely to the reference image. However, it turned out that satisfactory accuracy (Kappa value up to 95.3%) can also be obtained by using granulometry-based methods. The best results were obtained using the classification on the composition of selected granulometry bands. The supervised classification of the composition of bands is easier and requires less time than the selection of proper thresholds. It does not require many training polygons, just well selected. For the single bands, the best results were obtained using the thresholding on the image representing the values of the 3rd granulometry band by closing on the mask of high vegetation (“Mask_close3”) and the 1st granulometry band by opening and reconstruction on the image representing the reflectance intensity clipped to the borders of the areas with high vegetation (“Clip_rec_open1”). This is due to the relatively small size of objects—trees (opening, index 1; granulometry based on opening analyzes the amount of brighter objects in the image) and a slightly larger size of the space between them (closing, index 3; granulometry based on closing analyzes the amount of darker objects in the image), especially in the case of orchards. The texture in this respect turns out to be a distinctive feature for these two classes, allowing a relatively high (Kappa = 57.4–80.6%) classification accuracy. The results obtained for other granulometric maps are characterized by lower accuracy (with some exceptions), which proves that the two classes are more similar in this aspect of texture.
International organizations such as the FAO/UN and the UNFCCC require signatory countries to maintain and increase the area of forests and other areas with forest vegetation. The methodology proposed in this article can help distinguish forests from orchards (or other regular crops of over 2 m height) with a consistent and objective methodology. Forests play an important role in the accumulation of carbon stocks, the release of which into the atmosphere would increase the negative effects of climate change. In addition, forests are important for biodiversity, provide environmental services, and influence quality of life and health. Regular crops imitating forests (such as orchards) are able to accumulate carbon and play some role in the ecosystem as well, but nowhere near compared to natural forests. So, by using good monitoring methods regarding forest vegetation, we are not only improving this tool, but also solving many other problems that contribute to the management and protection of forest vegetation.
5 Conclusions
Granulometry has proved to be a useful tool in the classification of orchards and other areas with forest vegetation. The methods based on granulometry provided better results than the pattern analysis. The analysis based on the Forest Data Bank/Cadastre polygons provided better results than the analysis based on the segmentation polygons. Classification of orchards and other areas with forest vegetation is important in the context of reporting forest area to international organizations, forest management, and mitigating effects of climate change.
Data availability
Data are the property of the Forest Research Institute and may be shared with permission of the Director of the Forest Research Institute.
References
Aksoy S, Yalniz IZ, Tasdemir K (2012) Automatic detection and segmentation of orchards using very high-resolution imagery. IEEE Trans Geosci Remote Sens 50(8):3117–3131
Aksoy S (2010) Automatic detection of hedges and orchards using very high spatial resolution imagery
Castillo-Núñez M, Sánchez-Azofeifa A, Croitoru A, Rivard B, Calvo-Alvarado J, Dubayah RO (2011) Delineation of secondary succession mechanisms for tropical dry forests using LiDAR. Remote Sens Environ 115:2217–2231
Deutscher J, Granica K, Hirschmugi M, Wimmer A (2016) Impact LiDAR: a software package for automatic derivation of forest parameters from LiDAR data. 3rd EARSeL SIG Forestry Workshop. University of Agriculture in Krakow, Faculty of Forestry, Krakow, September 15–16, 2016, https://doi.org/10.13140/RG.2.2.11919.79522
Erfanifard Y, Rezayan F (2014) Effects of heterogeneity on spatial pattern analysis of wild pistachio trees in Zagros woodlands, Iran. The International Archives of the Photogrammetry, Remote Sensing and Spatial Information Sciences XL-2/W3, The 1st ISPRS International Conference on Geospatial Information Research, Teheran, Iran, 15–17 November 2014.
Fieber KD, Davenport IJ, Ferryman JM, Gurney RJ, Walker JP, Hacker JM (2013) Analysis of full-waveform LiDAR data for classification of an orange orchard scene. ISPRS J Photogramm Remote Sens 82:63–82
Geneletti D, Gorte BGH (2003) A method for object-oriented land cover classification combining Landsat TM data and aerial photographs. Int J Remote Sens 24(6):1273–1286
Gordon DK, Philipson WR, A texture-enhancement procedure for separating orchard from forest in Thematic Mapper data. Int J Remote Sens 7(2): 301–304.
Haapanen R, Ek AR, Bauer ME, Finley EO (2004) Delineation of forest/nonforest land use classes using nearest neighbor methods. Remote Sens Environ 89(3):265–271
Hościłło A, Mirończuk A, Lewandowska A, Gąsiorowski J (2015) Inventory of the actual forest cover of the country from the photogrammetric data base. Institute of Geodesy and Cartography.
Karakizi C, Oikonomou M, Karantzalos K (2016) Vineyard detection and vine variety discrimination from very high resolution satellite data. Remote Sensing 8:235
Kolecka N, Kozak J, Kaim D, Dobosz M, Ginzler Ch, Psomas A (2015) Mapping secondary forest succession on abandoned agricultural land with LiDAR point clouds and terrestrial photography. Remote Sensing 7:8300–8322
Komba PC, D’Eeckenbrugge CG, Borne F, Gadal S, Viennois G (2015) Developing a method to map coconut agrosystems from high-resolution satellite images. Proceedings of the 27th International Cartographic Conference, Rio de Janeiro, Brasil, 23–28 August 2015, pp, 1–14.
Kumar A, Singh KN, Lal B, Singh RD (2008) Mapping of apple orchards using remote sensing techniques in the cold desert of Himachal Pradesh. India J Indian Soc Remote Sens 36:387–392
Kunz M, Nienartowicz A, Deptuła M (2000) Teledetekcja satelitarna wtórnych lasów na gruntach porolnych na przykładzie Zaborskiego Parku Krajobrazowego. Fotointerpret Geogr 31:122–128
Kupidura P (2019) The comparison of different methods of texture analysis for their efficacy for land use classification in satellite imagery. Remote Sensing 11(10):1233
Kupidura P, Uwarowa A (2017) The comparison of GLCM and granulometry for distinction of different classes of urban area, 2017 Joint Urban Remote Sensing Event (JURSE), 2017, Institute of Electrical and Electronics Engineers, IEEE, 1–4.
Kupidura P, Osińska-Skotak K, Lesisz K, Podkowa A (2019) The efficacy analysis of determining the wooded and shrubbed area based on archival aerial imagery using texture analysis. ISPRS Int J Geo Inf 8(10):450
Mathews AJ, Jensen JLR (2012) An airborne LiDAR-based methodology for vineyard parcel detection and delineation. Int J Remote Sens 33(16):5251–5267
McRoberts RE, Gobakken T, Naesset E (2012) Post-stratified estimation of forest area and growing stock volume using lidar-based stratifications. Remote Sens Environ 125:157–166
Mirakhorlou K, Akhavan R (2017) Forest density and orchard classification in Hyrcanian forests of Iran using Landsat 8 data. J for Sci 63:355–362
Mougel B, Lelong C, Nicolas JM (2008) Classification and information extraction in very high resolution satellite images for tree crops monitoring. 28th EARSel Symposium Remote Sensing for a Changing Europe, Istanbul, Turkey, 2–7 June 2008.
Naesset E, Orka HO, Solberg S, Bollandsas OM, Hansen EH, Mauya E, Zahabu E, Malimbwi R, Chamuya N, Olsson H, Gobakken T (2016) Mapping and estimating forest area and aboveground biomass in miombo woodlands in Tanzania using data from airborne. Remote Sens Environ 175:282–300
Nolan AP, Park S, O’Connell M, Fuentes S, Ryu D, Chung H (2015) Automated detection and segmentation of vine rows using high resolution UAS imagery in a commercial vineyard. 21st International Congress on Modelling and Simulation, Gold Coast, Australia, 29 November – 4 December 2015.
Pekkarinen A, Reithmaier L, Strobl P (2009) Pan-European forest/non-forest mapping with Landsat ETM+ and CORINE Land Cover 2000 data. J Photogram Remote Sens 64:171–183
Pujar GS, Reddy PM, Reddy CS, Jha CS, Dadhwal VK (2014) Estimation of trees outside forests using IRS high resolution data by object based image analysis. ISPRS Int Arch Photogramm Remote Sens Spatial Inf Sci 8:623–629
Ranchin T, Naert B, Albuisson M, Boyer G, Astrand P (2001) An automatic method for vine detection in airborne imagery using wavelet transform and multi resolution analysis. Photogramm Eng Remote Sens 67(1):91–98
Roy S, More R, Kimothi MM, Mamatha S, Vyas SP, Ray SS (2018) Comparative analysis of object based and pixel based classification for mapping of mango orchards in Sitapur district of Uttar Pradesh. J Geomatics 12(1):1–8
Seebach LM, Strobl P, San Miguel-Ayanz J, Gallego J, Bastrup-Birk A (2011) Comparative analysis of harmonized forest area estimates for European countries. An International Journal of Forest Research 84(3):285–299
Sicre CM, Baup F, Fieuzal R (2014) Determination of the crop row orientations from Formosat-2 multi-temporal and panchromatic images. ISPRS J Photogramm Remote Sens 94:127–142
Stereńczak K, Lisańczuk M, Parkitna K, Mitelsztedt K, Mroczek P, Miścicki S (2018) The influence of number and size of sample plots on modelling growing stock volume based on airborne laser scanning. Drewno 61(201):5–22
Szostak M, Hawryło P, Piela P (2017) Using of Sentinel-2 images for automation of the forest succession detection. Euro J Remote Sens 51(1):142–149
Tanada ELM, Blanco AC (2016) Using spatial point pattern analysis as supplement for object-based image classification of tree clusters, GEOBIA 2016: Solutions and Synergies, Twente, Netherlands, 14–16 September 2016.
Thompson SD, Nelson TA, Giesbrecht I, Frazer G, Saunders SC (2016) Data-driven regionalization of forested and non-forested ecosystems in coastal British Columbia with LiDAR and RapidEye imagery. Appl Geogr 69:35–50
Trias-Sanz R (2006) Texture orientation and period estimator for discriminating between forests, orchards, vineyards, and tilled fields. IEEE Transac Geosci Remote Sens 44(10):2755–2760
Unal E, Mermer A, Dogan HM (2016) Determining major orchard (pistachio, olive, vineyard) areas in Gaziantep province using remote sensing techniques. The International Archives of the Photogrammetry. Remote Sensing and Spatial Information Sciences 34(7), ISPRS Congress, Prague, Czech Republic, 12–19 July 2016.
Ursani AA, Kpalma K, Lelong C, Ronsin J (2012) Fusion of textural and spectral information for tree crop and other agricultural cover mapping with very high resolution satellite images. IEEE J. Sel Top Appl Earth Obs Remote Sens 5:225–235
Viau AA, Jang JD, Payan V, Devost A (2005) The use of airborne LIDAR and multispectral sensors for orchard trees inventory and characterization. Information and Technology for Sustainable Fruit and Vegetable Production, FRUTIC 05, Montpellier France, 12 -16 September 2005.
Wang Z, Boesch R, Ginzler C (2008) Integration of high resolution aerial images and airborne Lidar data for forest delineation. The International Archives of the Photogrammetry, Remote Sensing and Spatial Information Sciences 37(B7), Beijing, China, 3–11 July 2008, pp. 1203–1207.
Wang Z, Boesch R, Ginzler C (2007a) Color and LiDAR data fusion: application to automatic forest boundary delineation in aerial images. Int Arch Photogramm Remote Sens Spatial Inform Sci 36(B7):1–4
Wang Z, Boesch R, Ginzler C (2007b) Aerial images and LIDAR fusion applied in forest boundary. Proceedings of the 7th WSEAS International Conference on Signal, Speech and Image Processing, Beijing, China, 15–17 September 2007.
Warner TA, Steinmaus K (2005) Spatial classification of orchards and vineyards with high spatial resolution panchromatic imagery. Photogramm Eng Remote Sens 71(2):179–187
Wężyk P, de Kok R (2005) Automatic mapping of the dynamics of forest succession on abandoned parcels in south Poland.
Acknowledgements
The data was collected for the REMBIOFOR project entitled “Remote-sensing determination of wood biomass and carbon stocks in forests” which was financially supported by the National Centre for Research and Development (Poland), under the BIOSTRATEG program (agreement no. BIOSTRATEG1/267755/4/NCBR/2015). We wish to sincerely thank the Associate Professor of the Forest Research Institute, Philosophy Doctor, Mr. Krzysztof Stereńczak for his valuable help, comments, and suggestions to improve our manuscript, as well as Mr. Patryk Waraksa for the help with Python code.
Funding
The analyses conducted in this manuscript were funded from the PhD project entitled: “Possibility of using data from airborne laser scanning to classify forest areas in the context of different forest definitions,” conducted in the Forest Research Institute in 2017–2020. The analyses used data from the REMBIOFOR project entitled “Remote sensing determination of wood biomass and carbon stocks in forests” which was financially supported by the National Centre for Research and Development (Poland), under the BIOSTRATEG program (agreement no. BIOSTRATEG1/267755/4/NCBR/2015), conducted at the Forest Research Institute in 2014–2018.
Author information
Authors and Affiliations
Corresponding author
Ethics declarations
Conflict of interest
The authors declare no competing interests.
Additional information
Handling Editor: Barry A. Gardiner
Publisher's Note
Springer Nature remains neutral with regard to jurisdictional claims in published maps and institutional affiliations.
Contribution of the co-authors
Tomasz Hycza performed the literature search, conceptual plan, analysis, writing the text, and editing. Przemysław Kupidura performed the conceptual plan, text review, and editing.
Rights and permissions
Open Access This article is licensed under a Creative Commons Attribution 4.0 International License, which permits use, sharing, adaptation, distribution and reproduction in any medium or format, as long as you give appropriate credit to the original author(s) and the source, provide a link to the Creative Commons licence, and indicate if changes were made. The images or other third party material in this article are included in the article's Creative Commons licence, unless indicated otherwise in a credit line to the material. If material is not included in the article's Creative Commons licence and your intended use is not permitted by statutory regulation or exceeds the permitted use, you will need to obtain permission directly from the copyright holder. To view a copy of this licence, visit http://creativecommons.org/licenses/by/4.0/.
About this article

Cite this article
Hycza, T., Kupidura, P. Methods for separating orchards from forest using airborne LiDAR. Annals of Forest Science 78, 101 (2021). https://doi.org/10.1007/s13595-021-01116-6
Received:
Accepted:
Published:
DOI: https://doi.org/10.1007/s13595-021-01116-6