
Abstract
Disturbance to the moving traffic, such as on-street parking and bus stop on carriageway normally called as side friction in the literature, is one of the major problems that impact the vehicular speed on urban arterials in developing countries like India. Regression model to study the mode-wise vehicular speeds using side friction and other influencing variables faces the problem of multicollinearity as there is a strong correlation between the independent variables which results in high R2 and high p values. Instead of dropping the highly correlated variables which is the conventional practice to deal with multicollinearity, we proposed an approach of taking a linear combination and ratio of independent variables. To test the applicability of the proposed approach, traffic data from five locations in Hyderabad and Vellore in India having a wide variety of geometric and traffic characteristics with one or more side frictions were collected and regression models were built. It was found that the proposed approach of taking linear combination and ratio worked very well as the models exhibited a high R2, low p values and low variance inflation factor. The regression models also forecast speeds with good and reasonable accuracy. For better understanding of the impact of side friction, the present study proposed an index called side friction index and it was found that the number of side friction elements and their impact are directly proportional. Also, the impact is not uniform across the different vehicle types. Though the present study focussed on side friction problem, the approach that we proposed in this paper to deal with multicollinearity can be applied in other fields as well.
1 Introduction and Background
Side friction refers to activities such as on-street parking, roadside encroachment which can be seen on sides of carriageway or sometimes within the carriageway that normally results in loss of effective carriageway width and thereby causes disturbance to the normal traffic flow. Besides these static activities, dynamic events like stopping of buses on the carriageway, wrong-side driving and pedestrians walking on carriageway also cause hindrance to the vehicular movement. All these side friction elements eventually result in speed reduction in vehicles, and thereby capacity and level of service (LOS) also got reduced. The situation is even worse in a heterogeneous-type of traffic condition prevailing in countries like India. Besides affecting the speed and capacity of roads, sometimes they are detrimental to safety of the pedestrians and other road users [1]. Many studies have reported the impact of side friction on speed–flow characteristics since 1980s [2,3,4,5], and they can be broadly divided into two groups. One is relating friction parameters with the speed observed at stretches where side friction elements are present [1, 3, 6,7,8,9]. Regression models were developed to quantify the relationship, and with the developed models it would be easy to predict the speed for varying levels of side friction. The second group falls in development of speed–density and speed–flow curves for with and without side friction cases. Traffic flow models like Greenshields, Greenberg, etc., were fitted, using which capacity and LOS reduction due to side friction were calculated [10,11,12,13,14]. Since the focus of the present study is on relating friction parameters with the speed through regression analysis, the studies on the same were reviewed below.
One of the earlier studies in this was by Black et al. [2], and it was concluded that the number of pedestrians, bus stops, parking manoeuvres and access drives had an effect of lowering average vehicle speeds on roads. Aronsson and Bang [6] considered bicycles, pedestrians, entries/exits from minor roads, bus stops, parked vehicles and parking manoeuvres as side friction elements and studied how average speed of the vehicles got affected through regression analysis. Chiguma [3] done an extensive study in Dar-es-salaam city in Tanzania by analysing the influence of side friction factors (independent variables) like pedestrian activity, non-motorized vehicles, parking and stopping vehicles on average speed of vehicles (dependent variable). In this study, the authors have included variables with negative correlation regardless of their significance levels as they gave importance to logical part (when side friction increases speed decreases) rather than statistical significance. Munawar [7] did regression analysis with speed as dependent variable and side friction parameters as independent variables. However, the authors did not report the R2 of the model or p values of the variables. Bansal et al. [4] analysed the impact of bus stops on the speed of other motorized vehicles in New Delhi, India, using the average speed of vehicles in influence region as an independent variable and the length of influence region as a dependent variable in regression analysis. The selection of variables raised a question that whether speed of vehicles be considered as an independent variable as normally it is the dependent variable in other studies. Also, the authors reported R2 of 0.45 which is low and indicates the model’s inability to explain much of variation in the data set. Mohan and Ramachandra [8] also reported a low R2 of 0.02–0.54 when they studied the impact of side friction on free speed of vehicles in New Delhi, India. Even though some variables like the number of friction points are not significant, still they have considered them in the study. Salini et al. [1] reported a reasonably good R2 in the range of 0.63–0.87 while studying the effect of side friction parameters and class-wise traffic flow (independent variables) on average speed of vehicles. However, the authors considered only 90% confidence level (CI) to infer about the statistical significance of coefficients through p values, and it was found that many side friction variables become insignificant when the usual 95% CI is considered. In Gulivindala and Mehar [9] study, the R2 values were not at all reported and some of the variables like frequency of pedestrians, parked vehicles and wrong movement had p values more than 0.05, but still they have been considered. The review of existing studies leads to the following gaps as explained below.
In all the studies, only average speed of vehicles in the stream was considered in regression analysis and mode-wise speed variation was not attempted. The study of impact of side friction on speeds of various vehicle categories is important especially in countries like India as each vehicle category exhibits different speed characteristics on urban roads. For example, two-wheelers normally drive much faster than other modes by utilizing the available lateral and longitudinal gaps, while the other modes (three-wheelers and four-wheelers) could not due to their larger vehicle dimensions. In most of the studies, one common thing observed is importance to statistical significance was not given that much. For example, some studies [7, 9] have not even reported the R2 and p values and only regression model was given. Even if R2 is reported, it is very less in most of the studies [4, 8]. Similarly, p values of independent variables were more than 0.05 in many cases which means that coefficient is equal to zero and it has no effect, but still the variables have been considered [8, 9]. One of the major reasons for not achieving high R2 and significant p values (< 0.05) is the presence of strong correlation among the independent variables considered. For example, in a commercial area where pedestrians are more, the roadside parking also will likely to be more and hence if we consider these two factors as side friction variables, a positive correlation may exist between them. Similarly, in a location where there is no bus bay and if buses are stopping on the carriageway with more dwell time, it will hinder the other vehicles movement behind it. In such cases, if we consider flow and dwell time as independent variables, there are high chances that they may be negatively correlated. Thus, the correlation among variables or multicollinearity is one of the major problems faced by researchers while doing regression analysis. The problem of multicollinearity violates the basic assumption of regression analysis which states that there is no perfect linear relationship between the explanatory variables. It was found that none of the studies on side friction analysis addressed this problem of multicollinearity, i.e., how to identify whether multicollinearity exists in the data set and if so, how to overcome it. Few studies in pavement engineering [15, 16], transport planning [17] and safety [18] at least checked whether multicollinearity exists or not in their data set through parameters like variance inflation factor (VIF). But majority of the studies in transportation engineering that uses multiple linear regression did not pay much attention to this multicollinearity problem. Studies in others fields like water resources engineering [19, 20], electrical engineering [21] and tourism management [22] reported various methods like ridge regression, partial least squares regression and principal component regression to overcome the multicollinearity problem. In this study, we proposed a simple method of defining new variables as a linear combination and ratio of existing independent variables, which not only remove the multicollinearity problem but also help to achieve high R2 value and significant p values. The objectives of the present research work are as follows: (1) to develop regression models to study the mode-wise vehicular speeds using side friction and other influencing variables; (2) to check for multicollinearity in the developed regression models and define new variables based on linear combination and ratio of highly correlated variables to overcome the multicollinearity effect; (3) to compare the performance of the proposed scheme of linear combination and ratio method with other methods that deal with multicollinearity like ridge regression; and (4) to quantify the effect of side friction through side friction index (SFI) and to analyse the mode-wise SFI under heterogeneous traffic conditions.
2 Study Area
Side friction is an issue found mainly in cities and major towns of India at locations where commercial activities are more. Hence, while selecting the study area, one metro-level city like Hyderabad and a major town like Vellore were taken into account in order to cover the typical characteristics of a city as well as a town. Hyderabad, the capital of Telangana and Andhra Pradesh states, is the fourth most populous city in India with a population of more than 7 million spread over an area of 650 square kilometres. Vellore on the other hand is one of the major towns in the state of Tamil Nadu and also the district headquarters with a population of around 0.5 million over 100 sq.km area. In order to cover the wide range of geometric and traffic characteristics and also the different types of side friction, three locations in Hyderabad and two locations in Vellore were considered as the study areas. All the five locations chosen were of midblocks without any influence of an intersection either upstream or downstream. Also, the traffic was medium to heavy without any jammed condition or stop and go behaviour at all the locations. The details about the study area such as the number of lanes, carriageway width, nature of side friction and mode-wise distribution of traffic at each of the locations are given in Table 1.
Mahatma Gandhi road and AS Rao Nagar road are the two busiest roads in Hyderabad as they contain shopping malls, general bazaar, cloth market and many electronic good shops. The Old Neredmet road in Hyderabad is a hub for many educational institutions, hospitals and medical shops. The Dharmaraja Kovil Street and Officer’s lane of Vellore are located in the main central business district of the town, and adjoining to it, long bazaar, wholesale market, bus stand, electronic shops and many commercial establishments could be found. Also, the well-known Christian Medical College and Hospital which attracts everyday 5000 outpatients from different parts of the country is located on the Dharmaraja Kovil Street. Thus, the locations chosen for the present study are typical commercial roads of a developing country like India where one could clearly notice all sorts of side friction activities that hinder the traffic flow. Though few locations serve as national highways, they are the main arterial roads of the city as it contains primarily the local traffic with few or negligible bypassable traffic. Thus, trucks and trailers are difficult to find and mostly the traffic comprises two-wheelers, three-wheelers and four-wheelers (passenger cars, light commercial vehicles and buses). Traffic split among the modes was quite different between Hyderabad and Vellore, especially for three-wheelers and cars (Table 1). The proportion of cars is high in Hyderabad compared to Vellore as the former is a metro city, whereas the latter is a growing major town. Contrary to cars, the three-wheelers are high in Vellore, whereas the proportion of it is less in Hyderabad. The reason for this is that around 9000 share autos (three-wheeled vehicles where normally 4 or 5 passengers will sit and share the ride) are running everyday in Vellore along the arterial roads selected for the present study. Thus, the locations chosen for the present study in Hyderabad and Vellore are having different geometric (2-lane and 3-lane roads with and without median) and traffic characteristics (wide variations in modal split) with one or more of side friction types.
3 Data Collection and Extraction
In order to collect the traffic data, video recording was carried out using handycam fitted with tripod at all the five locations. The data collection was carried out on typical working days in the months of February and March 2019 for Vellore and Hyderabad, respectively. As both the locations in Vellore were busy throughout the day, it was decided to collect the traffic data during both morning and evening peak hours. Thus, video recording was done from 8.45 to 10.30 am in morning and 4.15 to 6 pm in evening for a duration of 3 h 30 min in Vellore. For Hyderabad, data collection was done only during the evening from 6 to 7 pm as the shopping area becomes busy and attracts more people and vehicles during evening rather than morning hours. In order to check whether the reduction in speed of vehicles at study locations was due to side friction, it was decided to collect the traffic data on the same road at some other location which is free of any side friction. Hence, another camera was placed on the tripod and video recording was done during 6–7 pm on the same day to collect the traffic data for without side friction case. This traffic data collection for without side friction case was done only for Hyderabad and not for Vellore as both the roads in Vellore have some sort of side friction for the entire length of the roadway.
For data extraction, it is essential to first identify the variables that are required to develop the regression model. In the present study, for building the regression model, the dependent variable was taken as the speed of a particular category of vehicle and the independent variables are speeds of other vehicle categories, class-wise traffic flow and side friction elements. Thus, the data that are needed are flow and speeds of different vehicle categories (two-wheeler, three-wheeler and four-wheeler) and side friction elements. So, during data extraction, first the class-wise traffic flow was manually extracted for each 5-min interval by playing the recorded video. The velocity of vehicles was calculated by dividing the distance by travel times. The distance was taken as 50 m and 15 m for Vellore and Hyderabad, respectively, as side friction elements were present throughout this distance. For travel times of vehicles, the collected videos were played in the computer and travel times were manually measured using stopwatch. As the number of vehicles is generally high in Hyderabad and Vellore, it was decided to do the travel time observation only for sample of vehicles. Thus, if the class-wise traffic flow was 200, 75 and 45 for two-wheeler, three-wheeler and four-wheeler, respectively, in a given 5-min interval, then 20, 7 and 4 vehicles were considered for travel time computation as 10% sample size was adopted. Using the observed travel times and known distance, average speeds of each vehicle category in each 5-min interval were then computed. The following side friction data were extracted using the collected video at all five locations: number of parked vehicles, pedestrians (crossing and walking on carriageway), wrong movement and dwell time of buses in seconds. As like flow and speed, side friction data were also extracted for each 5-min interval. For without side friction case, only travel times were noted using the same sample size of 10% and speeds were then calculated.
4 Methodology
The methodology was divided into three sections. First the speeds of vehicles with and without side friction were analysed through statistical tests to check whether any reduction in speed is observed or not. Because if there is a reduction in speed found due to side friction, then only there will be a necessity to go further on side friction analysis and modelling. So, this analysis of vehicle speeds was discussed first. Then development of regression model with main focus on multicollinearity analysis was detailed next. How to identify the presence of multicollinearity and how to eliminate them were elaborated in that section. Prediction using the developed regression model was also attempted and validated. Finally, an index called side friction index was proposed in the last section of methodology to quantify side friction for different vehicle types under urban heterogeneous traffic conditions.
4.1 Analysis of Vehicle Speeds with and Without Side Friction
The speeds of vehicles (class-wise) with and without side friction for all the three locations of Hyderabad were first plotted and visually compared to check whether speed reduction is there or not. If there is a reduction, clearly it would be due to the presence of side friction only. Because at each location in Hyderabad, speed data were collected with and without side friction along the same stretch of roadway with similar geometric and traffic characteristics. Besides visual inspection of graphs, statistical tests were also performed to confirm the same, i.e., whether significant difference in speed is there or not between with and without side friction cases. For this, ‘t test—paired two sample for means’ was used with null hypothesis being true mean difference in speed equal to zero and alternative hypothesis not equal to zero. A total of nine tests (3 modes/location × 3 locations) were performed , and for each test, 12 pairs of speeds were used for with and without side friction cases (one speed observation for each 5 min, so 12 observations from 6 to 7 pm). The calculated t-statistic for each test was then compared with the critical value at 95% confidence level, and whether significant difference is there or not was then ascertained.
4.2 Development of Regression Model and Multicollinearity Analysis
The flow chart showing the step-by-step procedure in regression model development, multicollinearity analysis, prediction and validation is shown in Fig. 1. First, the regression models were developed separately for two-wheeler, three-wheeler and four-wheeler using the data extracted from five locations of Hyderabad and Vellore. The reason for developing mode-specific regression models is that the travel time and speed characteristics are quite different among the different modes in India. So, for the given quantity of side friction, its impact on speed of different vehicle types will be different as two-wheelers can easily manoeuvre even in the small gaps, whereas the heavy vehicles like buses cannot do. Hence, mode-wise regression models were developed as follows:
where \( y_{\text{TW}} \) is the speed of two-wheelers in km/h (dependent variable), \( y_{\text{ThW}} \) is the speed of three-wheelers in km/h (dependent variable), \( y_{\text{FW}} \) is the speed of four-wheelers in km/h (dependent variable), \( x_{\text{TW}} \) is the speed of two-wheelers in km/h, \( x_{\text{ThW}} \) is the speed of three-wheelers in km/h, \( x_{\text{FW}} \) is the speed of four-wheelers in km/h, \( x_{\text{DT}} \) is the bus stop dwell time in seconds, \( x_{\text{PV}} \) is the number of parked vehicles on carriageway in each 5-min interval, \( x_{\text{PED}} \) is the number of pedestrians crossing and walking on carriageway in each 5-min interval, \( x_{\text{WD}} \) is the number of vehicles coming in wrong direction in each 5-min interval, \( x_{{{\text{TW}}\_{\text{flow}}}} \) is the number of two-wheelers in each 5-min interval (flow), \( x_{{{\text{ThW}}\_{\text{flow}}}} \) is the number of three-wheelers in each 5-min interval (flow), and \( x_{{{\text{FW}}\_{\text{flow}}}} \) is the number of four-wheelers in each 5-min interval (flow).
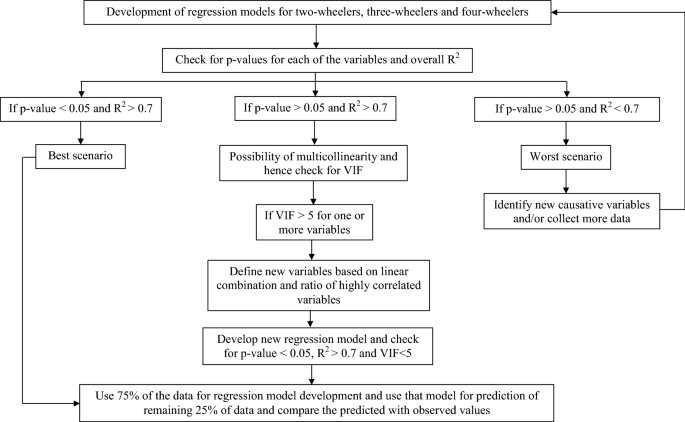
Flowchart showing the regression model development and multicollinearity analysis
As shown in Eqs. (1)–(3), nine independent variables were considered as the speed of a particular vehicle type depends on the speed of other vehicle types, class-wise traffic flow and side friction elements. A total of 1080 data points were used for building the regression model for each mode. Whenever a particular side friction is not available at a location, it was taken as zero. For example, wrong-side movement was observed only in Old Neredmet road, Hyderabad, so at other locations its value was taken as zero. Mode-specific regression models were developed rather than location specific so that the developed models could be applied in other areas as well. Once the regression models were developed, the overall model’s strength was checked through R2 value and the statistical significance of the independent variables was assessed through p values. In general, if the R2 is above 0.7, we can say that the chosen independent variables could explain 70% of the variation in the dependent variable and if the value is above 0.8 or 0.9, then the model could be considered very good as it explains well the linear relationship between the dependent and independent variables. Similarly, when the p values are less than 0.05, we can say that the independent variables are statistically significant and hence the regression model can be considered good. Thus, in the present study, if the R2 was more than 0.7 and p values are less than 0.05, then directly model validation can be done as it is the best scenario as shown in Fig. 1. During validation, 75% of the data were taken to build the regression model and remaining 25% were kept for validation. Prediction was carried out for the 25% data, and the predicted speed values were compared with the actuals using mean absolute percentage error (MAPE) to assess the model’s performance and prediction accuracy. Suppose if p values are greater than 0.05 and R2 is less than 0.7, then the scenario can be considered worst as the causative variables are not significant and could not explain the variation in the dependent variable. In such cases, one has to go back and define new variables or add more data or look for any other relationship other than linear.
There are occasions when R2 will be good with value more than 0.7, but p values of the independent variables may go above 0.05 and may turn insignificant. This is a typical situation of the presence of multicollinearity in the data, i.e., one or more of the explanatory variables are highly correlated with each other. One of the serious effects of multicollinearity is that the estimates of the regression coefficients become very imprecise, fluctuate drastically and thus raise questions on the general applicability of the estimated model [23,24,25]. Another problem with multicollinearity is poor predictions due to the lack of good estimates of the individual model parameters [25]. Sometimes, if the correlation is very high between the variables, it may give completely an indeterminate set of parameter estimates [23, 25]. Thus, multicollinearity is a major problem which needs more attention when the independent variables used are highly correlated.
The multicollinearity can be detected in many ways like the use of correlation matrix, variance inflation factor (VIF), etc., but the most popular and commonly used method is VIF. Because lack of high correlations does not guarantee the absence of multicollinearity, the correlation matrix is not often used [26]. VIF is given by
where \( R_{j}^{2} \) is the coefficient of determination resulting from regressing \( x_{j} \) (independent variable) on the other \( k - 1 \) regressor (independent) variables. If there is no correlation of \( x_{j} \) with other variables, then \( R_{j}^{2} \) will be zero and so VIF will be one. If VIF exceeds one, then that indicates some degree of multicollinearity. For example, if there is a strong correlation between \( x_{j} \) and other variables which results in \( R_{j}^{2} \) of 0.9, then VIF will be 10. Generally, it is suggested that if VIF of any independent variable goes above 5 then it indicates a serious concern and hence proper steps must be taken to overcome the multicollinearity problem [24, 25, 27]. Hence, in the present study also, VIF of 5 is taken as the boundary between the presence or absence of multicollinearity as shown in Fig. 1. If VIF is more than 5 for one or more of the independent variables, then steps must be taken to remove the multicollinearity effect. The standard practice is to drop or remove the independent variable which has VIF more than 5 and then develop the regression model. But it has certain drawbacks. For example, if we remove any variable, we are actually discarding the information contained in the deleted variable. So, in the present study, new variables were defined by taking a linear combination and ratio of highly correlated existing variables to overcome the multicollinearity problem without deleting any single variable. Thus, we are preserving the information contained in the variables as we are not deleting it, and at the same time, we are removing the multicollinearity effect. This is a trial-and-error procedure until the new regression model was obtained with p values of independent variables less than 0.05 and at the same time R2 of more than 0.7. Once this is achieved, the validation was performed by taking 75% of data for model development and 25% for prediction. The predicted values were then compared with the actuals through MAPE and R2 values.
4.3 Side Friction Index (SFI)
The quantification of side friction for different vehicle types under urban heterogeneous traffic conditions was also attempted. For this, a simple index called ‘Side friction index (SFI)’ was proposed in the present study which can be calculated using the formula given as follows:
The SFI was calculated for each vehicle type separately as speeds of them are different in urban heterogeneous traffic environment. SFI was calculated only for Hyderabad and not for Vellore. Because SFI calculation requires speeds of vehicles with and without side friction, both the roads in Vellore have some sort of side friction for the entire length of the roadway and hence speeds of vehicles without side friction could not be calculated. Thus, SFI was not attempted for Vellore. The SFI was calculated for each 5-min interval using the average speeds with and without side friction in Eq. (5). The SFI value will always be less than one as it is obvious that speeds of vehicles will be comparatively less when they pass through the section where side friction elements are present. SFI values close to 1 indicate the lesser impact on speeds of vehicles, whereas the more the deviation from 1 the higher the impact. A value of 0.5 means the speeds of vehicles are reduced by 50% due to side friction. Though SFI looks simple, it will give a fair idea about the impact of side friction on speeds of different categories of vehicles on different study stretches.
5 Results and Discussion
The results of the study were presented in the same order of methodology, i.e., the results of t test are presented first followed by the regression model development and multicollinearity analysis. Finally, the results of SFI were discussed. The descriptive statistics of the data collected were provided below before the t test results are presented.
5.1 Descriptive Statistics
Table 2 shows the location-wise descriptive statistics like mean, standard deviation, minimum and maximum for the flow, speed and side friction data extracted for 5-min intervals from the video data collected. It can be seen that the average speed of vehicles was less in the range of 6–35 kmph due to various side friction activities like on-street parking, pedestrian movement, bus stop dwell time and wrong-side movement. The mean speed of vehicles in Hyderabad was very less and in the range of only 6–16 kmph when compared to that of Vellore, where it ranges between 12 and 35 kmph. Possible reason for this is Hyderabad is a metropolitan city with more number of vehicles and has more side friction elements also when compared to that of Vellore. Among the three vehicle types, two-wheeler’s speed is more when compared to the other two. This is logical because two-wheelers normally tend to move by utilizing even the small lateral and longitudinal gaps between the vehicles, whereas its quite difficult for three- and four-wheelers. From Table 2, it can be seen that average bus dwell time was 73 s in Vellore, whereas it is less in the range of 16–18 s in Hyderabad. The Christian Medical College and Hospital in Vellore, one of the largest hospitals in the country, is located adjacent to the bus stop, and hence the dwell time of buses was more as more people were boarding and alighting the buses. The wrong movement data reveal a shocking fact that on an average two vehicles per minute were driving wrong side, and this will not only reduce the speeds of other vehicles but also lead to safety issues.
5.2 Results of t Test for Analysis of Vehicle Speeds with and Without Side Friction
Plot of mode-wise vehicle speeds with and without side friction at three locations in Hyderabad is shown in Fig. 2. It can be seen that in all the nine graphs, the speeds with side friction are less compared to that of the without side friction case. This clearly indicates the impact of side friction on vehicle speeds irrespective of the location or vehicle type. The results of t test shown in Table 3 also confirm the same that in all the nine cases, the t-statistic is more than the t-critical value of 2.201 (two-tail). Thus, the null hypothesis of mean difference in speed equal to zero can be rejected at 95% CI. Even at 99% CI also, the t-statistic for all the nine cases as shown in Table 3 is more than the t-critical of 3.106 (two-tail). Thus, it clearly indicates that the speeds of with and without side friction are not the same. Compared to t-critical value of 2.718 for one-tailed test at 99% CI, the t-statistic values are more which clearly indicates that the speed without side friction is more than the speed with side friction.

Mode-wise vehicle speeds with and without side friction in Hyderabad
5.3 Results of Regression Model Development and Multicollinearity Analysis
The results of regression models developed for two-wheeler, three-wheeler and four-wheeler are shown in Table 4. It shows the coefficients of variables, p values, VIF and R2. From the results in Table 4, it can be seen that the R2 values were above 0.8 for all the three modes, but p values for some of the variables were more than 0.05 which means they are not significant. For example, \( x_{\text{DT}} \), \( x_{\text{PV}} \), \( x_{\text{PED}} \), \( x_{\text{WD}} \) and \( x_{{{\text{ThW}}\_{\text{flow}}}} \) are not significant in the case of two-wheelers, \( x_{\text{WD}} \), \( x_{{{\text{TW}}\_{\text{flow}}}} \), \( x_{{{\text{ThW}}\_{\text{flow}}}} \) and \( x_{{{\text{FW}}\_{\text{flow}}}} \) are not significant for three-wheelers and \( x_{\text{PV}} \), \( x_{{{\text{TW}}\_{\text{flow}}}} \) are not significant for four-wheelers. The possible reason for this situation to arise, i.e., high R2, but with many non-significant variables is the presence of multicollinearity. Hence, it was decided to check for multicollinearity through VIF and the results are given in Table 4.
It was interesting to see that the ‘speed’ variables (\( x_{\text{TW}} \), \( x_{\text{ThW}} \) and \( x_{\text{FW}} \)) exhibited a high VIF in the range of 6–12 in all the three regression models developed for different modes. Similarly, among the four side friction variables, \( x_{\text{DT}} \) and \( x_{\text{PED}} \) showed high VIF in all the three regression models. In case of variables pertaining to ‘flow’, only \( x_{{{\text{ThW}}\_{\text{flow}}}} \) was showing high VIF in the range of 8–9. Thus, the results of VIF revealed a fact that the independent variables ‘speed’, ‘flow (three-wheeler)’, ‘bus dwell time’ and ‘pedestrian crossing/walking’ are highly correlated with each other. It is logical that when bus dwell time and/or pedestrian activity is more, it will hinder the movement of vehicles and thus may affect the speed or flow of traffic. Another interesting observation from Table 4 is some variables like \( x_{\text{ThW}} \) had extremely low p values like 1.12E−06 and 2.13E−07 and also very high VIFs in the range of 11–12. This result tells us a fact that though individually the variable is considered significant, it has high correlation with other variables. So, just by seeing the p values, one should not decide whether a particular independent variable is a meaningful addition to regression model or not. It is also essential to look into the VIF and see whether multicollinearity exists or not.
The conventional practice to deal with multicollinearity is to simply drop the variables that have high VIFs and develop a new regression model. But if we do this, we may omit the variables which are sometimes really significant. For example, \( x_{\text{ThW}} \) is significant but has high VIF as explained before. So, if we remove it, we may miss the useful information associated with that variable. Hence, in the present study, a linear combination and ratio of independent variables was taken and then the regression models were developed. The results are shown in Table 5. It can be seen from Table 5 that mostly linear combination was attempted by adding or subtracting the variables and only in one case, ratio was taken by dividing the variables. This is a trial-and-error procedure which means different combinations were tried out till we achieve the desired results (high R2, low p value and low VIF). While taking linear combination and ratio, only same type of variables was considered, i.e., speed variables or side friction variables or flow variables. Finally, the regression model for two-wheeler and four-wheeler contains five independent variables and three-wheeler model contains six independent variables as seen in Table 5. All the three models exhibited a high R2 value of above 0.8 with p values of independent variables less than 0.05 for all the variables. Results in Table 5 also showed that the multicollinearity is now removed by linear combination and ratio as the VIF of all the variables is less than 5.
The last step of model validation was performed using 75% of the data with new set of independent variables (after linear combination and ratio), and the results are shown in Table 6. With 75% of the data also, the R2 was good with values above 0.8 as seen in Table 6. Similarly, the p values of independent variables were less than 0.05 and VIF also was less than 5 (Table 6). Using the regression model shown in Table 6, prediction for remaining 25% of data was carried out and the predicted speeds were then compared with the actuals. The results are shown in Fig. 3. It can be seen from Fig. 3 that the predicted speeds were closely following the observed values and this shows the better performance of the developed model in predicting mode-wise speeds using side friction and other variables. The MAPE between observed and predicted values was calculated as 15.42%, 29.23% and 12.37% for two-wheeler, three-wheeler and four-wheeler, respectively. In general, a MAPE of less than 10 can be considered as highly accurate prediction, 10–20 range can be considered good, 20–50 range is reasonable and greater than 50 is inaccurate and not acceptable [28,29,30]. From the MAPE values obtained, it can be said that the results are good for two-wheeler, four-wheeler and reasonable for three-wheeler. The R2 between observed and predicted speeds as shown in Fig. 3 also revealed the same fact that the two-wheeler and four-wheeler exhibit very high R2 of above 0.9, whereas three-wheeler R2 was 0.81 which is comparatively lower than the other two modes. The possible reason for higher MAPE and lower R2 for three-wheeler is it has slightly higher VIF in the range of 2–4 compared to other two modes (Table 6). Though the VIF of all the three modes are within the limit, still three-wheeler VIFs were slightly on the higher side when compared to two- and four-wheelers and this could be the possible reason for three-wheeler to exhibit a MAPE of 29.23. As the regression models developed in the present study yield results of good and reasonable accuracy, the same can be used for prediction of vehicle’s speeds using side friction and other influencing variables.

Predicted versus actual speeds for a two-wheeler, b three-wheeler, c four-wheeler
In order to check the model performance at some other location, video data collection was carried out at Alwal road in Hyderabad from 5 to 6.15 pm. It is a 4-lane divided carriageway with 2 lanes of 7 m wide in each direction. Flow and speed data of two-, three- and four-wheelers were extracted from the video. Pedestrian movement was the main side friction found there, and hence the number of pedestrian crossing/walking on the carriageway every 5 min was also noted down. The regression models were used to predict the speeds, and the results of predicted versus observed speeds are shown in Fig. 4. Since only pedestrian movement was there, other side frictions like parked vehicles, wrong movement and bus dwell time were taken as zero while prediction. It can be seen from Fig. 4 that the model performs well for four-wheeler and two-wheeler with MAPE of 20.25% and 11.07%, respectively. However, for three-wheeler, there is a mismatch between the predicted and actual speeds. The possible reason for this mismatch in three-wheeler is that original regression models which were used here for prediction were developed by combining the data of Vellore and Hyderabad. The modal share of three-wheelers was in the range of 20–24% in Vellore, whereas in Hyderabad, it is only 8–12%. The difference in modal shares of three-wheelers in Vellore and Hyderabad may be a reason for three-wheeler to exhibit high MAPE values. Even while validation of original regression models, three-wheeler resulted in a higher MAPE of around 29%, whereas two- and four-wheeler’s MAPE was in the range of 12–15%. Thus, the results suggest that it is not advisable to combine the data of different locations unless the modal shares are more or less same.

Predicted versus actual speeds for a two-wheeler, b three-wheeler, c four-wheeler in Alwal road of Hyderabad
One of the popular methods for dealing with multicollinearity problem is ridge regression and the present study attempted that also, and the results are presented here. In normal or ordinary least squares (OLS) regression, the regression coefficients can be found using matrix algebra as
where \( \hat{B} \), \( X \) and \( Y \) are matrix of regression coefficients, independent and dependent variable, respectively. In ridge regression, a penalty parameter \( k \) is added to the diagonal elements of \( X^{\text{T}} X \) as shown as follows:
where \( I \) is the identity matrix. The reason for introducing \( k \) is it will break up the dependency between independent variables in order to remove the multicollinearity effect and also it will penalize the regression coefficients to become close to zero instead of removing them from the model. If \( k \) is zero, the model becomes OLS regression, whereas if \( k \) is ∞, the \( \hat{B}_{\text{Ridge}} \) will become zero. Normally, the \( k \) value will be less than 0.3 [31]. The optimum value of \( k \) can be found by looking into the VIF values for various \( k \) values. In the present study, NCSS 2020 statistical software was used to perform ridge regression with default \( k \) values ranging from 0.0000001 to 1. The result of \( k \) versus variance inflation factor (VIF) and similarly \( k \) versus R2 for four-wheeler is shown in Fig. 5. VIF in Fig. 5a represents the maximum VIF of an independent variable. It can be seen that when \( k \) in increasing, the VIF starts decreasing and finally it reaches zero. Normally, if VIF is less than 5, it indicates no multicollinearity. So, based on \( k \) versus VIF plot, the optimum value of \( k \) can be taken as 0.04 as VIF was less than 5 when \( k \) is 0.04. It is not advisable to go beyond 0.04 because R2 will start decreasing when \( k \) is increased beyond 0.04 as shown in Fig. 5b. Thus, by taking optimum \( k \) as 0.04 for four-wheeler, the ridge regression was carried out and the results are shown in Table 7. It can be seen from Table 7 that though VIF is less than 5 and R2 is 0.89, some of the variables like \( x_{\text{PV }} \), \( x_{\text{PED}} \), \( x_{{{\text{TW}}\_{\text{flow}}}} \) become insignificant as their p values were more than 0.05. For three- and two-wheeler, based on \( k \) versus VIF plot, the optimum \( k \) was found to be 0.03 and 0.04, respectively. Results of ridge regression using these optimum \( k \) values are shown in Table 7. It can be seen that though multicollinearity has been removed, many variables become insignificant finally. For three-wheeler, 4 out of 9 variables become insignificant, and for two-wheeler, 5 out of 9 variables become insignificant. Thus, the results clearly indicate that the proposed method of ‘linear combination and ratio’ can be preferred over ridge regression, as the proposed method finally yields regression model with high R2, significant variables of p value less than 0.05 and VIF of less than 5 too.

a \( k \) versus VIF, b \( k \) versus R2
Sensitivity analysis to study the effect of side friction on speeds of four-wheelers was carried out, and the results are shown in Table 8. Compared to other vehicle types, side friction impact was more on four-wheelers, and hence it was taken into account. Four types of sensitivity analysis were carried out as explained here. In analysis 1, any one side friction was gradually increased in uniform intervals and its effect on speeds of four-wheelers was studied. For example, bus stop dwell times were increased in 30 s increments from minimum to maximum, i.e., 30, 60, 90, 120 and 150 s, and its effect on speeds of four-wheelers was studied. While doing the sensitivity analysis, speeds of two- and three-wheelers and flow of two-, three- and four-wheelers were given their mean values and other side frictions were assumed zero. In analysis 2, any two side frictions were simultaneously increased and its effect on four-wheeler’s speed was studied. Similarly, in analyses 3 and 4, three and four side frictions were simultaneously increased and its impact was examined. The results of analysis 1 in Table 8 revealed that dwell time and wrong-side driving have more impact on four-wheeler’s speed when compared to other two side frictions. Results of analysis 2 also yield similar results that when dwell time and wrong-side driving act together, the impact is more. The combination of on-street parking and pedestrian movement did not have much impact when compared to other combinations in analysis 2. Possible reason for this is when bus stops on a carriageway, the four-wheelers which came behind the bus have to wait till the bus starts because it is difficult for a four-wheeler to negotiate and go, due to less space available. Similarly, when a vehicle comes in wrong side, the four-wheelers would normally reduce their speeds and drive carefully to avoid any head-on collision. Analysis 3 also showed similar results that the impact is high when dwell time and wrong movement were combined with any other side frictions like on-street parking or pedestrian movement. When all the four side frictions act at a time and simultaneously increased, the impact is very high as the speeds of four-wheelers reduced from 15 kmph to zero. Thus, from the results of sensitivity analysis, one can get a fair idea about which side frictions have more impact on speeds of vehicles.
5.4 Results of SFI
The results of mode-wise SFI calculated for each location in Hyderabad are shown in Fig. 6. As SFI is a ratio of the speed with side friction to that of without side friction, the index will always be less than one, and the more the impact of side friction, the lesser the index value. It can be seen from Fig. 6 that at all three locations, SFI was less than one. The lowest SFI was found to be 0.17, 0.26 and 0.4 for Old Neredmet road, AS Rao Nagar road and Mahatma Gandhi road, respectively. The results were in accordance with the number of side friction elements present at each of these locations. For example, Old Neredmet road has four types of side friction elements such as bus stop, on-street parking, pedestrian movement, wrong movement and hence the impact is more which results in the lowest SFI compared to other locations. AS Rao Nagar road has only three types of side friction, namely bus stop, on-street parking, pedestrian movement, and hence the SFI is higher compared to Old Neredmet road as the impact is relatively lower. Mahatma Gandhi road has only two side frictions on-street parking and pedestrian movement, and hence the SFI was higher compared to other locations. Also, Mahatma Gandhi road has recorded a maximum SFI of 0.93, whereas it is only 0.63 for the other two locations. Thus, the SFI results suggest that the more the side friction elements at a location, the higher its impact would be which will then finally result in lower SFI values.

Mode-wise SFI for a Old Neredmet road, Hyderabad, b AS Rao Nagar road, Hyderabad, c Mahatma Gandhi road, Hyderabad
The SFI results can also be used to study the impact of side friction on each mode. For example, in Old Neredmet road, two-wheeler had higher SFI followed by three-wheeler and four-wheeler. The results thus suggest that the impact of side friction on different vehicle types is not uniform under heterogeneous traffic conditions. Different vehicle types will have different amounts of impact depending on the size of the vehicle and manoeuvrability. For example, two-wheelers can easily manoeuvre even in a small gap, whereas three- and four-wheelers cannot. One could also study the time-wise variation of side friction effect at each of the selected locations by seeing whether SFI is increasing or decreasing over time. In the present study, much variation in SFI over time is not observed though AS Rao Nagar road showed a slightly increasing trend. If the data collection extended to several hours covering both peak and off-peak traffic conditions, the time-wise variation could be seen. However, it has its own data collection and extraction constraints especially in India where the automated data collection system is in still nascent stage.
6 Concluding Remarks
Side friction is one of the major problems that not only cause loss of effective carriageway width but also affect the vehicular speed, capacity and LOS of urban arterials. One peculiar thing about side friction is it exists mostly in developing countries like India where mixed traffic exists, but how it impacts the speeds of various vehicle types was not studied before. Least importance to statistical significance was given in existing studies, and multicollinearity detection and treatment were not attempted at all on studies on side friction analysis. Not only in the side friction literature but other studies in transportation engineering that deal with regression analysis did not give much importance to this multicollinearity problem. The present study addressed all these gaps by collecting real traffic data from Vellore and Hyderabad in India having a wide variety of geometric and traffic characteristics with one or more side frictions.
The research work mainly contributes to the subject by proposing a simple and robust method of taking linear combination and ratio of independent variables to overcome the multicollinearity problem in regression analysis which is rather difficult with other popular methods like ridge regression. Because a comparison with ridge regression revealed that though multicollinearity has been removed, many variables become insignificant finally. In the proposed method, though it involves trial-and-error procedure finally one can achieve high R2, low p value and low VIF without the need for dropping any variables. Even though the present study focussed on side friction problem in transportation engineering, this linear combination and ratio method can be applied in other areas as well where multicollinearity is an issue. The present research work provides a contribution to the field of side friction analysis by advancing our understanding of how different vehicle types respond to different side friction elements through the development of mode-wise speed prediction models which has not been attempted before and also the introduction of a simple side friction index (SFI). Sensitivity analysis to find out how much speed would be reduced if one or more side friction elements were increased is another contribution of the present work, because this would help the practitioners to visualize the impact of side friction and decide upon the remedial measures like strict enforcement to restrict wrong-side vehicle movement or construction of separate bus bay for stopping of buses without disturbing the other vehicle movement.
In order to overcome the side friction problems, especially in commercial areas of cities, the following recommendations may be considered by the civic authorities and practitioners. It was found that on-street parking was a major issue in most of the places and in order to overcome it, the government may think about constructing multi-level car and two-wheeler parking system by utilizing any vacant land in commercial areas of cities. Strict enforcement should be done by traffic police to ensure no illegal parking on roads and wrong-side driving. During field visit, it was found that at many places the pedestrian footpath was not in proper condition and encroached by roadside shops. As there is no proper footpath to walk, people started walking on roads and hence disturbing the other vehicles movement. Hence, the government must take steps to ensure that proper footpath is provided as per the guidelines and should do periodic maintenance also. In places like bus stands and railway stations where the pedestrian movement is heavy, skywalk may be provided so that people from railway station or bus stand can easily reach the nearby metro station. The present study also found that buses stop on the carriageway and thus disturb the other vehicle movement. To avoid this, separate bus bays may be constructed so that the dwell time at bus stops will not affect the other vehicle movement.
Data Availability
Some or all data, models or code that support the findings of this study are available from the corresponding author S. Vasantha Kumar upon request (Excel files containing the extracted data and regression models).
References
Salini, S.; Ashalatha, R.: Analysis of traffic characteristics of urban roads under the influence of roadside frictions. Case Stud. Transp. Policy (2018). https://doi.org/10.1016/j.cstp.2018.06.008
Black, J.A.; Westerman, H.L.; Blinkhorn, L.; McKittrick, J.: Land Use Along Arterial Roads: Friction and Impact. The Environmental Planning and Management Series. School of Town Planning, University of New South Wales, Kensington (1988)
Chiguma, M.L.M.: Analysis of side friction impacts on urban road link—case study, Dar-Es-Salaam. Doctoral Thesis in Traffic and Transport Planning. Infrastructure and Planning, Royal Institute of Technology Stockholm, Sweden (2007)
Bansal, P.; Agrawal, R.; Tiwari, G.: Impacts of bus-stops on the speed of motorized vehicles under heterogeneous traffic conditions: a case-study of Delhi, India. Int. J. Transp. Sci. Technol. 3(2), 167–178 (2014)
Pal, S.; Roy, S.: Impact of side friction on performance of rural highways in India. J. Infrastruct. Syst. 25(2), 1–14 (2019)
Aronsson, K.F.M.; Bang, K.L.: Factors influencing speed profiles on urban streets. In: Proceedings of 3rd International Symposium on Highway Geometric Design, Illinois, Chicago (2005)
Munawar, A.: Speed and capacity for urban roads, Indonesian experience. Proc. Soc. Behav. Sci. 16, 382–387 (2011)
Mohan, A.; Ramachandra, K.: Free speed modeling for urban arterials—a case study on Delhi. Period. Polytech. Transp. Eng. 43(3), 111–119 (2015)
Gulivindala, P.; Mehar, A.: Analysis of side friction on urban arterials. Transp. Telecommun. 19(1), 21–30 (2018)
Dhamaniya, A.; Chandra, S.: Influence of undesignated pedestrian crossings on midblock capacity of urban roads. Transp. Res. Rec. J. Transp. Res. Board 2461, 137–144 (2014)
Rao, A.M.; Velmurugan, S.; Lakshmi, K.M.V.N.: Evaluation of influence of roadside frictions on the capacity of roads in Delhi, India. Transp. Res. Proc. 25, 4771–4782 (2017)
Pal, S.; Roy, S.: Impact of roadside friction on travel speed and LOS of rural highways in India. Transp. Dev. Econ. 2(9), 1–12 (2016)
Golakiya, H.D.; Dhamaniya, A.: Modeling speed and capacity estimation at urban midblock sections under the influence of crossing pedestrians. J. Transp. Eng. Part A Syst. 145(9), 04019036 (2019)
Patkar, M.; Dhamaniya, A.: Developing capacity reduction factors for curbside bus stops under heterogeneous traffic conditions. Arab. J. Sci. Eng. 45(5), 3921–3935 (2020)
Das, R.; Mohammad, L.N.; Elseifi, M.; Wei, C.; Cooper, S.B.J.: Development and validation of a model to predict interface bonding between pavement layers. Transp. Res. Rec. 2672(28), 22–30 (2018)
Romano, M.; Siegel, M.S.; Chan, H.Y.: Creating a predictive model for pavement deterioration using geographic weighted regression. Transp. Res. Rec. (2018). https://doi.org/10.1177/0361198118788430
Jayasinghe, A.; Sano, K.; Rattanaporn, K.: Application for developing countries: estimating trip attraction in urban zones based on centrality. J. Traffic Transp. Eng. (Engl. Ed.) 4(5), 464–476 (2017)
Shrestha, P.P.; Joseph, S.K.: Factors associated with crash severities in built-up areas along rural highways of Nevada: a case study of 11 towns. J. Traffic Transp. Eng. (Engl. Ed.) 4(1), 96–102 (2017)
Greene, S.; McElarney, Y.R.; Taylor, D.: A predictive geospatial approach for modelling phosphorus concentrations in rivers at the landscape scale. J. Hydrol. 504, 216–225 (2013)
Yoo, C.; Cho, E.: Effect of multicollinearity on the bivariate frequency analysis of annual maximum rainfall events. Water 11(5), 1–18 (2019)
Kemalbay, G.; Korkmazoglu, O.B.: Effects of multicollinearity on electricity consumption forecasting using partial least squares regression. Proc. Soc. Behav. Sci. 62, 1150–1154 (2012)
Assaf, A.G.; Tsionas, M.; Tasiopoulos, A.: Diagnosing and correcting the effects of multicollinearity: Bayesian implications of ridge regression. Tourism Manag. 71, 1–8 (2019)
Hines, W.W.; Montgomery, D.C.; Goldsman, D.M.; Borror, C.M.: Probability and Statistics in Engineering, 4th edn. Wiley, Hoboken (2003)
Levine, D.M.; Stephan, D.F.; Szabat, K.A.: Statistics for Managers Using Microsoft Excel, 8th edn. Pearson Education Limited, London (2016)
Montgomery, D.C.; Runger, G.C.: Applied Statistics and Probability for Engineers, 6th edn. Wiley, Hoboken (2016)
Freund, R.J.; Wilson, W.J.; Mohr, D.L.: Statistical Methods, 3rd edn. Academic Press, Cambridge (2010)
Freund, R.J.; Wilson, W.J.; Sa, P.: Regression Analysis: Statistical Modeling of a Response Variable, 2nd edn. Academic Press, Cambridge (2006)
Lewis, C.D.: Industrial and Business Forecasting Methods: A Practical Guide to Exponential Smoothing and Curve Fitting. Butterworth Scientific, London (1982)
Kumar, S.V.; Vanajakshi, L.: Short-term traffic flow prediction using seasonal ARIMA model with limited input data. Eur. Transp. Res. Rev. 7(21), 1–9 (2015)
Bharadwaj, N.; Kumar, P.; Arkatkar, S.; Maurya, A.; Joshi, G.: Traffic data analysis using image processing technique on Delhi–Gurgaon expressway. Curr. Sci. 110(5), 808–822 (2016)
Hintze, J.: Chapter 335 Ridge Regression. NCSS Statistical Software, Utah, USA (2020). https://ncss-wpengine.netdna-ssl.com/wp-content/themes/ncss/pdf/Procedures/NCSS/Ridge_Regression.pdf
Acknowledgements
The authors wish to thank the B.Tech Civil Engineering students of VIT, namely Pratyaksh Gupta, Beatrice Julius and Sai Thanuja, for their help during the video data collection.
Author information
Authors and Affiliations
Corresponding author
Ethics declarations
Conflict of interest
No conflict of interest reported by the authors.
Rights and permissions
OpenAccess This article is licensed under a Creative Commons Attribution 4.0 International License, which permits use, sharing, adaptation, distribution and reproduction in any medium or format, as long as you give appropriate credit to the original author(s) and the source, provide a link to the Creative Commons licence, and indicate if changes were made. The images or other third party material in this article are included in the article's Creative Commons licence, unless indicated otherwise in a credit line to the material. If material is not included in the article's Creative Commons licence and your intended use is not permitted by statutory regulation or exceeds the permitted use, you will need to obtain permission directly from the copyright holder. To view a copy of this licence, visit http://creativecommons.org/licenses/by/4.0/.
About this article

Cite this article
Singh, S.G., Kumar, S.V. Dealing with Multicollinearity Problem in Analysis of Side Friction Characteristics Under Urban Heterogeneous Traffic Conditions. Arab J Sci Eng 46, 10739–10755 (2021). https://doi.org/10.1007/s13369-020-05213-y
Received:
Accepted:
Published:
Issue Date:
DOI: https://doi.org/10.1007/s13369-020-05213-y