
Abstract
Numerous studies have highlighted the role of the proton donor characteristics of the phenol group of 17β-estradiol (E2) in its association with the estrogen receptor alpha (ERα). Since the substitutions at position C(11) have been reported to modulate this association, we hypothesized that such substitutions may modify the phenol acidity. Hence, phenol gas-phase acidity of nine C(11)-substituted E2-derivatives were evaluated using the extended Cooks’ kinetic method, which is a method widely used to determine thermochemical properties by mass spectrometry. To enhance accuracy in data collection we recorded data from several instruments, including quadrupole ion trap, triple quadrupole, and hybrid QqTOF. Indeed, we report for the first time the use of the QqTOF instrument to provide a novel means to improve data accuracy by giving access to an intermediate effective temperature range. All experimental gas-phase acidity values were supported by theoretical calculations. Our results confirmed the ability of distant substituents at C(11) to modulate the phenol acidity through electrostatic interactions, electron withdrawing inductive effects, and mesomeric effects. However, no relationship was found between the phenol gas-phase acidity of investigated steroids and their binding affinity for ERα assessed in solution. Thus, our results highlight that the intrinsic properties of the hormone do not influence sufficiently the stabilization of the hormone/ERα complex. It is more likely that such stabilization would be more related to factors depending on the environment within the binding pocket such as hydrophobic, steric as well as direct intermolecular electrostatic effects between ERα residues and the substituted steroidal estrogens.
1 Introduction
Structure-activity relationships (SAR) are of prime importance for an extended understanding of protein/ligand interactions and for drug development. In this aim, steric, hydrophobic, and electronic effects are commonly taken into account. The latter are classically quantified by the empirical Hammett and Taft equations [1–3]. Furthermore, since electronic effects are strongly influenced by the environment (e.g., solvent, dielectric constant, pH, salt, and counter-ion effects), the meaning of calculated values for ligands of interest is uncertain.
Since the 1980s, significant developments in mass spectrometry have offered the possibility to explore the intrinsic electronic properties of a molecule (i.e., without solvent) by determining its gas phase acidity or basicity values [4]. In this context, methods commonly used include (1) the ion/molecule reaction equilibrium [5], (2) the bracketing method [6], and (3) the Cooks’ kinetic method [7, 8]. The first requires sufficiently pure compounds to avoid unwanted reactions leading to formation of isomeric intermediates. The second is based on proton transfer processes from an analyte to reference compounds via a one-step process which should be characterized by negligible entropy variations. The Cooks’ kinetic method [7–13] is not subjected to such limitations of the other two techniques, although several statements are assumed (see next section). Therefore, this approach is widely used to establish the gas-phase acidity or the gas-phase basicity of a large variety of compounds (e.g., amino acids [14, 15], alcohols [12, 16], substituted phenols [17], and nucleosides [18]). Thus, the Cooks’ kinetic method seems particularly appropriate for the determination of intrinsic electronic effects relevant to a ligand in the context of the SAR investigations performed on biologically active compounds bearing an acidic group.
Amongst molecules sharing acidic pharmacophores, steroidal estrogens for which the acidic phenolic hydroxyl is essential for biological activity appear appropriate to conduct such a study. Accordingly, we investigated recently the stereochemistry influence of substituents at the position C(11) of the 17β-estradiol hormone (E2) on its gas phase acidity (ΔH°acid) [19]. This work was carried out with the 11α-OH-17β-estradiol (7α) and 11β-OH-17β-estradiol (7β) epimers (Table 1) and showed significant variation of acidity between the two stereoisomers (28 kJ mol–1). Remarkably, the OH group at C(11)β plays a key role in the phenol gas phase acidity of the steroid whereas no significant effect was detected with its C(11)α homolog. We assumed that the stereochemistry of 11β substituents modify phenol gas phase acidity through intramolecular electronic mechanisms and more specifically because the hydroxylic proton at C(11)β is neighbor to the aromatic ring π-orbital cloud. It should be noted that similar acidity values were recorded for the 17β-hydroxy (1) and 17-desoxy (2) derivatives, which suggested that the presence of an OH group at C(17) failed to significantly influence the gas phase acidity of the investigated steroids.
Based on those results, we investigated a wider series of 11β-substituted estradiol derivatives (Table 1) to provide a better understanding of the electronic effects responsible for phenol gas phase acidity variations. Relative gas phase acidity values associated with various steroidal estrogens sharing a methyl (3), an ethinyl (4), a chloromethyl (5), or an acetate (6) at the 11β position, or a 9–11 double bond (8) were determined. The ΔΗ°acid values were evaluated by tandem mass spectrometry following the extended Cooks’ kinetic method [7, 8, 20] and by using two complementary instruments (i.e., quadrupole ion trap and triple quadrupole mass spectrometers) to improve the estimation of the ΔΗ°acid value [21]. In addition, our study demonstrated the advantage of using a hybrid QqTOF mass spectrometer as a complementary technique. Resulting experimental values were compared to those obtained by a theoretical approach. Since substitutions at position C(11) are known to modulate the anchorage of E2 within the ligand binding pocket of the estrogen receptor alpha (ERα) (Figure 1), we explored whether the intrinsic electronic effects associated with a substitution at C(11) may influence the binding affinity of the hormone for the receptor, and consequently its biological activity [22].

Stabilizing interactions in the human E2/ERα complex
2 Method
The relative gas phase acidity (ΔH°acid) associated with a compound is currently measured by using the Cooks’ kinetic method extended by and following mathematical treatment proposed by Armentrout (alternative method). This method consists of first determining the ki/k0 rate constant ratio associated to the competitive dissociations of a selected [A0 + Ai – H]– deprotonated heterodimer, where A0 is the analyte and Ai is a reference with a known ΔH°acid value (Scheme 1). In this extended method, the entropy difference is maintained constant (ΔΔS°acid(A0,Ai) ≈ cst) (i.e., the Ai references could be different from the A0 analyte providing that all Ai references have the same chemical function). The extended kinetic method can be rationalized by the Equation (1) where \( {\mathrm{GA}}_{{{{\mathrm{T}}_{{\mathrm{eff}}}}}}^{{\mathrm{app}}} \) is the apparent gas phase acidity (by homology to the apparent gas phase acidity, GBapp). The \( {\mathrm{GA}}_{{{{\mathrm{T}}_{{\mathrm{eff}}}}}}^{{\mathrm{app}}} \) is related to three thermochemical parameters: the gas phase acidity, the entropic effect difference and the effective temperature (Teff), as shown in the Equation (2).
- Teff :
- R:
-
Boltzmann constant ~8.31 J mol–1 K–1
- \( {\mathrm{GA}}_{{{{\mathrm{T}}_{{\mathrm{eff}}}}}}^{{\mathrm{app}}} \) :
-
Apparent gas phase acidity in kJ mol–1 [27].

Formation of heterodimers in gas phase conditions (Ai, reference; A0, analyte; ki and k0, dissociation constants)
Since we determined the relative gas phase acidity of the studied steroids using the extended kinetic method, the ΔΔS°acid(A0,Ai) value was considered constant and the ln(ki/k0) is linearly related to ΔH°acid(Ai). The slope and the x-intercept of that linear relation corresponds to −1/RTeff and\( {\mathrm{GA}}_{{{{\mathrm{T}}_{{\mathrm{eff}}}}}}^{{\mathrm{app}}} \), respectively. The extended method requires performing these experiments under variable CID conditions to provide larger relative T eff changes (i.e., fictive values reflecting the characteristics of the competitive dissociation rate constants from the selected (de)protonated dimer according to the time window related to the instrument) [24–28]. The linear dependence of \( {\mathrm{GA}}_{{{{\mathrm{T}}_{{\mathrm{eff}}}}}}^{{\mathrm{app}}} \) versus T eff (Figure 2) enables an estimation of ΔH°acid(A0) and –ΔΔS°(A0, Ai) (i.e., the y-intercept and the slope, respectively) by following the mathematical treatment of Armentrout (alternative method). Based on simulation approaches, Vekey et al. [29] proposed to increase the T eff range by using different analyzers in order to improve the accuracy of the proton affinity value. The T eff depends on specific parameters such as the excitation amplitude, the dissociation processes, the time-scale window (i.e., kinetic shift) of the mass spectrometer. Hence, the combination of the exmental results recorded from different kinds of mass spectrometers such as quadrupole ion trap (QIT) and triple quadrupole instruments presented significant advantages. All experiments reported here to measure the gas phase acidity of 11β substituted 17β-estradiol were performed with these two instruments. Complementary data were recorded using a hybrid time-of-flight (QqTOF) mass spectrometer, which is another kind of mass spectrometer, but which has never been used previously for such studies.

GAapp versus Teff plot for 11β-OAc-E2 (Compound 6). The data pairs \( {\mathrm{GA}}_{{{{\mathrm{T}}_{{\mathrm{eff}}}}}}^{{\mathrm{app}}} \) and Teff reported have been obtained by using both the ion trap (inside the circle in dotted line) and triple quadrupole instruments. (Linear extrapolation was used under the known method limitations)
3 Experimental
3.1 Chemicals and Sample Preparation
The estrogenic steroids used in this study (Table 1) were purchased from Steraloids Inc. (Newport, RI, USA) and Sigma (St. Louis, MO, USA) or were provided from the J. C. Heuson laboratory (Jules Bordet Institute, Brussels, Belgium). Methanol, triethylamine (TEA) as well as the carboxylic acid and phenol references (Table 2) were obtained from Sigma-Aldrich (Saint-Quentin Fallavier, France). All compounds were used without further purification. Steroid samples were separately dissolved in methanol, and mixed in a 1:1 ratio with the appropriate acid or phenol references (final concentrations: 70, 30, and 10 μM for gas phase acidity experiments performed on triple quadrupole, ion trap and QqTOF mass spectrometers, respectively). Each sample contained 0.2 % TEA to improve the formation of the deprotonated dimer.
3.2 Gas Phase Acidity Measurements by Mass Spectrometry
All experiments were performed with a triple quadrupole instrument (Quattro I; Micromass, Manchester, England) or an ion trap mass spectrometer (Esquire 3000; Bruker, Bremen, Germany) equipped with an ESI source operating in the negative ion mode. The gas phase acidity of Compound 6 was determined by using these instruments and a hybrid time-of-flight mass spectrometer (QSTAR Pulsar Hybrid QqTOF; Applied Biosystems, Courtaboeuf, France). CID experiments were carried out as followed:
-
(i)
triple quadrupole mass spectrometer (TQ). Argon was used as target gas (5.10–5 mBar). The laboratory frame kinetic energy was varied from 2 eV to 20 eV (by 2 eV step) and from 20 eV to 60 eV (by 5 eV step).
-
(ii)
ion trap mass spectrometer (ITMS). Helium buffer gas was used as target gas for MS/MS experiments. Resonant excitation was carried out with a low mass cutoff (LMCO) [30] equal to 20 % of the m/z value of the selected precursor ion for deprotonated heterodimers. The excitation amplitude was increased from 0.20 V p,p to 0.67 V p,p (by 0.05 V p,p step).
-
(iii)
hybrid QqTOF mass spectrometer (QqTOF). The nitrogen target gas was introduced in the collision cell maintaining low pressure (arbitrary value of 1). Collision energy (Elab) values varied from 0 V to −11 V (by 1 V step).
3.3 Theoretical Study
Calculations were performed using the Gaussian 03 software [31]. Analytic gradient methods using the density functional theory (DFT) were performed. All structures were optimized using the Becke exchange functional (B) [32] with three hybrid parameters (that consist of a combination of Slater, Hartree-Fock, and Becke exchange function with the VWN local correlation of Vosko, Wilk, and Nusair) along with the Perdew (P86) non-local correlation functional correlation [33–35]. The B3P86/6-31G* level of calculation was used to perform full optimizations [19] because it has been shown previously that this level of theory allows to be consistent with experimental results such as cationic affinities for similar compounds [36–39]. In this study, the B3P86/6-311++G** level was preferred in order to improve the description of the correlation between electrons. With the B3P86/6-311++G** level of calculation, two diffuse and two polarization functions are used and each core orbital is described using the combination of three groups of Gaussians. As will be further discussed, different structures were considered, built up and fully optimized for each compound. For all optimized structures, frequency analyses at the same theoretical level were used in order to assign them as genuine minima on the potential-energy surface (PES), in the absence of any imaginary frequency as well as to calculate zero-point energies (ZPEs).
4 Results
4.1 Mass Spectrometry Data
ΔH° acid Determination Using Ion Trap and Triple Quadrupole Mass Spectrometers For the nine substituted steroidal estrogens listed in Table 1, relative gas phase acidity values were determined on an ESI-quadrupole ion trap and ESI-triple quadrupole by using the extended kinetic method. The data were refined by the Armentrout’s alternative treatment as followed. First, the plot ln(ki/k0) versus ΔH°acid(Ai) was defined for each steroid at several collision energies. In a second stage the plot \( {\mathrm{GA}}_{{{{\mathrm{T}}_{{\mathrm{eff}}}}}}^{{\mathrm{app}}} \) versus T eff was drawn, as exemplified by Figure 2. Finally, the alternative treatment was applied on the (\( {\mathrm{GA}}_{{{{\mathrm{T}}_{{\mathrm{eff}}}}}}^{{\mathrm{app}}} \), T eff ) couples to estimate the gas phase acidity (ΔH°acid) and entropy variation difference (ΔΔS°acid) values (Table 3). To avoid underestimation of relative ion abundances, molecular mechanisms in which consecutive decomposition processes occur were also considered. The relative abundance of the ions produced through the consecutive decomposition to the acidic monomer was included in the calculations. The 4-pentenoic acid and meta-methoxy phenol used as references yielded consecutive product ions through the losses of a carbon dioxide molecule and a methyl radical respectively. Using the triple quadrupole mass spectrometer a consecutive dissociation was observed for the 11β-ClCH2-E2 (Compound 5) deprotonated species, with the production of the m/z 35 ion which is relevant to the chloride ion (Figure 3a). Due to its relatively high electronegative character, the departure of the chloride ion was favored by the delocalization of the phenoxide charge and the C-ring opening. Another second generation of product ion was observed for 11β-OAc-E2 (Compound 6) at m/z 59 resulting from the release of the acetate anion (Figure 3b). This process, also initiated by the delocalization of the phenoxide negative charge, could be relevant to the 1–2 hydride transfer from C(9) to C(11), which is a mechanism that assists the release of the acetate anion. It should be noted that these departures of chloride anion and acetate anion from 11β-ClCH2-E2 and 11β-OAc-E2 deprotonated species, respectively, was confirmed by recording a MS/MS spectrum after activation of these isolated anions in the triple quadrupole instrument (Figure S1). In contrast, the recorded low m/z consecutive fragment ions (i.e. Cl- and CH3COO–) were not detected with the quadrupole ion trap because of the low mass cut-off (LMCO) effect. Nevertheless, such consecutive fragmentations should be limited in the quadrupole ion trap since the precursor ions are exclusively activated with resonant excitation and the product ions are quickly cooled down [40].

Mechanisms of secondary product ions formation from deprotonated heterodimer containing a reference Ai and the following analyte A0 (a) 11β-ClCH2-E2 (Compound 5), (b) 11β-OAc-E2 (Compound 6)
Evaluation of relative gas phase acidities of C(11) substituted derivatives by the extended kinetic method (Table 3) allowed us to distinguish two distinct classes of compounds: the first one with gas phase acidity values close to that of 17β-estradiol (Compounds 2, 3, 4, 6, and 7α) and the second one with stronger gas phase acidity (i.e., lower ΔH°acid values) (Compounds 5, 7β, and 8) (Figure 6, Table 3).
ΔH° acid Determination Using Additional Mass Spectrometer Such as Hybrid QqTOF Instrument According to the complementary kinetic shifts observed from both quadrupole ion trap and triple quadrupole analyzers, we wondered what results could be obtained with another kind of analyzer such as a hybrid QqTOF instrument. Contrary to the quadrupole ion trap, this instrument is not limited by the detection of low m/z consecutive fragment ions. Moreover, we expected additional advantages with this instrument including (1) enhanced sensitivity and (2) completion of the T eff range. To explore these possibilities, we measured the relative gas phase acidity of the 11β-OAc-E2 (Compound 6) with an ion trap mass spectrometer (ITMS), a triple quadrupole (TQ) and a hybrid QqTOF (QqTOF). As shown in Figure 4, the T eff values obtained from the ion trap (200 K) were lower than those recorded from the triple quadrupole TQ (400 K–1,100 K) while those recorded with the hybrid QqTOF instrument (200 K–300 K) were intermediary to the data obtained from ion trap (ITMS) and triple quadrupole (TQ) mass spectrometers.

GAapp versus Teff plot for 11β-OAc-E2 (Compound 6). The data pairs \( {\mathrm{GA}}_{{{{\mathrm{T}}_{{\mathrm{eff}}}}}}^{{\mathrm{app}}} \) and Teff reported have been obtained by using ion trap, triple quadrupole and hybrid QqTOF instruments. (Linear extrapolation was used under the known method limitations)
4.2 Theoretical Calculation
It is experimentally and theoretically well established that the deprotonation occurs at the 3-position (phenol group). Thus, only this site of deprotonation was considered for our present work. In order to define precisely the conformation of the steroids studied in the experiments, a set of structures was considered by electronic density functional theory (DFT) for each substituent, and fully optimized to probe the whole potential energy surface and to determine the global minimum. In this goal, we first optimized the steroid skeleton structure as described in details in our previous investigation. Then, the conformation of the –CH2Cl (Compound 5) and the -OCOCH3 (Compound 6) substituents at the C(11) position were both characterized by free rotation around the C–C and C–O bonds. In the case of Compound 6, the OAc group can interact sterically with the hydrogen atom at C(8) and the CH3 group at C(13) and electronically with the aromatic A ring (Figure S2). These different possibilities of conformations were considered although the steroid skeleton can be considered rigid and quasi-plan (Figure S2). Thus, the theoretical ΔH°acid values obtained for the most stable substituent conformation of each compound (Table 3) allow a comparison with experimental values. All of the experimental values were in agreement with the DFT theoretical values.
4.3 Biological Data
The potential relationship between gas phase acidity of investigated steroids and their binding affinity (RBA) in solution for ERα was assessed. For the experiments, compounds were submitted to a classical [3H]E2 competition assay using a highly purified human recombinant receptor [22], which provides a measure of relative concentrations of investigated compounds and E2 (reference) able to produce 50 % decrease of [3H]E2 binding ; RBA, E2 = 100) (Table 1).
Although solution and gas phase behaviors must be compared with care, several insights can be obtained. For example, Compound 5 (11β-ClCH2-E2) was of particular interest for this SAR investigation because it displays an extremely high affinity for the receptor in solution which is enhanced at high temperature (25 °C) [41]. Strikingly, the large difference (−15 kJ mol–1) between the gas phase acidity of Compound 5 (11β-ClCH2-E2) and the endogenous hormone (E2) was relevant to electronic effects appropriate for modulating phenol gas phase acidity. Extension of this study to other C(11) substituted derivatives confirmed that some of them could reinforce significantly the gas phase acidity of the phenol group. Thus, the chemical linkage of groups/functions at C(11) of the steroidal core that are aimed to modulate the acidity of this group may influence the binding affinity of the hormone with the receptor. However, no relationship was clearly established between the gas phase acidity (Table 3, Figure 6) and the binding affinity for ERα in solution (Table 1) of investigated steroids.
5 Discussion
5.1 Advantage of Using Hybrid QqTOF Instrument to Determine the Gas Phase Acidity by Mass Spectrometry
Why T eff Values Depend on the Kinetic Shift? In these studies the relative gas phase acidity values were measured by the kinetic method using triple quadrupole or ion trap instruments. As described previously, the combination of both instruments improved the precision of gas phase acidity or proton affinity measurement by spreading out Teff range, the latter being significantly different from each of these instruments. Collision into the triple quadrupole RF-only cell yielded higher Teff values and a broader variation than those observed with the quadrupole ion trap [19, 21, 42] due to the decomposition time-window scales (τ) (related to kinetic shift) and ion population internal energy distribution (ΔavgE) see Equation (3).
-
(i)
Dissociation kinetic shift effect on T eff . The lowest accessible Teff value depends on the instrument time-window (τ). For example, the broad time-window of the ion trap allows detection of ion produced through low rate constant (Figure 5a). Such features imply a low kinetic shift (ks) (Figure 5b) corresponding to the minimum internal energy excess allowing decomposition to occur within the analyzer time-window. In the quadrupole ion trap, this allows to reach low Teff values. Note that Teff is relevant to ion species dissociating with a non-thermal internal energy distribution.
Figure 5 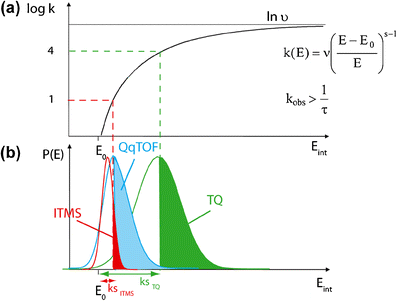
Wahrhaftig diagram: (a) Evolution of the kinetic constant rate as a function of the internal energy. (b) Distribution of the internal energy of ion populations, which decomposed in ion trap mass spectrometer (ITMS), triple quadrupole (TQ), and hybrid QqTOF. s: number of identical classical harmonic oscillators, υ: frequency factor characterizing the transition state of the reaction, E: internal energy of the studied specie before fragmentation, E0: activation energy and τ: instrumental time window for metastable ion dissociation
-
(ii)
Internal energy effect on T eff . The highest reached Teff value depends on the internal energy associated with the precursor ions. Indeed, the triple quadrupole allows to access higher collision energy because of its on-axis geometry together with the use of heavier target gas (Ar) which yield higher Teff values [43]. Conversely, the ion trap induces a cooling effect associated with the collision (involving helium and a relaxation of the ion energy resulting in a slow heating). Therefore, the ion trap yielded lower and narrower Teff range (Figure 5b).

T eff Range Using QqTOF The ions decomposing in the collision cell of the hybrid QqTOF instrument are characterized by Teff values lower than those reached in the collision cell of the triple quadrupole instrument and slightly higher than with the ion trap mass spectrometer. In principle, similar Teff values may have been expected with the quadrupole ion trap and the QqTOF instruments since the collision cell of the QqTOF instrument is considered as a linear ion trap [44]. In fact, two aspects should be considered; (i) the ion residence time in the collision cell of the QqTOF instrument (that is similar to that of the quadrupole ion trap) and (ii) the internal energy of precursor ions that is relaxed by collisional cooling. This cooling is required to reduce the ion’s kinetic energy in radial and axial directions before their analysis with the TOF. Therefore, the Teff values were almost as low as in the quadrupole ion trap (QIT). The slightly higher values of Teff with the QqTOF compared with those from the QIT could be explained by the mass difference between the target gases used (N2 compared to He in the QIT). Interestingly, the range of Teff values obtained with the QqTOF instrument was broader than that with the quadrupole ion trap and narrower than that with in the triple quadrupole (Figure 5b).
ΔH° acid Value Accuracy As shown in Figure 4, the linear dependence obtained from combination of the (\( {\mathrm{GA}}_{{{{\mathrm{T}}_{{\mathrm{eff}}}}}}^{{\mathrm{app}}} \),Teff) couples provided from the three mass spectrometers utilized in the experiments are characterized by an improved linear regression (R2 = 0.9812) than that obtained with only the use of the ion trap and triple quadrupole mass spectrometers (R2 = 0.9756). Thus, the additional points supplied by the QqTOF instrument are helpful to refine the determination of ΔH°acid and ΔΔS°acid values. Moreover, the ΔH°acid and ΔΔS°acid values obtained from \( {\mathrm{GA}}_{{{{\mathrm{T}}_{{\mathrm{eff}}}}}}^{{\mathrm{app}}} \) versus Teff plots using only the hybrid QqTOF instrument (ΔH°acid = 1441 kJ mol–1, ΔΔS°acid = −36 J mol–1 K–1) was in agreement with those recorded using ion trap and triple quadrupole mass spectrometers (ΔH°acid = 1444 kJ mol–1, ΔΔS°acid = −25 J mol–1 K–1) (Figure 4).
Thus, the hybrid QqTOF instrument appears appropriate to record Teff values intermediate to those provided from the ion trap and triple quadrupole mass spectrometers. Therefore, the hybrid QqTOF instrument is helpful to complete the effective temperature range between those obtained by ion activation from ion trap and triple quadrupole instruments.
5.2 Comparison of Experimental and Calculated Gas Phase Acidity Values
As shown in Table 3, the experimental and theoretical gas phase acidity values recorded for most steroids are in agreement within experimental uncertainties. For such theoretical studies, a basis set with high polarization functions (B3P86/6-311++G** level) was required to improve the description of the orbitals, especially for the Compound 6 (Figure S2). In the latter case, the number of possible structures is higher than for other substituents because of possible intramolecular interactions between the OAc group and the rest of the molecule. A thorough study of the potential energy surface showed that in the most stable conformer, the OAc group interacts with the hydrogen atom at C(8) and the methyl group at C(13) by assuming a free rotation of the OAc motif around the C(11)O bond (Figure S2). The theoretical ΔH°acid value obtained from this most stable conformer was consistent with the experimental value (+1 kJ mol–1) (Table 3). A good agreement, within uncertainty limits, between theoretical and experimental gas phase acidity values (differences between −7 and +2 kJ mol–1) was also obtained for other investigated steroids.
5.3 Effects of Substituents at C(11) on Gas Phase Acidity
As gas phase acidity is an intrinsic property, the gas phase acidity is not influenced by the environment (i.e., solvent, dielectric constant, salt and counter-ion effects). However, it may be strongly influenced by electronegativity, polarizability, electrostatic interactions (including dipole-dipole, charge-dipole interactions, and salt bridge) as well as steric and hyperconjugation effects [12, 16, 45–48]. To obtain a better understanding of phenol gas phase acidity modulations of our steroids, all the effects listed above were considered in our study except hyperconjugation, which could not be considered in our case because of the absence of alpha hydrogen group on the phenoxide anion.
As shown in Figure 6, our data suggested that electronegativity and polarizability did not influence significantly the gas phase acidity of the phenol (A ring) of the estrogenic steroids that we studied. The gas phase acidity variation recorded for Compounds 2 and 7α appeared not significantly different to E2 (1), although Compounds 2 and 7β differed from E2 (1) in terms of polarity properties. Thus, we can conclude that the modulation of polarity associated with the distant hydroxyl group at the position 11 is not sufficiently important to modify the phenol acidity. Likewise, the increase of polarizability induced by the ethinyl or O-acetyl substituents (Compounds 4 and 6) was not sufficiently important to reinforce significantly the gas phase acidity of these steroids. In contrast, the three Compounds 5, 7β, and 8 showed a significantly stronger gas phase acidity when compared to E2 (Compound 1). Concerning 7β, the role of the 11β-hydroxyl substituent was discussed in detail elsewhere. Our observations are that the relatively high acidity of this compound involves a stereospecific labile proton interaction with the π-orbital cloud of the aromatic ring. Otherwise, the reinforced acidity of the 11β-ClCH2-E2 (Compound 5) could be explained by electron withdrawing inductive effects that are favored by the strong electronegativity of the chlorine atom. For the 9-11-dehydro-E2 (Compound 8), the high experimental gas phase acidity is certainly due to the double bond at C(9)=C(11), which reinforces the mesomeric effects. These three phenomena contribute to stabilize the anion, thereby explaining their stronger gas phase acidity compared to that of E2 (Compound 1). To summarize, substitutions at C(11) could reinforce significantly the phenol gas phase acidity of the hormone through electronic effects such as electrostatic interactions (Compound 7β), electron withdrawing inductive effects (Compound 5) and mesomeric effect (Compound 8) (Figure 6).

Ladder of experimental relative gas phase acidity values for each steroid
5.4 Biological Data
Since we showed that substitutions at C(11) could modulate the acidic character of the phenol group of the E2 derivatives, a group of primary importance to stabilize the steroid/ERα complex in solution, we explored whether the change of gas phase acidity of this phenol (intrinsic property) could influence significantly the affinity in solution of the estrogenic steroids for ERα that is subjected to strong variations depending on the 11β substitutions. Our investigations showed an absence of a relationship between the phenol gas phase acidity (Table 3, Figure 6) and the in-solution binding affinity for ERα (Table 1) of investigated steroids. This suggests that the stability of the complex ERα/steroid in solution is mostly governed by hydrophobic and steric interactions rather than the phenol intrinsic properties.
6 Conclusion
The gas phase acidity values were estimated for several C(11)-substituted E2-derivatives by using the extended kinetic. To provide more accurate values, the data were recorded from ion trap and triple quadrupole instruments. We also demonstrated the advantage of including a hybrid QqTOF mass spectrometer in the suite of measurement techniques, with the QqTOF providing an advantage for these measurements due to its time-window appropriate to reach the intermediate effective temperature range. Strikingly, our results confirmed a modulation of the phenol acidity by distant substituents at C(11) through intramolecular electronic effects such as electrostatic interactions (Compound 7β), electron withdrawing inductive effects (Compound 5) and mesomeric effects (Compound 8).
Finally, the ability of substituents at 11β to modulate the phenolic acidity of E2 was not reflected in solution on the steroid binding affinity for ERα. This suggests that the environment of the binding pocket such as hydrophobic, steric as well as intermolecular direct electrostatic effects occurring between the hormone and ERα residues would predominate, even if intramolecular electronic effects able to influence the acidity of steroidal estrogens are indisputable. Since hydrophobic effects seemed to significantly influence the ligand/ERα complexion in solution, we may envisage studying the role induced by the phenol intrinsic properties on the stabilization of this complexion in an environment devoid of hydrophobic interactions such as the gas phase.
References
Hammett, L.P.: Some relations between reaction rates and equilibrium constants. Chem. Rev. 17, 125–136 (1935)
Hammett, L.P.: The effect of structure upon the reactions of organic compounds. Benzene derivatives. J. Am. Chem. Soc. 59, 96–103 (1937)
Taft Jr., R.W.: Separation of polar, steric, and resonance effects in reactivity. In: Newman, M.S. (ed.) Steric Effects in Organic Chemistry, pp. 556–675. John Wiley and Sons Inc., New York (1956)
Ervin, K.M.: Experimental techniques in gas-phase ion thermochemistry. Chem. Rev. 101, 391–444 (2001)
Aue, D.H., Bowers, M.T., Webb, H.M., McIver Jr., R.T.: Equilibrium constants for gas-phase ionic reactions. Accurate determination of relative proton affinities. J. Am. Chem. Soc. 93, 4314–4315 (1971)
Bouchoux, G.: Microcanonical modeling of the thermokinetic method. J. Phys. Chem. A 110, 8259–8265 (2006)
Cooks, R.G., Kruger, T.L.: Intrinsic basicity determination using metastable ions. J. Am. Chem. Soc. 99, 1279–1281 (1977)
Cheng, X.H., Wu, Z.C., Fenselau, C.: Collision energy dependence of proton-bound dimer dissociation: Entropy effects, proton affinities, and intramolecular hydrogen-bonding in protonated peptides. J. Am. Chem. Soc. 115, 4844–4848 (1993)
Wright, L.G., McLuckey, S.A., Cooks, R.G., Wood, K.V.: Relative gas-phase acidities from triple quadrupole mass spectrometers. Int. J. Mass Spectrom. Ion Phys. 42, 115–124 (1982)
Kumar, M.R., Prabhakar, S., Nagaveni, V., Vairamani, M.: Estimation of gas-phase acidities of a series of dicarboxylic acids by the kinetic method. Rapid Commun. Mass Spectrom. 19, 1053–1057 (2005)
Tand, J.P., Ren, J.: Determination of the gas-phase acidities of cysteine-polyalanine peptides using the extended kinetic method. J. Am. Soc. Mass Spectrom. 18, 188–194 (2007)
Houriet, R., Tabet, J.-C., Tchapla, A.: Gas-phase acidity of aliphatic and cyclic diols. Spectroscopy (Amsterdam, The Netherlands) 3, 132–138 (1984)
Mezzache, S., Afonso, C., Pepe, C., Karoyan, P., Fournier, F., Tabet, J.C.: Proton affinity of proline and modified prolines using the kinetic method: Role of the conformation investigated by ab initio calculations. Rapid Commun. Mass Spectrom. 17, 1626–1632 (2003)
Jones, C.M., Bernier, M., Carson, E., Colyer, K.E., Metz, R., Pawlow, A., Wischow, E.D., Webb, I., Andriole, E.J., Poutsma, J.C.: Gas-phase acidities of the 20 protein amino acids. Int. J. Mass Spectrom. 267, 54–62 (2007)
Afonso, C., Modeste, F., Breton, P., Fournier, F., Tabet, J.C.: Proton affinities of the commonly occurring L-amino acids by using electrospray ionization-ion trap mass spectrometry. Eur. J. Mass Spectrom. 6, 443–449 (2000)
Majumdar, T.K., Clairet, F., Tabet, J.C., Cooks, R.G.: Epimer distinction and structural effects on gas-phase acidities of alcohols measured using the kinetic method. J. Am. Chem. Soc. 114, 2897–2903 (1992)
Madeira, P.J.A., Costa, P.J., Fernandez, M.T., Simoes, J.A.M., Leal, J.P.: Determination of gas-phase acidities of dimethylphenols: Combined experimental and theoretical study. J. Am. Soc. Mass Spectrom. 19, 1590–1599 (2008)
Mezzache, S., Alves, S., Pepe, C., Quelquejeu, M., Fournier, F., Valery, J.M., Tabet, J.C.: Proton affinity ladder for uridine and analogs: Influence of the hydroxyl group on the sugar ring conformation. J. Mass Spectrom. 40, 722–730 (2005)
Bourgoin-Voillard, S., Zins, E.-L., Fournier, F., Jacquot, Y., Afonso, C., Pèpe, C., Leclercq, G., Tabet, J.-C.: Stereochemical effects during [M – H]– dissociations of epimeric 11-OH-17β-estradiols and distant electronical effects of substituents at C(11) position on gas phase acidity. J. Am. Soc. Mass Spectrom. 20, 2318–2333 (2009)
Armentrout, P.B.: Entropy measurements and the kinetic method: A statistically meaningful approach. J. Am. Soc. Mass Spectrom. 11, 371–379 (2000)
Mezzache, S., Bruneleau, N., Vekey, K., Afonso, C., Karoyan, P., Fournier, F., Tabet, J.C.: Improved proton affinity measurements for proline and modified prolines using triple quadrupole and ion trap mass spectrometers. J. Mass Spectrom. 40, 1300–1308 (2005)
Bourgoin-Voillard, S., Gallo, D., Laïos, I., Cleeren, A., Bali, L.E., Jacquot, Y., Nonclercq, D., Laurent, G., Tabet, J.C., Leclercq, G.: Capacity of type I and II ligands to confer to estrogen receptor alpha an appropriate conformation for the recruitment of coactivators containing a LxxLL motif-relationship with the regulation of receptor level and ERE-dependent transcription in MCF-7 cells. Biochem. Pharmacol. 79, 746–757 (2010)
Vékey, K.: Internal energy effects in mass spectrometry. J. Mass Spectrom. 31, 445–463 (1996)
Wong, P.S.H., Ma, S., Cooks, R.G.: Ionization energy determination by the kinetic method. Anal. Chem. 68, 4254–4256 (1996)
Drahos, L., Vékey, K.: How closely related are the effective and the real temperature? J. Mass Spectrom. 34, 79–84 (1999)
Ervin, K.M.: Microcanonical analysis of the kinetic method. The meaning of the “effective temperature”. Int. J. Mass Spectrom. 195/196, 271–284 (2000)
Nold, M.J., Cerda, B.A., Wesdemiotis, C.: Proton affinities of the N- and C-terminal segments arising upon the dissociation of the amide bond in protonated peptides. J. Am. Soc. Mass Spectrom. 10, 1–8 (1999)
Naban-Maillet, J., Lesage, D., Bossee, A., Gimbert, Y., Sztaray, J., Vekey, K., Tabet, J.C.: Internal energy distribution in electrospray ionization. J. Mass Spectrom. 40, 1–8 (2005)
Drahos, L., Vékey, K.: Entropy evaluation using the kinetic method: Is it feasible? J. Mass Spectrom. 38, 1025–1042 (2003)
March, R.E.: An introduction to quadrupole ion trap mass spectrometry. J. Mass Spectrom. 32, 351–369 (1997)
Frisch, M.J., Trucks, G.W., Schlegel, H.B., Scuseria, G.E., Robb, M.A., Cheeseman, J.R., Zakrzewski, V.G., Montgomery, J.A., Stratmann Jr., R.E., Burant, J.C., Dapprich, S., Millam, J.M., Daniels, A.D., Kudin, K.N., Strain, M.C., Farkas, O., Tomasi, J., Barone, V., Cossi, M., Cammi, R., Mennucci, B., Pomelli, C., Adamo, C., Clifford, S., Ochterski, J., Petersson, G.A., Ayala, P.Y., Cui, Q., Morokuma, K., Rega, N., Salvador, P., Dannenberg, J.J., Malick, D.K., Rabuck, A.D., Raghavachari, K., Foresman, J.B., Cioslowski, J., Ortiz, J.V., Baboul, A.G., Stefanov, B.B., Liu, G., Liashenko, A., Piskorz, P., Komaromi, I., Gomperts, R., Martin, R.L., Fox, D.J., Keith, T., Al-Laham, M.A., Peng, C.Y., Nanayakkara, A., Challacombe, M., Gill, P.M.W., Johnson, B., Chen, W., Wong, M.W., Andres, J.L., Gonzalez, C., Head-Gordon, M., Replogle, E.S., Pople, J.A.: Gaussian 03. Gaussian, Inc, Pittsburgh PA (2002)
Becke, A.D.: Density-functional exchange-energy approximation with correct asymptotic behavior. Phys. Rev. A 38, 3098–3100 (1988)
Perdew, J.P.: Density-functional approximation for the correlation energy of the inhomogeneous electron gas. Phys. Rev. B 33, 8822–8824 (1986)
Perdew, J.P.: Erratum: Density-functional approximation for the correlation energy of the inhomogeneous electron gas. Phys. Rev. B 34, 7406 (1986)
Ligon, A.P.: Theoretical calculations of the proton affinities of n-alkylamines, n-alkyl thiols, and n-alcohols, and the ammonium affinities of the n-alcohols. J. Phys. Chem. A 104, 8739–8743 (2000)
Brandan, S.A.: Theoretical study of the structure and vibrational spectra of chromyl perchlorate, CrO2(ClO4)2. Theochem 908, 19–25 (2009)
Zhidomirov, G.M., Larin, A.V., Trubnikov, D.N., Vercauteren, D.P.: Ion-exchanged binuclear clusters as active sites of selective oxidation over zeolites. J. Phys. Chem. C 113, 8258–8265 (2009)
Rochut, S., Pepe, C., Paumard, J.P., Tabet, J.C.: A computational and experimental study of cation affinity (Na+) of nucleobases and modified nucleobases by electrospray ionization ion trap mass spectrometry. Rapid Commun. Mass Spectrom. 18, 1686–1692 (2004)
Pepe, C., Rochut, S., Paumard, J.P., Tabet, J.C.: Ab initio calculations of proton affinities of glycine, proline, cysteine, and phenylalanine: Comparison with the experimental values obtained using an electrospray ionization ion trap mass spectrometer. Rapid Commun. Mass Spectrom. 18, 307–312 (2004)
Black, D.M., Glish, G.L.: Determination of cooling rates in a quadrupole ion trap. J. Am. Soc. Mass Spectrom. 17, 932–938 (2006)
Bindal, R.D., Carlson, K.E., Reiner, G.C.A., Katzenellenbogen, J.A.: 11-β-chloromethyl-[3H]estradiol-17-β: A very high affinity, reversible ligand for the estrogen receptor. J. Steroid. Biochem. 28, 361–370 (1987)
Gronert, S.: Estimation of effective ion temperatures in a quadrupole ion trap. J. Am. Soc. Mass Spectrom. 9, 845–848 (1998)
Shukla, A.K., Futrell, J.H.: Tandem mass spectrometry: Dissociation of ions by collisional activation. J. Mass Spectrom. 35(9), 1069–1090 (2000)
Chernushevich, I.V., Loboda, A.V., Thomson, B.A.: An introduction to quadrupole-time-of-flight mass spectrometry. J. Mass Spectrom. 36, 849–865 (2001)
Brauman, J.I., Blair, L.K.: Gas-phase acidities of alcohols. Effects of alkyl groups. J. Am. Chem. Soc. 90, 6561–6562 (1968)
Walthall, D.A., Brauman, J.I.: Vinyl hydrogen acidities of two stereoisomers. J. Phys. Chem. A 111, 1362–1367 (2007)
Exner, O., Boehm, S.: Substituent effects of the alkyl groups: Polarity versus Polarizability. Eur. J. Org. Chem. 17, 2870–2876 (2007)
DeFrees, D.J., Bartmess, J.E., Kim, J.K., McIver Jr., R.T., Hehre, W.J.: In support of anionic hyperconjugation. The versatile methyl group. J. Am. Chem. Soc. 99, 6451–6452 (1977)
Acknowledgments
The authors gratefully acknowledge the French ministry of research, CNRS, UPMC, and the Fonds Jean-Claude Heuson pour la recherche en cancérologie mammaire for financial support. The theoretical study was supported by the Academy of Sciences of the Czech Republic (Z40550506) and the European Research Council (AdG HORIZOMS). E.L.Z. acknowledges the SMART Federation and the Calculation Center CCR (from the University Pierre et Marie Curie, France) for calculations facilities. Professor Carlos Afonso acknowledges the région Haute Normandie for financial support. The authors sincerely appreciate Professor Peter B. Armentrout for giving them his program and for helpful discussion, and they also acknowledge Professor Don Martin for his assistance in editing the manuscript.
Author information
Authors and Affiliations
Corresponding author
Electronic supplementary material
Below is the link to the electronic supplementary material.
ESM 1
(PDF 370 kb)
Rights and permissions
About this article
Cite this article
Bourgoin-Voillard, S., Fournier, F., Afonso, C. et al. Electronic Effects of 11β Substituted 17β-Estradiol Derivatives and Instrumental Effects on the Relative Gas Phase Acidity. J. Am. Soc. Mass Spectrom. 23, 2167–2177 (2012). https://doi.org/10.1007/s13361-012-0486-8
Received:
Revised:
Accepted:
Published:
Issue Date:
DOI: https://doi.org/10.1007/s13361-012-0486-8