
Abstract
This paper presents an assessment of infill drilling opportunities in a complex multi-layered heterogeneous carbonate formation located in Abu Dhabi offshore. The subject field was developed last century and is currently undergoing further development with line drive horizontal wells. The field is being redeveloped for improved oil recovery at higher production rates with long horizontal wells. An infill assessment process is defined using sector model reservoir simulations for the specific reservoir. Reservoir simulations are performed on pattern sector models to establish the optimum grid for infill evaluation. Also, the models with an appropriate grid size are used to optimize infill placement (vertical and lateral well placement) and infill drilling timing for a couple of geologically similar areas. In the second step, the sector model results are applied to test the full-field infill development plan. The relatively homogeneous geological area shows very uniform displacement with 1-km spaced wells and gives no considerable benefit of incremental recovery through infill drilling. However, in a comparatively heterogeneous geological area, considerable incremental oil recovery is quantified. In brief, this paper presents a detailed infill drilling and well placement assessment process workflow for the re-development of a multi-layered heterogeneous reservoir.
Introduction
The reservoir fluid flow performance changes for both the injectors and the producers over the time with the maturity of any reservoir due to preferential depletion, formation damage, crossflow, etc., but all of these factors are subjective to the heterogeneity distribution in any specific reservoir (Aslanyan et al. 2014). Infill drilling is the most commonly adopted industry practice for several decades because most of the reservoirs around the world are not homogeneous (Driscoll 1974). The beauty of infill drilling is its application in any stage of development, especially in the mature waterflood reservoirs (Fuller et al. 1992). The factors that directly affect the incremental oil recovery through infill drilling are listed in the literature including improved areal as well as vertical sweep, areal heterogeneity, lateral formation connectivity, recovery of ‘wedge-edge’ oil, and reduced economic limit (Driscoll 1974; Gould and Munoz 1982).
The subject field to this paper is a giant carbonate oil reservoir located offshore Abu Dhabi, consisting of multiple major reservoirs overlaying each other containing under-saturated mid to high-quality oil with around 33° API. The reservoir is having weak water aquifer support; hence, it is mainly maintained through water flooding. The field covers a large area (Syed et al. 2016).
The subject sub-reservoir is being operated with a staggered line drive, and the average reservoir pressure has been maintained over decades around the same as initial reservoir pressure through proper voidage replacement through seawater injection. The recovery factor is about 7–9% and producing at ~ 0.3% annual depletion rate (ADR) of its original oil in place (OOIP) with ~ 17% average water cut (WC) (Khan et al. 2020; Syed et al. 2019). The goal of this study is to assess the infill drilling opportunities to boost the production rate of up to 1% ADR.
Prize of infill drilling
Water flooding is the most economical secondary recovery mechanism in most reservoirs where water injection is feasible. However, injected water always follows the easiest path with high permeability streaks leaving a lot of oil un-swept between the producer and the injectors (Konwar et al. 2011). In such situations, infill drilling with closer spacing is an attractive option to enhance reservoir access that accelerates oil production with more strings and at the same time; it has a chance to improve the oil recovery by increasing water swept volume. In other words, infill drilling targets un-swept oil between the wells that used to be bypassed due to heterogeneity (Aslanyan et al. 2014).
The infill drilling opportunity exists in all phases of field development including primary, secondary, and tertiary. Though determining the prize of infill drilling is not a simple task, it requires an understanding of the reservoir geology, existing field development, remaining oil saturation, and field maturity. Today, the numerical simulation is an effective way to determine the value of infill drilling or any other field development opportunity.
This paper describes a practical workflow for the infill opportunity assessment. Two 3D black oil sector models, representative of the selected geologically similar areas (GSAs) of the subject reservoir, are initially generated with the smallest optimal grid size. The models are used to study the infill completion options in different geological layers, lateral spacing at different maturity levels of each sector, and the infill timing. The selected results of the sector models are then applied in the full-field model to understand its impact on full-field oil recovery performance.
Infill assessment workflow
Infill assessment workflow is described below;
-
1.
Identification of the candidate GSA from the subject reservoir for infill applications. In this case, the GSAs are defined based on relatively uniform geological characteristics such as porosity, permeability, and saturation distribution.
-
2.
Sector models building from the candidate GSAs, representing the geological and fluid distribution characteristics of their parent GSAs.
-
3.
Grid size sensitivity analysis to determine the most appropriate grid size to provide grid insensitive recovery performance.
-
4.
Infill wells completion (i.e., vertical placement of the infills) scheme assessment. The vertical placement is driven by the need to maximize the oil rate from a producer without jeopardizing the need to maximize the vertical sweep of the waterflood.
-
5.
Lateral placement of the infills, based on the maturity and resulting aerial sweep pattern with the pre-infills history.
-
6.
Infills start timing that mainly depends on the depletion rate.
-
7.
Application of learnings from sector models to a full field model. The objective is to determine the field-wide value of infills in terms of the net recovery uplift and the plateau extension.
GSA selection for infill sector models building
Figure 1 shows the subject reservoir map subdivided into GSAs. Cumulatively, high permeability crest (HPC) and low permeability crest (LPC) regions contain more than 80% of the oil in place of the total reservoir. Thus, two sectors representing the HPC and the LPC are used for infill analysis.

Reservoir geological similar areas based on petrophysical properties distribution
Highlighted sectors in HPC and LPC areas (Fig. 1) are extracted from a history matched full field model. Both the sector models are built as 3D black oil models. Figure 2 compares the vertical flow capacity distribution with the depth of the chosen sectors and their respective parent GSAs. Solid lines in the figure represent the flow capacity distributions of the parent GSAs, while dashed lines show the same property of the selected sector models. It is clear from the following figure that both the sector models are reasonably representative of their original GSAs. However, the permeability distribution in both GSAs is very distinct from each other. HPC possesses relatively high perm streaks in the upper half of the reservoir, while the LPC area shows an even distribution of permeability versus depth.

Flow capacity variation with depth
Sector models building
Table 1 provides the specifications of both the sector models prepared as black oil 3D models with the hexagonal unstructured grid. Three horizontal wells are placed under a line drive pattern, i.e., 1 km apart with a single producer completed between 2 injectors that are completed at the model boundaries to ensure the limited influence of the adjoining producing patterns. Models are operated under controlled conditions to produce at 1% ADRs of the sector oil volume. The injectors are set to maintain target pressure up to a certain limit of water injection rate per string and not to exceed the fracture pressure.
Grid size selection for sector models analysis
Grid size sensitivity is performed on 3D sector models for 100, 50, and 25 meters hexagonal grids with 500-m well spacing cases. Simulation performance is shown in Fig. 3. The recovery appears to be insensitive for a grid size of 50 m and 25 m. The 100 m grid results show lower recovery likely due to a more diffused displacement front. Based on the comparison of simulation run time and the oil recovery performance, a 50-m grid size is considered to be appropriate and hence used to analyze the sector models’ performance.

Recovery performance comparisons for three grids
Well completion sensitivity
Several good completion schemes are tested for both the sector models by keeping producer and injectors in the upper and bottom individual layers as well as by completing the transverse wells covering 4 layers. A total of five completion schemes are simulated at the constant oil rate of 1% ADR with 1-km well spacing as shown through schematics in Fig. 4.

Wells completion schematics for vertical placement analysis
Figure 5 shows the recovery plots for all the cases suggesting that the ultimate recovery is insensitive to the tested completion schemes at 1-km spacing. However, Fig. 6 shows that water production performance is not identical. Case 2 with Lower completions shows the slowest water arrival and the least amount of total water production, whereas Case 1 with upper completions shows relatively inferior performance with the earliest WBT and higher water cut.

Base cases (1-km) recovery versus time

Base cases (1-km) WC versus cum. oil
As shown in Fig. 2, the upper half of the HPC sector contains higher permeability layers. These layers tend to dominate water movement in the upper layers causing early water breakthrough (WBT) if the producer is completed in the upper layers. Case 1 shows the earliest WBT and relatively higher Water Cut (WC) as compared to all the other cases due to the completion of both the injectors and the producer closest to high permeability streaks, whereas case 2 with bottom completion of injectors and producer shows the lower WC performance with comparatively late WBT.
Remaining oil distribution
Figures 7 and 8 show the aerial waterflood sweep performance with 1-km wells placed in the bottom layer, i.e., case 2 well completions. Both figures presents the HCPV sum by column (top view) for the sectors at 0, 20, and 40% recovery levels. (Figure 7 also represents the infill wells positioning/placement between the existing wells that will be discussed in the next section.)

HPC sector—aerial water flood with 1-km spacing

LPC sector—aerial water flood with 1-km spacing
Figures 7 and 8 show that the relatively heterogeneous HPC sector has a non-uniform water sweep, leaving a lot of oil un-swept even at the higher maturity level, i.e., 40% recovery, whereas the LPC sector shows a very uniform piston-like displacement. To investigate the vertical sweep performance, two cross sections A–A′ and B–B′ (as shown in Figs. 9 and 10) are taken from different regions of both the sectors as highlighted in Figs. 7 and 8.

HPC sector—vertical water flood sweep with 1-km spacing

LPC sector—vertical water flood sweep with 1-km spacing
As expected, cross sections of the HPC sector (Fig. 9) show poor sweep performance. It shows that the upper layers with the highest permeability get flooded much faster than the bottom layers leaving oil in the lower layers. Infill drilling can target this bypassed oil. As shown in Fig. 10, in contrast, the LPC sector shows a very uniform vertical sweep with 1-km spacing.
Infill lateral placement
It’s clear from the cross sections taken from the LPC sector (Fig. 10) that the infill is unlikely to increase oil recovery because the sector is well swept with 1-km spacing. However, an infill can increase an overall oil rate and may assist in plateau extension, whereas the HPC sector appears to be a good candidate to perform infill assessment to target remaining on as shown in Fig. 9. It is critical in the offshore field to maximize the value of the facility infrastructure by reducing the total recovery duration. Thus, infills are tested with different spacing and maturity timings for both the GSAs.
Figure 11 shows the incremental recovery of about 3% for the HPC sector with infills placed at 500, 375, and 250 meters away from the middle producer that converted to the injector at the start of infills, i.e., at 30% recovery with a single producer placed at 1 km from the injectors. We also see that the plateau is extended up to 10 years (Fig. 12), and infills placed at 375 m from the middle injector show the optimal performance. Infills with 500-m spacing are in the watered-out zone resulting in higher water cut production from the start, while Infills with 250 m spacing are away from the previously flooded region but appear to be too close to the converted injector resulting in early water WBT. As the flooded region expands with the maturity level of the specific pattern with wider spacing, lateral infill placement should be closer to the middle injector to target dry bypassed oil as much as possible.

Recovery performance with infills—HPC sector

Oil rate with infills—HPC sector
However, the LPC sector doesn’t show any considerable benefit of infills, neither in additional recovery (Fig. 13) nor in plateau extension (Fig. 14) with any of the infill completion scenario because of homogeneity of the sector that tends to flood the sector with piston-like displacement. The oil rate decline is associated with water production and in the LPC sector, and the water breakthrough is delayed significantly compared to the HPC sector.

Recovery performance with infills—LPC sector

Oil rate with infills—LPC sector
Infill start timings
Figure 15 shows that the recovery at 95% water cut is insensitive to Infill start timings. It also shows a 1-km well pattern eventually shows ultimately higher recovery than infills, but it takes a longer time than infills to reach up to the same level of water cut. Infills can be drilled to accelerate the oil production and plateau extension as well as to recovery bypassed oil due to heterogeneity between the wider-spaced producer and injectors, whereas infills are not required for improved recovery in LPC but help in oil production acceleration.

HPC sector comparing recovery with 500-m infills versus 1-km spaced patterns
Lessons Learned from infill sector model study
Following are the conclusions drawn from the sector model investigations;
-
1.
Lower well completions for both the producers and injectors tend to accelerate and increases oil recovery.
-
2.
Infills show benefit in the heterogeneous area to recover bypassed oil, to extend the plateau length, and to improve the oil recovery.
-
3.
Infills to be placed closer to the middle producer/converted injector with increasing maturity.
Full-field development
A full-field model of the subject reservoir incorporated above listed lessons from the sector model study in the following two steps:
-
Step 1 Completed all the planned wells with 1 km in the bottom layer and compared with the existing completion plan, i.e., horizontal producers completed in upper layers, while injectors completed as slant holes in all the layers from top to bottom. Figure 16 shows the benefit of lower completion with more than 3 years of plateau extension and lower water production over time as compared to another completion scheme.
Fig. 16 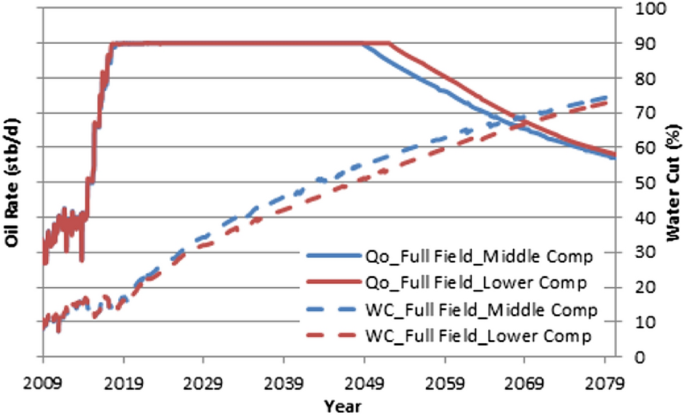
Full-field performance with 1-km spaced wells
-
Step 2 Introduced infill producers in the full field with variable spacing in between 1-km spaced wells. Variable infill spacing is chosen based on the previous flood history of the individual 1-km spaced patterns. As shown in Fig. 17, the production level is dramatically increased to reach up to 1% ADR and the plateau is maintained for more than 5 years with 26 infill producers and 13 converted injectors, whereas Fig. 18 shows water performance versus total recovery. Overall better water production is observed in early time with infills by targeting dry oil. At an increased oil production rate with infills, the water production increases once the water breaks through in the infill producers causing a higher increment in water cut compared to no infill case. The infills recover more than 5% additional oil and provide a significant acceleration of oil production (20–30 years).
Fig. 17 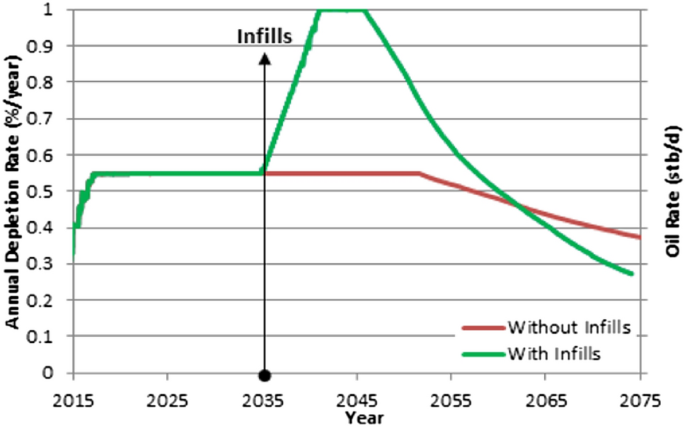
Elevated oil production performance
Fig. 18 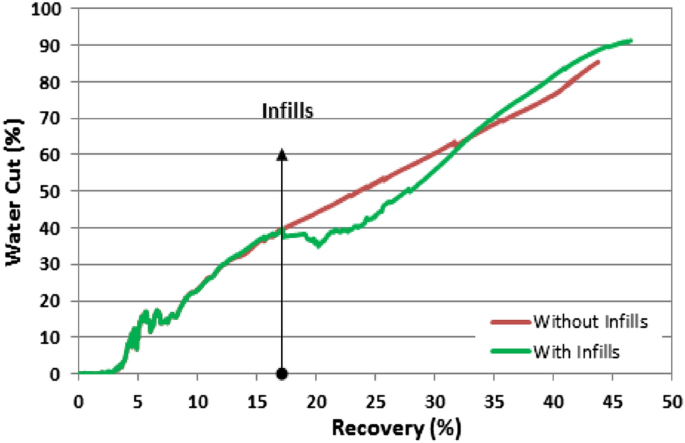
Water cut and recovery performance


Summary and conclusions
A detailed infill drilling assessment is presented in steps from the similar geological areas (GSAs) characterization, sample location identification, and selection for the sector models preparation and their validation based on the different specifications but most importantly based on the heterogeneity distribution. A complete infill drilling assessment workflow is summarized in Fig. 19.

Detailed infill drilling assessment workflow
One of the most important factors to consider for the infill drilling is aerial as well as a vertical well placement that is subjected to the heterogeneity distribution and more importantly the remaining oil saturation locally between any neighboring wells to make sure the new infill producer is not placed in the watered-out zone. In other words, the wells placement as well as the infill spacing is the function of reservoir maturity, locally. This study concludes that infills should be placed closer to the middle producer/converted injector with increasing maturity.
The subject analysis also concludes that infills provide considerable incremental oil recovery from the heterogeneous reservoir region and show no significant benefit in the homogeneous reservoir region due to more uniform sweep even without any infills. Therefore, it won’t be wise and economical to invest in infill drilling in the homogenous areas, while extensive waterflooding with a higher injection rate would be effective. In the subject reservoir, due to the presence of higher permeability streaks on the top, the injected water readily moves toward the producer; therefore, the infill well completion for both the injectors and the producers is preferred to be kept in the lower layers to delay water breakthrough as much as possible.
Abbreviations
- ADR:
-
Annual depletion rate
- GSA:
-
Geological similar area
- HCPV:
-
Hydrocarbon pore volume
- HPC:
-
High permeability crest
- LPC:
-
Low permeability crest
- OOIP:
-
Original oil in place
- WC:
-
Water cut
- WBT:
-
Water breakthrough
References
Aslanyan A, Aslanyan I, Karantharath R, Matveev S, Skutin V, Garnyshev M, Bevillon D, Mehrotra N, Suarez N (2014) Planning infill drilling and workover programmes based on reservoir-oriented production logging surveys. In: International petroleum technology conference
Driscoll VJ (1974) Recovery optimization through infill drilling concepts, analysis, and field results. In: Fall meeting of the society of petroleum engineers of AIME. Society of Petroleum Engineers
Fuller SM, Sarem AM, Gould TL (1992) Screening waterfloods for infill drilling opportunities. In: International meeting on petroleum engineering. Society of Petroleum Engineers
Gould TL, Munoz MA (1982) An analysis of infill drilling. In: SPE annual technical conference and exhibition. Society of Petroleum Engineers
Khan MJ, Muther T, Aziz H, Mubeen-ur-Rehman M (2020) Investigating the impact of injection-water salinity and well strategies on water mobility and oil production in an oil-wet reservoir. Model Earth Syst Environ. https://doi.org/10.1007/s40808-020-00934-3
Konwar LS, Tariq SM, Khan SA, Bengherbia M, Faskhoodi MM (2011) Lessons learnt from nine years of immiscible gas injection performance and sector modeling study of two pilots in a heterogeneous carbonate reservoir. In: SPE reservoir characterisation and simulation conference and exhibition. Society of Petroleum Engineers
Syed FI, Al Saadi S, Khedr O, Khan MY, Yusuf R, Thakur KK (2016) Successful application of a mechanistic coupled wellbore-reservoir dynamic simulation model to history match and plan cleanup operation of long horizontal wells. In: Abu Dhabi international petroleum exhibition and conference. Society of Petroleum Engineers
Syed FI, Boukhatem M, Al Kiyoumi AA (2019) Lean HC gas injection pilots analysis and IPR back calculation to examine the impact of asphaltene deposition on flow performance. Petrol Res 4(1):84–95
Funding
No funding was provided from any organization for this work.
Author information
Authors and Affiliations
Corresponding author
Ethics declarations
Conflict of interest
The authors declare that they have no conflict of interest.
Additional information
Publisher's note
Springer Nature remains neutral with regard to jurisdictional claims in published maps and institutional affiliations.
Rights and permissions
Open Access This article is licensed under a Creative Commons Attribution 4.0 International License, which permits use, sharing, adaptation, distribution and reproduction in any medium or format, as long as you give appropriate credit to the original author(s) and the source, provide a link to the Creative Commons licence, and indicate if changes were made. The images or other third party material in this article are included in the article's Creative Commons licence, unless indicated otherwise in a credit line to the material. If material is not included in the article's Creative Commons licence and your intended use is not permitted by statutory regulation or exceeds the permitted use, you will need to obtain permission directly from the copyright holder. To view a copy of this licence, visit http://creativecommons.org/licenses/by/4.0/.
About this article

Cite this article
Syed, F.I., Negahban, S. & Dahaghi, A.K. Infill drilling and well placement assessment for a multi-layered heterogeneous reservoir. J Petrol Explor Prod Technol 11, 901–910 (2021). https://doi.org/10.1007/s13202-020-01067-0
Received:
Accepted:
Published:
Issue Date:
DOI: https://doi.org/10.1007/s13202-020-01067-0