Abstract
The current paper evaluated experimentally an innovative sun tracking concentrated solar still under Egyptian climatic conditions during the summer of 2022. The proposed system consists of a 120-cm-diameter parabolic reflector mirror that tracks the sun using a dual axis tracking system, a cylindrical solar still with a volume of 3.7 L positioned in its focal point, and a concentration ratio of 12.5. The performance of the concentrated solar still was investigated in the context of two critical parameters. First, three feed water salinity (17, 27, 37) ppt samples were evaluated, followed by four percentages of saline water filling ratio (26.5, 39.8, 53.1, 66.3)%. Increasing the salinity of the feed water had no effect on solar still productivity, but increasing the saline water filling ratio did. The daily cumulative productivity of the system was 6 kg/m2 with an optimal filling ratio of 53.1%, a daily efficiency of 42.88%, and an average cost of freshwater production of 0.0489 $/L. The proposed system also had the highest instantaneous efficiency of 61.77% and the highest distilled water productivity rate of 0.941 kg/h m2.
Introduction
Freshwater is an important natural resource for the ecosystem's existence and continuity, yet it is in short supply. Even though water covers two-thirds of the planet and is available as sea water and ice glaciers, 97% of it is saline water and the remaining is freshwater; however, only 1% of the freshwater is easily accessible (Omara and Eltawil 2013). One of the significant challenges in rural regions is the lack of water for drinking, sanitation, agriculture, and other purposes (Bahrami et al. 2019). Desalination is the process of removing minerals, salts, and pollutants from water. The desalination process requires a significant amount of energy; however, using fossil fuel as an energy source is no longer the ideal option because of the environmental impact, as well as the limitations and excessive costs of fossil fuel (Qtaishat and Banat 2013). Renewable energy replenishes faster than depletion and is abundant, making it an alternative energy source for use in desalination and may be the sole alternative in rural regions (Renewable Energy|Department of Energy 2023). Solar, wind, biomass, and geothermal energy have been used in the desalination process. Solar energy is one of these promising and extensively utilized renewable technologies. The solar collector is a simple and low-cost technology used to concentrate energy in solar desalination processes.
Egypt is in the Earth's Sun Belt; thus, it receives a lot of sunlight, averaging 9–11 h every day. Egypt receives daily direct normal irradiance (DNI) ranging from 5.6 to 7.6 kWh/m2 (Global Solar Atlas 2023), according to the solar atlas. In addition to the abundance of saline water in Egypt from the Mediterranean and the Red Seas, which makes water desalination using solar energy is the most promising technology that warrants further exploration. There are two types of solar desalination processes: direct and indirect. Direct systems in which solar energy is converted into heat and used to evaporate the saline water in the same device such as solar still and humidification Dehumidification systems, while indirect systems are split into two subsystems: a conventional desalination unit and a solar collector (Bait 2020; Shatat and Riffat 2014; Sakthivadivel et al. 2020).
Solar concentrator collector's technologies include solar power tower, parabolic trough collector, solar parabolic dish, and Fresnel reflector (Luo et al. 2018; Fredriksson et al. 2021; Coventry and Andraka 2017; Perini et al. 2017). The parabolic dish has a single focal point and uses mirrors or other reflecting foils as reflectors. It is important to be equipped with dual axis tracking to change the azimuth and elevation angles and point directly toward the sun to achieve the greatest DNI on the solar dish concentrator (SDC) (Aliman et al. 2007). The parabolic dish concentrator outperforms other concentrators due to its ability to achieve elevated temperature ranges (Jamar et al. 2016; Chaouchi et al. 2007), and high concentration ratios (Jamar et al. 2016). It also has low thermal losses, which results in high thermal efficiency (Jamar et al. 2016; Chaouchi et al. 2007), and high optical efficiency (Tian and Zhao 2013). It can also be utilized in hybrid systems by combining it with other devices (Al-Amayreh et al. 2020).
The performance of the solar still has been investigated extensively through extensive scientific research, distinctive designs were proposed, and various parameters have been studied. These enhancements occurred on the conventional solar still since it is easy to fabricate at low cost, but their main drawback is their low productivity. Manokar et al. (2020) studied experimentally the influence of water depth on pyramid solar still. The cumulative productivity was reduced by 8.6, 27.42, and 44.09% for water depths of 2, 3, and 3.5 cm, respectively, compared to water depth of 1 cm. Rahmani et al. (2020) experimentally considered the effect of the external condenser on the performance of the solar still. The results showed that adding external condenser does not always have a positive effect, and the performance is related to the weather condition. In moderate weather it improved solar still productivity by 29%, while in excessively hot or cold weather it decreased the productivity by 16.5%. Panchal et al. (2021) demonstrated experimentally the effect of black paint mixed with graphite powder on the absorber plate on the productivity. The graphite powder increased productivity when compared to CSS by 10.5% and 17%, for a weight fraction concentration of 20% and 40%, respectively. Al-Harahsheh et al. (2022) investigated experimentally connecting solar collector and using PCM on the performance of solar still. According to the results, adding a solar collector increased productivity by 340% then adding the PCM to that system increased its productivity by another 50%.
Furthermore, to increase the productivity of the solar still it was integrated with solar concentrators. The parabolic trough, for example, is utilized to concentrate the radiation incident on its aperture area into the focal line where the receiver is mounted to absorb that concentrated heat. Elashmawy (2017, 2020, 2019) and Elashmawy and Alshammari (2020) integrated parabolic trough with solar still has improved the daily yield by 676% while reducing the CPL by 45.5%, while the spraying and concentric tubes cooling reduced the productivity by 10% and 43.8%, and the efficiency by 7.79% and 42.63%, respectively. Furthermore, the black gravel as a sensible energy storage material enhanced productivity and efficiency by 14.18% and 13.89%; finally, adding a parabolic trough to tubular solar still with desiccant enhanced productivity and efficiency by 292.4 and 82.3%, respectively, and reduced the CPL by 25%.
Moreover, for achieving higher temperature ranges and concentrator ratios the dish is utilized. Chaouchi et al. (2007) explored theoretically and experimentally combining a solar still with a 1.8 m parabolic dish concentrator attaining a concentration ratio of 195. The predicted productivity of the system was 10.4 L with an average relative error of 42% compared to the experimental. Prado et al. (2016) studied theoretically the impact of salinity on daily productivity of dish concentrator solar tracking with evaporator, and it was validated experimentally. According to results, raising the salt concentration from 0 to 4% lowered the distilled yield from 4.95 to 4.11 kg/m2.day. Other recent studies incorporating solar still with solar concentrator regarding configuration, location, methodology, absorber and concentrator areas, concentration ratio, salinity, average solar intensity, average productivity, and daily efficiency are listed in Table 1.
Previous research highlighted an urgent need for greater investment and further investigation into solar water desalination technologies. Solar still remains one of the simplest, easiest, and cheapest solar desalination devices, which is distinguished by the availability of its components locally. It is an essential choice for delivering drinkable water to humans while camping, exploration excursions, or isolated residences in remote areas or contaminated water areas. Because conventional solar stills have a poor productivity per square meter due to the considerable heat loss via the large area of the transparent surface, whether glass or plastic, numerous research has been conducted to enhance their efficiency and productivity. Since the transparent surface is the main cause of this drop in productivity, researchers began to work toward eradicating it by developing concentrated solar stills that maximize freshwater productivity by focusing radiation via parabolic concentrator's mirrors. Concentrated solar stills attempt to replace expensive metal absorber surfaces with less expensive plastic or glass concentrator surfaces. Despite being a promising technology with high applicability, there have been few studies on concentrated solar stills.
As a result, the current study intends to investigate experimentally the performance of a new sun tracking concentrated solar still in hot weather in Egypt at various feed water salinities and saline water filling ratios. The suggested system consists of 120-cm-diameter parabolic reflectors that are controlled by a dual axis solar tracking system. A 20-cm-diameter cylindrical solar still made of stainless steel and a 34-cm-diameter copper absorber are positioned at the focal point of the parabolic reflectors with a concentration ratio of 12.5. The solar still's innovative design separated the evaporator and condenser, allowing sun tracking without mixing the produced vapor with saline water or condensate. The solar irradiation incident on the SDC's aperture area is reflected to the solar still's absorber plate, it has an automatic sun tracking system to direct radiation normally to the receiver positioned in the focal point. The saline water in the solar still evaporates, generating vapor that condenses in the stainless-steel hose condenser. The proposed concentrator solar still's performance was evaluated under different atmospheric conditions using various operating parameters such as feed water salinity, where three different feed water salinities (17 ppt, 27 ppt, and 37 ppt) were assessed, which are suitable for either sea water or brackish water. Furthermore, several saline water filling ratios of 26.5%, 39.8%, 53.1%, and 66.3% were examined in order to determine the optimal ratio that yields maximum freshwater productivity. Aside from the system's uniqueness, the system is self-contained, and it may be powered by a solar cell, which is beneficial in off-grid rural areas. The system also has a small footprint, which may be beneficial in terms of preserving huge tracts of land; this feature can be capitalized on by mounting the new system on wind turbine towers and providing freshwater to employees and neighboring populations.
Experimental setup
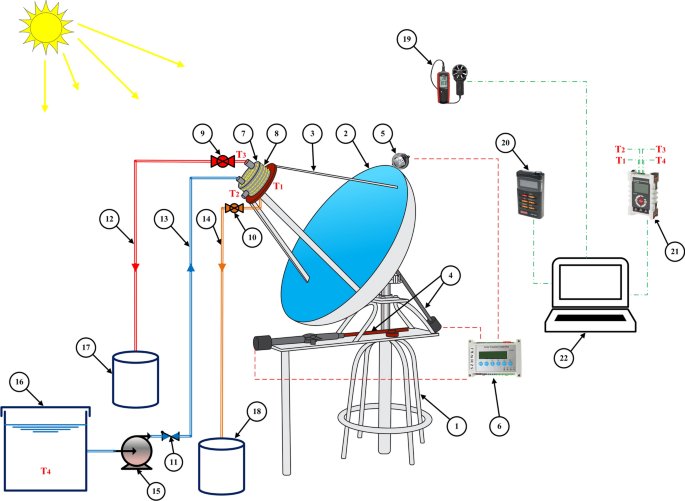
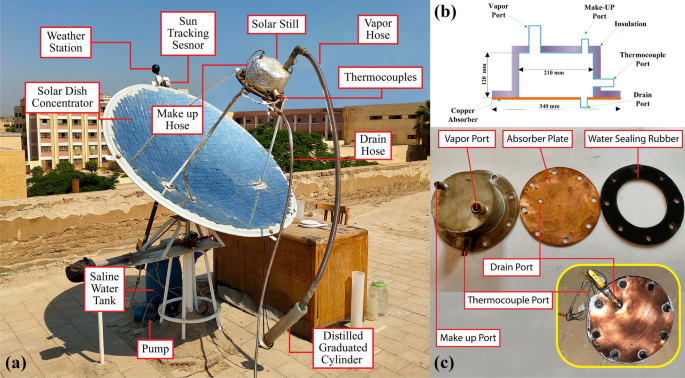
An innovative concentrated solar still was designed and fabricated; Fig. 1 provides the layout of the setup, while Fig. 2a introduces the pictorial view. All experiments were conducted on the roof of Shoubra engineering college (30.07° N, 31.24° E) under the climatic conditions of Cairo city in Egypt during the months of June, July, and August 2022. A 120-cm-diameter solar dish concentrator (aperture area of 1.13 m2) with 4 cm × 4 cm mirror pieces glued to its surface was utilized to reflect solar irradiation on its focal point, where the solar still is mounted.
As shown in Fig. 2b, a cylindrical stainless steel solar still with a 5 mm thickness, 20 cm diameter, and 12 cm height is bolted to a 3 mm thick, and 34-cm-diameter copper absorber plate with a rubber sealing in between to prevent water and vapor leakage. The solar still has four ports, as shown in Fig. 2c. The first is the make-up port, which is located on the solar still's top surface and is used to add water or flush the solar still of the brine. The vapor output port, which is also located at the top of the solar still where steam escapes and condenses. The drain port at the bottom of the absorber plate drains the solar still from the brine water. Finally, the thermocouple port is located on the solar still's lateral surface and is used for thermocouples' insertion inside the solar still to monitor temperatures. To prevent heat losses from the solar still's side wall and top, 1 inch glass wool insulation is used, and the copper absorber at the bottom is painted with black selective coating to enhance solar radiation absorptivity.
Table 2 contains detailed descriptions of the experimental test rig main components. A dual axis tracking system was utilized to position the SDC directly normal to the incident solar radiation, ensuring that the radiation is consistently concentrated on the SDC's focal point. The tracking system is powered by two actuators, one of which spins the main axis of the system base from north to south with 225° degrees of freedom to alter the azimuth angle, whereas the other adjusts the elevation angle. These actuators are pre-configured with a WST03-2 solar tracking controller and powered by a 24 Volt AC/DC converter. To feed the solar still, a 0.3 HP water pump circulates saline water from the storage tank into the solar still make-up port.
Temperatures of the absorber plate inner surface, saline water in the evaporator, and vapor generated were monitored and measured using T-Type thermocouples, the probes were inserted into the solar still, thermocouples were connected to a multi-channel data recorder (MCR-4TC). The outside temperature of the absorber plate was measured using a Fluke Ti32 thermal imager, and the temperatures of saline water in the storage tank and distilled water in the yield tank were measured using a mercury thermometer. The ambient temperature and wind speed were measured using a WT8907 digital anemometer. While the direct normal irradiance incident normal to the parabolic dish was measured using a TES-1333R data recording solar power meter.
Experimental procedures
The practical experiments were conducted from June to August 2022, from 8:00 to 18:00 where they were performed on sunny days with an average direct solar irradiation of 824.2–923.2 W/m2. In the current study, the performance of the concentrated solar still was evaluated under three different feed water salinities prepared by dissolving Sodium Chloride in freshwater to simulate Mediterranean water (37 ppt) and Brackish water (27 ppt and 17 ppt). Furthermore, each of the prepared saline water samples is employed in a variety of saline water filling ratios \(\varnothing \), which are the ratios of the saline water inside the solar still to the volume of the solar still itself. Whereas the solar still is filled with 1, 1.5, 2, and 2.5 kg of saline water, corresponding to filling ratios of 26.5, 39.8, 53.1, and 66.3%, respectively. Every experiment began with cleaning the SDC's reflecting mirrors with a dry microfiber cloth, followed by spraying glass cleaner and wiping it. Then flush the solar still by circulating freshwater multiple times to make sure any residual brine from the previous experiment is removed and pump the saline water sample examined to the solar still. Run the measuring devices and double-check that everything is ready to begin the experiment. The experiment begins at 8:00, and all data are collected at 15-min intervals throughout the day. Whenever distilled water equal to 25% of the saline water charged in the still is obtained, the same amount of saline water is added as make-up. The tracking system is turned off and the experiment is finished at 18:00 during the sunset, the wastewater is discharged through the drain port, and the solar still is backwashed. The same procedures were repeated for the rest of experiments. The temperatures of ambient air, absorber internal and external surfaces, saline water inside the evaporator, vapor was measured, along with wind speed, direct normal irradiance, mass of distilled water yield were all monitored and recorded every 15 min.
The uncertainty analysis is crucial for experimental data obtained by the measuring devices to evaluate the accuracy of measurements. Table 3 shows the uncertainties associated with various experimental measuring devices such as solar power meter, thermocouples, and anemometer; these values are provided by the device datasheet. The Holman's method (Holman) is used to estimate the total uncertainty in the experimental data. The total uncertainty in the daily distilled productivity and the daily system efficiency of the experimental data results is calculated by Eq. (1):
where ωx and ωy are the independent variables uncertainties.
According to the uncertainty Eq. (1), the maximum total uncertainty in calculating the daily distilled productivity and the daily system efficiency is approximately 0.37% and 1.12%, respectively.
Data reduction
The following are the essential mathematical equations for comprehending the concentrated solar still and its performance based on the data acquired and recorded throughout the experiments:
The concentration ratio, which is the ratio of the dish aperture area (Adish) to the absorber area (Aabs), is the most essential aspect in the design and construction of solar concentrators, as stated by Eq. (2):
The incident heat on SDC is calculated using Eq. (3):
where Adish is the aperture area of SDC (m2) and DNI is the direct normal irradiance incident on the SDC surface (W/m2).
The heat concentrated on the solar still's absorber plate is computed as a function of the heat incident and is provided by Eq. (4):
The concentrator efficiency ηconc, defined as the ratio of heat received by the absorber to heat incident on SDC, is influenced by the optical characteristics of the materials utilized as well as the shape; it is computed by Eq. (5):
where ρ represents the reflectivity of SDC mirrors, Γ the intercept factor, and fs the shading factor generated by solar still on SDC mirrors.
Heat is lost from the absorber plate to the environment through two mechanisms: radiation and convection. Radiation heat loss is classified into two types: reflected and emitted. To begin, reflected radiation heat loss is computed using Eq. (6):
where ρabs denotes absorber reflectivity.
The emitted radiation heat loss is given by Eq. (7):
where εabs denotes the absorber emissivity and σ is Stefan–Boltzmann constant, which is \(5.67\times {10}^{-8}\) W/m2 K4. The absorber and ambient temperatures (K) are represented by Tabs and Tamb are, respectively.
The external convection heat loss on an angled heated flat plate is computed by Eq. (8):
where h is the convection heat transfer coefficient (W/m2 K) calculated using Eq. (11) and is a function of the Nusselt Number determined by Eq. (9):
where Re is the Reynolds Number determined from Eq. (10) and θ is the angle formed between the absorber plate and the vertical.
where Vwind is the wind velocity (m/s), Lc is the characteristic length (m), and ν is the air kinematic viscosity (m2/s).
where Nu represents the Nusselt Number and Kair denotes the thermal conductivity of air (W/m K).
The useful heat energy entering the absorber equals the concentrated heat minus the heat losses, as determined by Eq. (12):
The system efficiency is computed from Eq. (13):
where mdistilled denotes the mass of distilled yield (kg), hfg represents the latent heat of vaporization of water (J/kg), and ∆t denotes the time (s).
Results and discussion
The effects of saline water salinity and saline water filling ratio on concentrated solar still performance under various weather conditions have been demonstrated in this section.
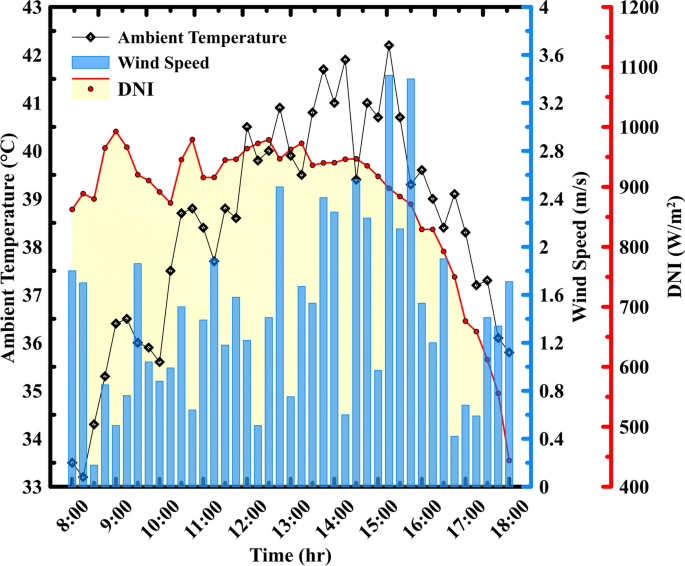
The weather data for a typical test day (Wednesday, July 28, 2022) are illustrated in Fig. 3. The ambient air temperature was minimum 33.2 °C at 8:15 and continuously rises throughout the experiment until it reaches its peak around 42 °C in the afternoon from 14:00 to 14:15. While the wind velocity varies substantially throughout the experiment, it reaches a maximum of 3.43 m/s at 15:15 and a minimum of 0.18 m/s at 8:30. The maximum direct normal irradiance (DNI) was 992.4 W/m2 at 9:00, and minimum of 443.6 W/m2 at sunset (18:00) while it has an average of 876.9 W/m2 throughout the day, with a slight decline due to clouds between 10:00 and 10:15.
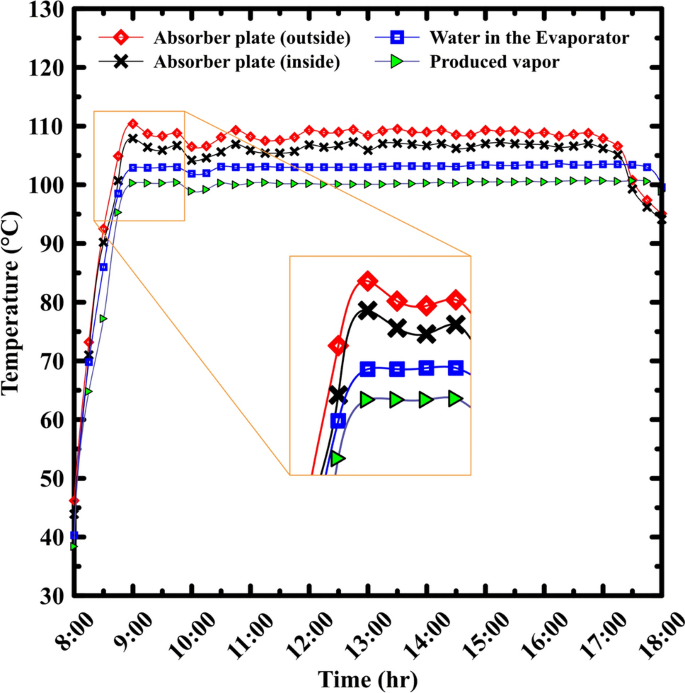
Hourly variations of outside and inside temperatures of the absorber plate, temperature of saline water inside the evaporator, and the produced vapor temperature on Wednesday, July 28, 2022, with a filling ratio of 53.1% and feed water salinity of 17 ppt are presented in Fig. 4. At 8:00, the temperatures of the absorber plate outside and inside, saline water in the evaporator, and the vapor were 46.2, 43.9, 40.3, and 38.4 °C, respectively. The figure clearly shows that all the temperatures increase with time during the buildup period until they reach the boiling point at 9:00, when the outside and inside temperatures of the absorber plate were 110.4 and 107.9 °C, respectively, and the temperature of the saline water in the evaporator, and the vapor produced were 102.9, and 100.3 °C, respectively, the slightly higher boiling temperature of water is due to the salinity of water being tested as recent studies have proved.
It can be seen that the system's temperatures are affected by the DNI, the system has fast response since temperatures dropped between 10:00 and 10:15, it depends on DNI only and not ambient temperature since the system is totally insulated except the small area of absorber. At 17:30, the outside and inside temperatures of the absorber plate begin to fall slightly below the temperatures of the saline water and vapor in the solar still because of the decrease of DNI, while the system's productivity is dependent on the stored heat in the solar still during this period.
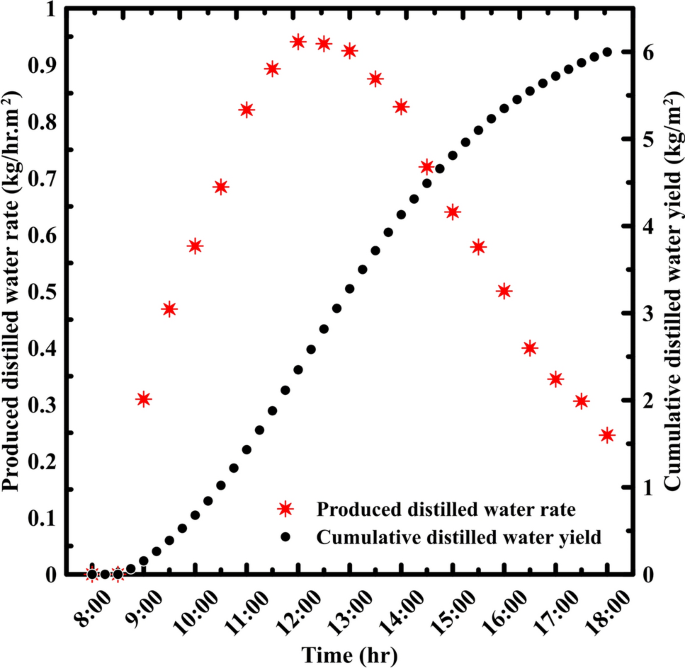
Following that, solar still hourly distilled water productivity fluctuation at filling ratio 53.1% and feed water salinity of 17 PPT on Wednesday, July 28, 2022, are shown in Fig. 5. Between 8:00 and 18:00, roughly 6 kg/m2 of distilled water was produced, where the cumulative productivity gradually increases over time. The produced distilled water rate was zero during the first hour due to energy buildup inside the solar still and then reached a maximum of 0.941 kg/h m2 at 12:00, when the ambient temperature was high and the wind speed was low, resulting in small thermal losses, as shown in Fig. 5. The effect of DNI drop on the productivity was at 10:30 with a slight lag between the productivity and the DNI.
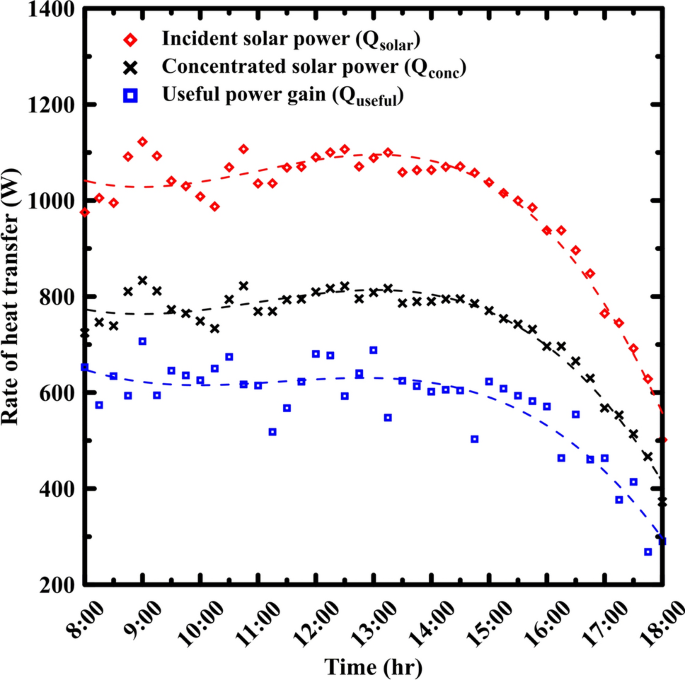
The incident heat (Qsolar), concentrated heat (Qconc), and useful heat (Quseful) are calculated from Eqs. (3), (4), and (12), respectively. The incident heat is dependent on DNI and follows the same pattern as shown in Fig. 6. While the difference between the incident heat and concentrated heat curves is due to collector efficiency, which is impacted by optical properties and geometry; both curves exhibit the same variation. Finally, the variance between the concentrated heat and useful heat curves is attributable to heat losses by radiation (reflection and emission) and convection, which are calculated using Eqs. (6), (7), and (8), respectively. These losses fluctuate continuously due to several uncontrollable factors; as a result, the useful heat varies substantially as seen in Fig. 6.
Effect of filling ratio on solar still performance
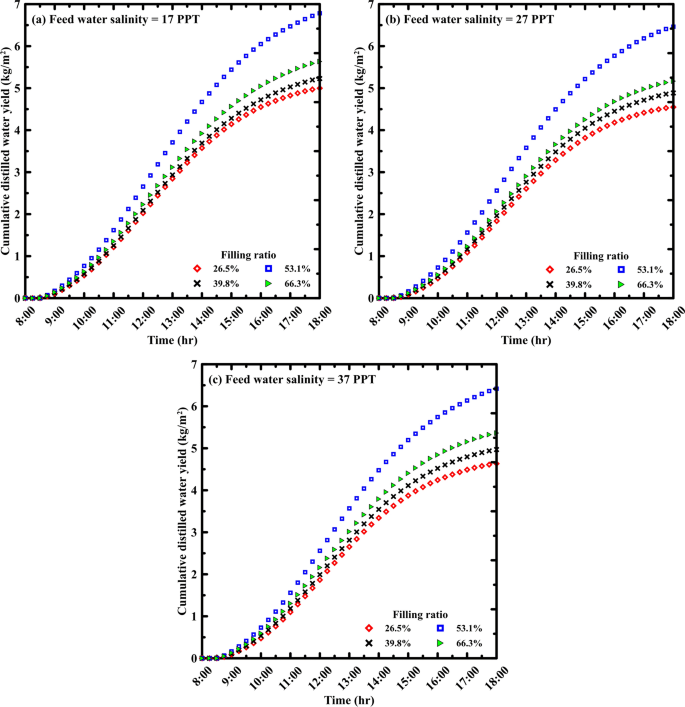
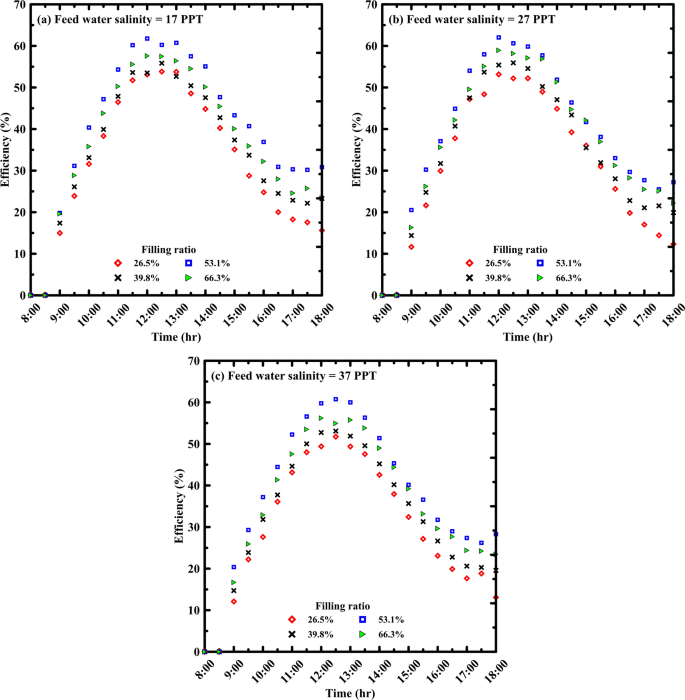
The solar still filling ratio has a significant impact on daily distilled productivity, system efficiency, and performance. As shown in Figs. 9, 10 and 11, the daily distilled productivity and the system efficiency increased by increasing the filling ratio of the still, from 26.5 to 53.1%, whereas from 53.1 to 66.3% decreased the performance of the solar still.
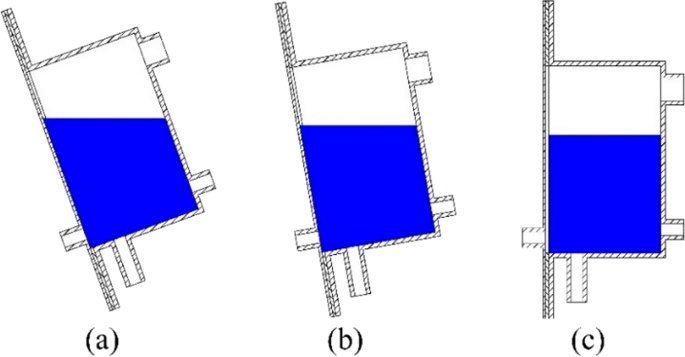
At the beginning the performance increases due two parameters: first when the filling ratio increased the make-up cycle (that previously described in experimental procedures section) frequency is decreased which absorb energy for added water to reach the evaporation temperature, second the increased filling ratio has a surface area of contact with absorber plate greater than lower filling ratio that make better heat transfer coefficient for the system, as illustrated in Fig. 7.
The contact area between water and absorber plate changes during the day due to sun tracking and frequent variations in elevation angle, as seen in Fig. 8. The area of the free water surface, which is the evaporation surface, is constant at a different filling ratio at the same angle of elevation as shown in Fig. 7, while bubbles form on the heating surface of the absorber plate and then rise to the evaporation surface. The longer the distance the bubbles travel, the higher resistance to the rate of evaporation. This effect over-controls when the filling ratio is 66.3%, and the reason behind the drop in the performance of the solar still.
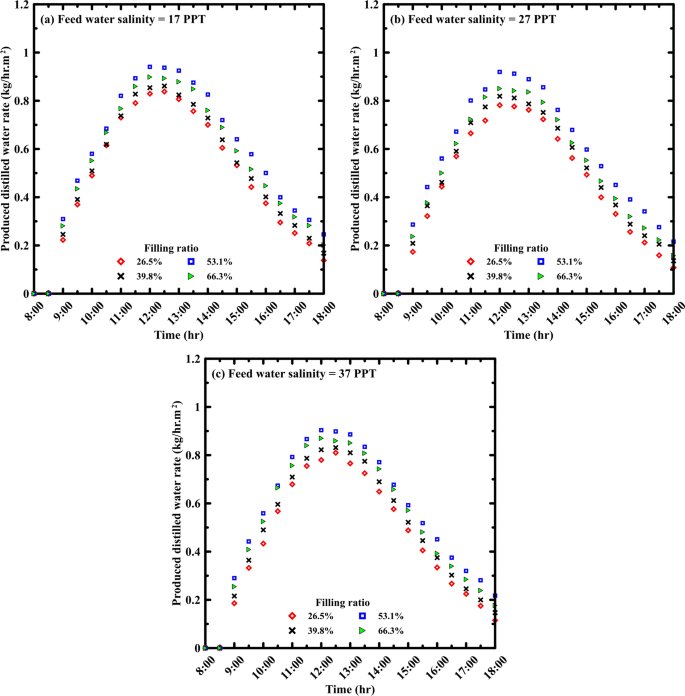
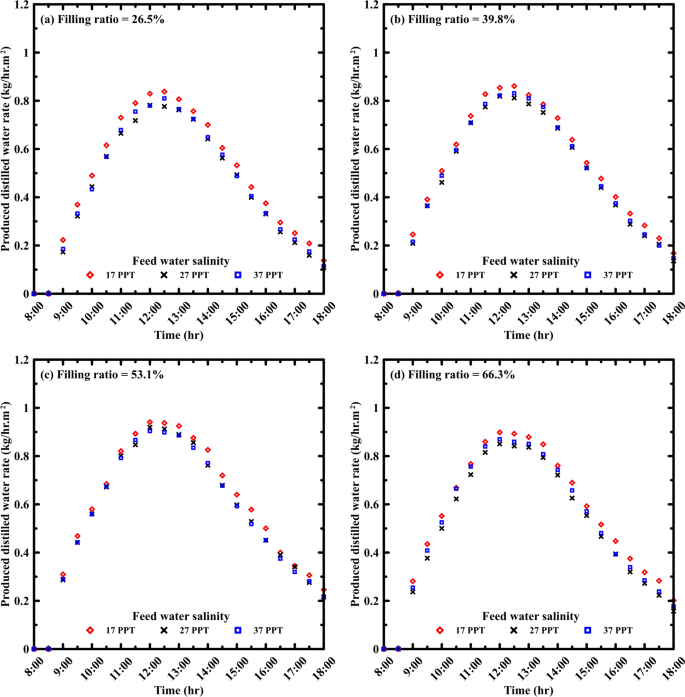
The rate of distilled water for various filling ratios 26.5%, 39.8%, 53.1% and 66.3% for different water salinity 17, 27 and 37 PPT is shown in Fig. 9. The distilled water rate goes up by increasing the filling ratio up to 53.1% before decreasing at 66.3% in all three salinities. The curves can be divided into three periods, first period from 9:00 to 11:00 where the curves are steepest as it is the period of energy buildup, second period from 11:30 to 13:30 where the curves are almost flat where the coming heat energy is utilized for evaporation, third period from 14:00 to 18:00 where the curves are less steep as the DNI gradually decreases while the latent heat is reserved within the solar still. For feed water salinity of 17 ppt, the distilled rates reach their maximum values at 12:00 of 0.829, 0.854, 0.941, and 0.898 kg/hr.m2 for filling ratios of still of 26.5, 39.8, 53.1, and 66.3%, respectively.
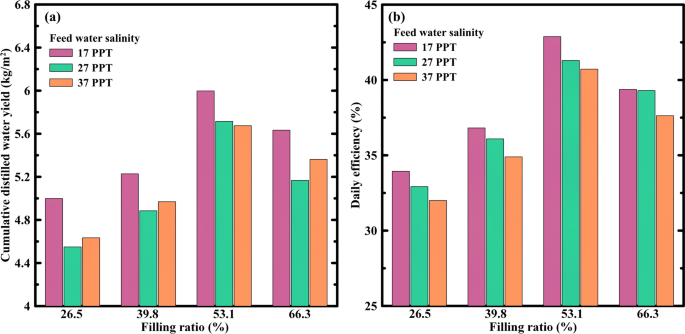
Figure 10 demonstrates the effect of varying the filling ratio on the system's cumulative productivity. Increasing the filling ratio of the still from 26.5% up to 53.1% boosted the daily cumulative productivity but it was reduced at 66.3% filling ratio. The daily cumulative productivity at 17 ppt feed water salinity was 5, 5.23, 6, and 5.63 kg/m2 for filling ratios of 26.5, 39.8, 53.1, and 66.3%, respectively.
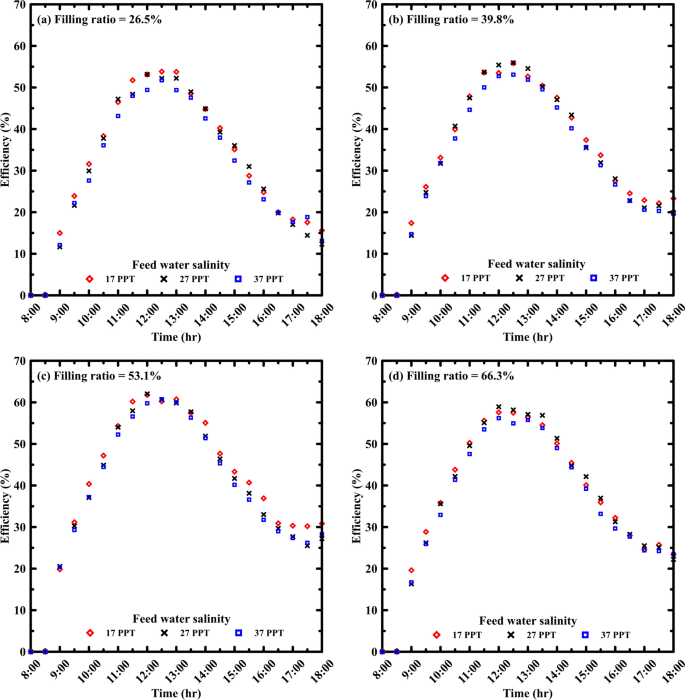
The instantaneous efficiency for different filling ratios is illustrated in Fig. 11; it is computed from the hourly distilled water and solar energy using Eq. (13). According to the figures, raising the filling ratio from 26.5 to 53.1% enhanced instantaneous efficiency, whereas increasing the filling ratio to 66.3% lowered it. The instantaneous efficiency gradually ascends until it reaches a maximum between 12:00 and 13:00, when the distilled water was at its peak, and then it progressively drops through the rest of test hours. Until the final period of 17:00 to 18:00, when the instantaneous efficiency remains constant or slightly increases, when the DNI drops and the generation of vapor and production of distilled water based on the heat energy stored inside the solar still. The instantaneous efficiencies at 12:00 for a feed water salinity of 17 ppt were 53.11, 54.31, 61.77, and 57.59%, for filling ratios of 26.5, 39.8, 53.1, and 66.3%, respectively.
Effect of varying feed water salinity
The effect of salinity was studied in the range of 17–37 ppt with 10 ppt increments, and the results showed that distilled productivity and system efficiency were insignificantly reduced with salinity increase, which is considered beneficial for the proposed desalinating system because it can desalinate not only brackish or saline water but also highly saline and brine water. The boiling temperature elevates with increased salinity requiring more energy to evaporate the saline water. Furthermore, raising the salinity of the feed water causes precipitated salts to accumulate on the absorber plate surface over time, acting as insulation for heat transfer into the solar still.
The rate of distilled water for various feed water salinities ranging from 17 to 37 ppt is shown in Fig. 12. The results demonstrated that a higher distilled water rate was achieved by the lowest salinity 17 ppt, whereas the 27 and 37 ppt salinities were remarkably closely explained by the lower average solar irradiance during the experiments on the 27 ppt sample. As described in the previous section where the distilled water rate curve can be divided into three periods, period of energy buildup from 9:00 to 13:00, period of peak evaporation from 11:30 to 13:30, finally period of decline from 14:00 to 18:00. The distilled water rate at 12:30 at a filling ratio of 26.5%, was 0.838, 0.777, and 0.81 kg/hr.m2 for feed water salinities of 17, 27, and 37 ppt, respectively.
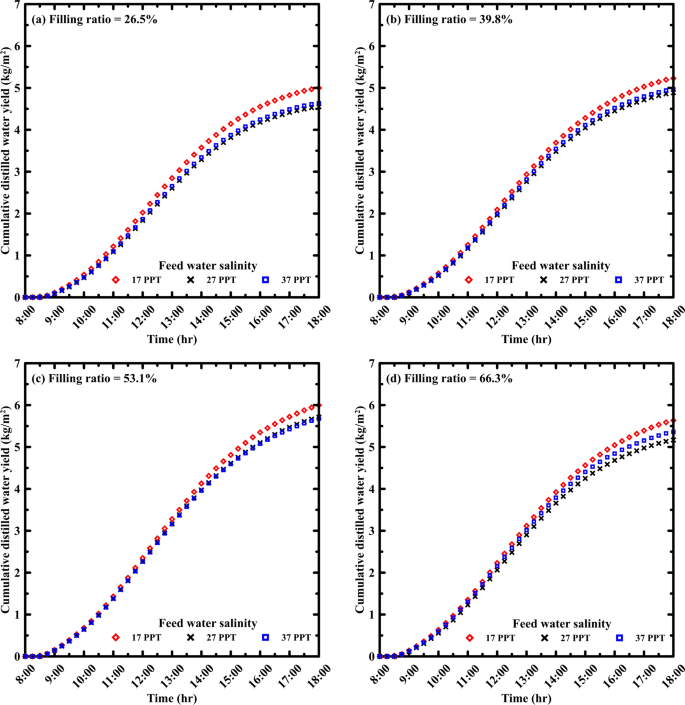
Figure 13 depicts the effect of feed water salinity on distilled cumulative productivity of the system. Raising the feed water salinity reduces the cumulative productivity. Raising the feed water salinity from 17 ppt to 27 and 37 ppt, lowered the cumulative productivity from 6 to 5.72 and 5.68 kg/m2, respectively, at filling ratio of 53.1%.
The instantaneous efficiency calculated from Eq. (13) for various feed water salinities is illustrated in Fig. 14. The instantaneous efficiency is relatively similar with minor differences, but it insignificantly decreased by increasing the feed water salinity. It can be seen that the efficiency remains constant or slightly increase in the period of 17:00 to 18:00 due to the drop in DNI and vapor generation depending on energy stored (as mentioned in the previous section). Maximum instantaneous efficiency values for filling ratio of 53.1% at 12:00 are 61.77%, 62.03%, and 59.77% for feed water salinities of 17, 27, and 37 ppt, respectively.
Figure 15 summarizes the proposed system's daily cumulative productivity and system efficiency under several operating parameters investigated. By increasing the filling ratio from 26.5 to 53.1%, daily productivity and system efficiency were on average enhanced by 22.7% and 26.3%, respectively. A further increase in the filling ratio from 53.1 to 66.3% averagely lowered daily productivity and system efficiency by 7.1% and 6.9%, respectively. On the contrary, raising the feed water salinity reduces daily cumulative productivity and system efficiency. When the feed water salinity is raised from 17 to 27 ppt, the values of daily productivity and system efficiency are reduced by 7.1% and 2.2%, respectively. The corresponding values for raising feed water salinity from 17 to 37 ppt are 5.6% and 5.1%, respectively. Taking into consideration the lower average solar irradiance during the experiments on the 27 ppt sample.
Economic analysis
Aside from design simplicity, ease of implementation, and component availability, the primary purpose of developing a novel solar desalinating unit is to supply pure freshwater at low cost and competitive rates to rural and isolated areas. Table 4 shows cost estimation for the proposed system's main components. The system's total fixed cost is approximately F = 231.6 $. The average cost of distilled water is calculated using Eq. (14):
where n is the expected solar still lifespan, V is the variable cost, and C is the total cost.
Previous studies used a variable cost (V) of 0.3 F per year (Omara and Eltawil 2013; Kabeel 2009) and a lifespan of 10 years for this unit, therefore \(C=231.6+0.3\times 231.6\times 10=926.4 \$\).
Nevertheless, for a comprehensive evaluation of the system's economic viability throughout the year, the annual productivity is calculated by multiplying the average summer production by the average number of sunny days in the testing region. Sunny days annually typically range between 250 and 340 in various countries (Omara and Eltawil 2013; Elashmawy 2017, 2020, 2019; Elashmawy and Alshammari 2020; Ahmed et al. 2022; Wang et al. 2022; Abubakkar et al. 2021; Tawfik et al. 2022; Gorjian et al. 2014; Kabeel 2009; Jobrane et al. 2022; Dhivagar et al. 2022; Alqsair et al. 2022), while in Egypt, this range extends from 300 to 340 (Omara and Eltawil 2013; Tawfik et al. 2022; Kabeel 2009). In this study, the average value within the specified range for Egypt has been utilized. This daily average distilled productivity figure serves as a pivotal metric for evaluating the system's overall performance and efficiency. Furthermore, it underscores the importance of extending the analysis beyond the summer season to encompass variations in climatic conditions throughout the year. While the current data reflect operational outcomes during hot climatic conditions during summer season, it is imperative to address the system's performance during the contrasting winter season. In accordance with the experimental findings, the daily average distilled productivity of the system is established at 5.92 kg/day. Assume the distillation system operates for approximately 320 days per year, considering the consistent sunlight throughout the year in Egypt. During the system's lifespan, the total distilled yield is \(5.92\times 10\times 320=18{,}944\, {\text{kg}}\). The cost of producing one kilogram of freshwater is \(926.4/18944=0.0489\,{\$}\).
Egypt, situated within the Earth's Sun Belt, exhibits distinct solar energy potential throughout the year, it experiences a range of daily direct normal irradiance (DNI) from 5.6 to 7.6 kWh/m2, as delineated by the solar atlas. Egypt gets the most sunshine hours in June (11.9 h), the least in January (6.2 h), and an average of 9.2 h throughout the year (Climate: Nile Delta in Egypt. 2024). The investigation was conducted during June, and July, and August with a daily operational timeframe of 10 h, aligning with the yearly average. While the system's efficiency may dip during winter compared to summer, Egypt's substantial solar energy potential persists throughout the year, ensuring the system can maintain satisfactory water productivity even in the winter months.
Table 5 illustrates a comparison of the current study's findings with prior investigations with conventional solar stills and solar stills coupled with solar dish concentrator. The daily cumulative productivity for the current study was 6 kg/m2, which is within range for previous studies of concentrated solar stills (4.44–6.5 kg/m2), and higher than that of CSS (1.19–4.235 kg/m2). The efficiency of the solar still system increased by concentrating more solar radiation on the absorber plate leading to increasing the temperatures of the waters and reaching the boiling state and enhance the generation of vapor. The system efficiency of the proposed system was higher than that of CSS (11–31.46%), while comparing it to concentrated solar still it was higher than Tawfik (2022).
It can be seen that the concentration ratio affects the cost of the distilled water, Tawfik (2022) had less CR than the proposed system, so their system CPL was higher, while Omara (Omara and Eltawil 2013) had higher CR than the proposed system, so their system CPL was less; this achievement is critical for water production. Furthermore, when compared to the global average CPL of $0.474 (Bottled water 2022), the current study indicates an excellent CPL of water.
Conclusions and recommendations
The current study explores the experimental performance of an innovative sun tracking concentrated solar still with a solar concentration ratio of 12.5 under Egyptian weather conditions. This is to identify novel options for providing freshwater to rural areas in simple and cost-effective ways. In the summer of 2022, the system was assessed by varying two critical factors: the feed water salinity (17 ppt, 27 ppt, 37 ppt to replicate sea water in the Mediterranean Sea and brackish water in Egypt). Furthermore, the solar still filling ratios, where four ratios were assessed (26.5, 39.8, 53.1, and 66.3%), the study's primary conclusions are as follows:
-
Increasing the filling ratio from 26.5 to 53.1% resulted in a 22.69% increase in the daily cumulative productivity and a 26.34% boost in the daily system efficiency.
-
Further increase in the filling ratio from 53.1 to 66.3% has reduced the daily cumulative productivity and daily system efficiency by 7.06% and 6.87%, respectively.
-
Increasing the feed water salinity from 17 to 37 ppt reduced the daily cumulative productivity by approximately 5.61% while decreasing daily system efficiency by 5.1%.
-
The optimum solar still filling ratio is 53.1%, with a daily cumulative productivity of 6 kg/m2 and a daily system efficiency of 42.88%.
-
By examining the pricing of the proposed concentrator solar still, it indicates the distinct economic feasibility, as a liter of desalinated water costs $0.0489, which is a promising price when compared to the other solar desalination technologies.
The current study indicates potential areas for further improvement, suggesting the following research opportunities:
-
Evaluate the device's performance under various climatic conditions throughout the year, with a specific focus on cloudy conditions to provide a more comprehensive overview.
-
Consider incorporating photovoltaic cells to supply the required electrical power, enhancing the device's sustainability, and reducing dependence on external power sources.
Abbreviations
- A :
-
Area (m2)
- CR:
-
Concentration ratio
- DNI:
-
Direct normal irradiance (W/m2)
- f s :
-
Shading factor
- h :
-
Convection heat transfer coefficient (W/m2 K)
- h fg :
-
Water latent heat of vaporization (J/kg)
- k :
-
Thermal conductivity (W/m K)
- L c :
-
Characteristic length (m)
- m distilled :
-
Mass of distilled yield (kg)
- Nu:
-
Nusselt number
- Q :
-
Heat transfer (W)
- Re:
-
Reynolds number
- T :
-
Temperature (K)
- T abs :
-
Absorber outside temperature (K)
- T amb :
-
Ambient air temperature (K)
- V wind :
-
Velocity of wind (m/s)
- Δt :
-
Time interval (s)
- Ε :
-
Emissivity
- Η :
-
Efficiency
- Θ :
-
Angle formed by the absorber plate and the vertical
- Ν :
-
Kinematic viscosity (m2/s)
- Ρ :
-
Reflectivity
- Σ :
-
Stefan–Boltzmann constant (W/m2 K4)
- Φ :
-
Filling ratio
- ω :
-
Uncertainty
- Γ:
-
Intercept factor
- conc:
-
Concentrated
- conv:
-
Convection
- emit:
-
Emitted
- ref:
-
Reflected
- sys:
-
System
- CPL:
-
Cost per liter ($/L)
- CSS:
-
Conventional solar still
- PCM:
-
Phase change material
- SDC:
-
Solar dish concentrator
References
Abubakkar A, Selvakumar P, Rajagopal T, Tamilvanan A (2021) Development of concentrating dish and solar still assembly for sea water desalination. In: Materials Today: Proceedings, Elsevier, Amsterdam pp 974–980. https://doi.org/10.1016/j.matpr.2020.03.043.
Ahmed MMZ, Alshammari F, Alatawi I, Alhadri M, Elashmawy M (2022) A novel solar desalination system integrating inclined and tubular solar still with parabolic concentrator. Appl Therm Eng 213:118665. https://doi.org/10.1016/j.applthermaleng.2022.118665
Al-Amayreh MI, Alahmer A, Manasrah A (2020) A novel parabolic solar dish design for a hybrid solar lighting-thermal applications. Energy Rep 6:1136–1143. https://doi.org/10.1016/J.EGYR.2020.11.063
Al-Harahsheh M, Abu-Arabi M, Ahmad M, Mousa H (2022) Self-powered solar desalination using solar still enhanced by external solar collector and phase change material. Appl Therm Eng 206:118118. https://doi.org/10.1016/j.applthermaleng.2022.118118
Al_qasaab MR, Abed QA, Abd Al-wahid WA (2021) Enhancement the solar distiller water by using parabolic dish collector with single slope solar still. J Therm Eng 7(4):1001–1015
Aliman O, Daut I, Adzman R (2007) Simplification of sun tracking mode to gain high concentration solar energy. Am J Appl Sci 4(3):171–175
Alqsair UF, Abdullah AS, Omara ZM (2022) Enhancement the productivity of drum solar still utilizing parabolic solar concentrator, phase change material and nanoparticles’ coating. J Energy Storage. https://doi.org/10.1016/j.est.2022.105477
Alshqirate AA, Awad AS, Al Alawin A, Essa MA (2023) Experimental investigation of solar still productivity enhancement of distilled water by using natural fibers. Desalination 553:116487. https://doi.org/10.1016/j.desal.2023.116487
Amiri H, Aminy M, Lotfi M, Jafarbeglo B (2021) Energy and exergy analysis of a new solar still composed of parabolic trough collector with built-in solar still. Renew Energy 163:465–479. https://doi.org/10.1016/j.renene.2020.09.007
Bahrami M, Madadi Avargani V, Bonyadi M (2019) Comprehensive experimental and theoretical study of a novel still coupled to a solar dish concentrator. Appl Therm Eng 151:77–89. https://doi.org/10.1016/j.applthermaleng.2019.01.103
Bait O (2020) Direct and indirect solar–powered desalination processes loaded with nanoparticles: a review. Sustain Energy Technol Assessm 37:100597. https://doi.org/10.1016/j.seta.2019.100597
Bottled water—prices by country, around the world, September 2022|GlobalProductPrices.com. Accessed: Apr. 14, 2023 (online). Available: https://www.globalproductprices.com/rankings/mineral_water_prices/
Chaouchi B, Zrelli A, Gabsi S (2007) Desalination of brackish water by means of a parabolic solar concentrator. Desalination 217(1–3):118–126. https://doi.org/10.1016/j.desal.2007.02.009
Climate: Nile Delta in Egypt. Accessed: Jan. 20, 2024. (online). Available: https://www.worlddata.info/africa/egypt/climate-nile-delta.php
Coventry J, Andraka C (2017) Dish systems for CSP. Sol Energy 152:140–170. https://doi.org/10.1016/j.solener.2017.02.056
Dhivagar R, Shoeibi S, Parsa SM, Hoseinzadeh S, Kargarsharifabad H, Khiadani M (2023) Performance evaluation of solar still using energy storage biomaterial with porous surface: an experimental study and environmental analysis. Renew Energy 206(December 2022):879–889. https://doi.org/10.1016/j.renene.2023.02.097
El-Sebaey MS, Ellman A, Hegazy A, Panchal H (2022) Experimental study and mathematical model development for the effect of water depth on water production of a modified basin solar still. Case Stud Therm Eng 33:101925. https://doi.org/10.1016/j.csite.2022.101925
El-Sebaii AA, El-Naggar M (2017) Year round performance and cost analysis of a finned single basin solar still. Appl Therm Eng 110:787–794. https://doi.org/10.1016/j.applthermaleng.2016.08.215
Elashmawy M (2017) An experimental investigation of a parabolic concentrator solar tracking system integrated with a tubular solar still. Desalination 411:1–8. https://doi.org/10.1016/j.desal.2017.02.003
Elashmawy M (2019) Effect of surface cooling and tube thickness on the performance of a high temperature standalone tubular solar still. Appl Therm Eng 156:276–286. https://doi.org/10.1016/j.applthermaleng.2019.04.068
Elashmawy M (2020) Improving the performance of a parabolic concentrator solar tracking-tubular solar still (PCST-TSS) using gravel as a sensible heat storage material. Desalination 473:114182. https://doi.org/10.1016/j.desal.2019.114182
Elashmawy M, Alshammari F (2020) “Atmospheric water harvesting from low humid regions using tubular solar still powered by a parabolic concentrator system. J Clean Prod 256:120329. https://doi.org/10.1016/j.jclepro.2020.120329
Fayaz Z, Dhindsa GS, Sokhal GS (2021) Experimental study of solar still having variable slope tilted wick in the basin to enhance its daily yield. In: Materials today: proceedings. Elsevier, Amsterdam (2021), pp 1421–1426. https://doi.org/10.1016/j.matpr.2021.09.195
Fredriksson J, Eickhoff M, Giese L, Herzog M (2021) A comparison and evaluation of innovative parabolic trough collector concepts for large-scale application. Sol Energy 215:266–310. https://doi.org/10.1016/j.solener.2020.12.017
Global Solar Atlas (2023) Accessed: Mar. 29, 2023. (online). Available: https://globalsolaratlas.info/download/egypt
Gorjian S, Ghobadian B, Tavakkoli Hashjin T, Banakar A (2014) Experimental performance evaluation of a stand-alone point-focus parabolic solar still. Desalination 352:1–17. https://doi.org/10.1016/j.desal.2014.08.005
Holman JP. Experimental methods for engineers eighth edition. (online). Available: www.mhhe.com/holman
Jamar A, Majid ZAA, Azmi WH, Norhafana M, Razak AA (2016) A review of water heating system for solar energy applications. Int Commun Heat Mass Transf 76:178–187. https://doi.org/10.1016/J.ICHEATMASSTRANSFER.2016.05.028
Jobrane M, Kopmeier A, Kahn A, Cauchie HM, Kharroubi A, Penny C (2022) Theoretical and experimental investigation on a novel design of wick type solar still for sustainable freshwater production. Appl Therm Eng 200:117648. https://doi.org/10.1016/j.applthermaleng.2021.117648
Kabeel AE (2009) Performance of solar still with a concave wick evaporation surface. Energy 34(10):1504–1509. https://doi.org/10.1016/j.energy.2009.06.050
Luo Y, Lu T, Du X (2018) Novel optimization design strategy for solar power tower plants. Energy Convers Manag 177:682–692. https://doi.org/10.1016/j.enconman.2018.09.089
Muthu Manokar A et al (2020) Effect of water depth and insulation on the productivity of an acrylic pyramid solar still—an experimental study. Groundw Sustain Dev 10:100319. https://doi.org/10.1016/j.gsd.2019.100319
Omara ZM, Eltawil MA (2013) Hybrid of solar dish concentrator, new boiler and simple solar collector for brackish water desalination. Desalination 326:62–68. https://doi.org/10.1016/j.desal.2013.07.019
Panchal H et al (2021) Graphite powder mixed with black paint on the absorber plate of the solar still to enhance yield: An experimental investigation. Desalination 520:115349. https://doi.org/10.1016/j.desal.2021.115349
Perini S, Tonnellier X, King P, Sansom C (2017) Theoretical and experimental analysis of an innovative dual-axis tracking linear Fresnel lenses concentrated solar thermal collector. Sol Energy 153:679–690. https://doi.org/10.1016/j.solener.2017.06.010
Prado GO, Vieira LGM, Damasceno JJR (2016) Solar dish concentrator for desalting water. Sol Energy 136:659–667. https://doi.org/10.1016/j.solener.2016.07.039
Qtaishat MR, Banat F (2013) Desalination by solar powered membrane distillation systems. Desalination 308:186–197. https://doi.org/10.1016/j.desal.2012.01.021
Rahmani A, Khemmar F, Saadi Z (2021) Experimental investigation on the negative effect of the external condenser on the conventional solar still performance. Desalination 501(August 2020):114914. https://doi.org/10.1016/j.desal.2020.114914
Renewable Energy|Department of Energy.” Accessed: Mar. 29, 2023. (online). Available: https://www.energy.gov/eere/renewable-energy
Sakthivadivel D, Balaji K, Dsilva Winfred Rufuss D, Iniyan S, Suganthi L (2020) Solar energy technologies: principles and applications. In: Renewable-energy-driven future: technologies, modelling, applications, sustainability and policies. Elsevier, Amsterdam, pp 3–42. https://doi.org/10.1016/B978-0-12-820539-6.00001-7
Shatat M, Riffat SB (2014) Water desalination technologies utilizing conventional and renewable energy sources. Int J Low-Carbon Technol 9(1):1–19. https://doi.org/10.1093/ijlct/cts025
Tawfik MA, El-Tohamy M, Metwally AA, Khallaf AM, Abd Allah WE (2022) Experimental and numerical investigation of thermal performance of a new design solar parabolic dish desalination system. Appl Therm Eng 214:118827. https://doi.org/10.1016/j.applthermaleng.2022.118827
Tian Y, Zhao CY (2013) A review of solar collectors and thermal energy storage in solar thermal applications. Appl Energy 104:538–553. https://doi.org/10.1016/J.APENERGY.2012.11.051
Velmurugan V, Deenadayalan CK, Vinod H, Srithar K (2008) Desalination of effluent using fin type solar still. Energy 33(11):1719–1727. https://doi.org/10.1016/j.energy.2008.07.001
Wang L, Ma X, Zhao Y, Jin R, Zheng H (2022) Performance study of a passive vertical multiple-effect diffusion solar still directly heated by parabolic concentrator. Renew Energy 182:855–866. https://doi.org/10.1016/j.renene.2021.09.074
Acknowledgements
The authors would like to thank the Combustion and energy technology lab at Benha University's Shoubra faculty of engineering for providing technical assistance and experimental tools for this study.
Funding
Open access funding provided by The Science, Technology & Innovation Funding Authority (STDF) in cooperation with The Egyptian Knowledge Bank (EKB).
Author information
Authors and Affiliations
Corresponding authors
Ethics declarations
Conflict of interest
The authors declare that they have no known competing financial interests or personal relationships that could have appeared to influence the work reported in this paper.
informed consent
There are no human or animal participants in our research.
Rights and permissions
Open Access This article is licensed under a Creative Commons Attribution 4.0 International License, which permits use, sharing, adaptation, distribution and reproduction in any medium or format, as long as you give appropriate credit to the original author(s) and the source, provide a link to the Creative Commons licence, and indicate if changes were made. The images or other third party material in this article are included in the article's Creative Commons licence, unless indicated otherwise in a credit line to the material. If material is not included in the article's Creative Commons licence and your intended use is not permitted by statutory regulation or exceeds the permitted use, you will need to obtain permission directly from the copyright holder. To view a copy of this licence, visit http://creativecommons.org/licenses/by/4.0/.
About this article
Cite this article
Daif, M.M., Emam, M., Abdelrahman, M.A. et al. Experimental investigation of a sun tracking concentrated solar still with economic analysis. Appl Water Sci 14, 136 (2024). https://doi.org/10.1007/s13201-024-02182-7
Received:
Accepted:
Published:
DOI: https://doi.org/10.1007/s13201-024-02182-7


