
Abstract
This study presents an assessment of groundwater quality over the two constituent districts (Faridabad and Gurgaon) of the National Capital Region (NCR), India, using geospatial and statistical approaches. These districts have been subjected to rapid urbanization and industrialization in recent years. The groundwater quality parameters viz., pH, electrical conductivity (EC), carbonate (CO32−), bicarbonate (HCO3−), chloride (Cl−), sulphate (SO42−), nitrate (NO3−), fluoride (F−), calcium (Ca2+), magnesium (Mg2+), sodium (Na+), potassium (K+), silica (SiO2), and total hardness (TH) are obtained for the year of 2017 from 28 sites over the study area. The suitability for human drinking purposes is assessed by comparing the concentration of parameters at each site with respect to their permissible limits recommended by the Bureau of Indian Standards (IS 10500: 2012). The geospatial mapping of the water quality parameters is carried out to visualize their variations, whereas their risk assessment is accomplished by the statistical approaches viz., water quality index (WQI), correlation, and principal component analysis (PCA). The number of sites exceeding the permissible limits of pH, EC, Cl−, SO42−, NO3−, F−, Ca2+, Mg2+, Na+, K+, and TH is obtained to be 7, 15, 5, 6, 8, 3, 5, 7, 18, 3, and 8, respectively. The WQI analysis revealed 10 out of the 28 sites to be unsuitable for drinking purposes. The parameters mostly exhibited positive correlations except for pH that showed a negative correlation with other parameters. The results of PCA revealed the first principal component (PC1) to explain more than 95% of the total variance, thereby significantly reducing the dimensionality. The deteriorated water quality may be mainly attributed to anthropogenic activities, i.e., reckless industrial growth, population explosion, and rapid urbanization. This study emphasizes the need for regular water quality monitoring, and the information reported will certainly help for water resources planning and management, especially over the industrial regions of NCR, India.
Introduction
Water contamination has caused several diseases and deaths worldwide, and therefore, is considered a sensitive issue for humankind. Particularly for Indian regions, the problem is aggravated due to rapid industrialization, urbanization, and population growth, thereby leading to more discharge of effluents/pollutants into the environment (Aravinthasamy et al. 2020; Bahita 2019; Swain et al. 2021; Wagh et al. 2018, 2019a, 2019b, 2020). The utility of water for a specific purpose needs the physical, chemical, and biological characteristics of the dissolved or suspended constituents to be under certain thresholds, which are regarded as the permissible limits. The primary objective of setting these limits is to ascertain no harmful effects to the user. Water pollution has become an alarming concern, mostly due to the ever-increasing anthropogenic interventions, as evident from several prior studies (Adimalla 2019, 2020; Bahita et al. 2021a, 2021b; Jasrotia and Kumar 2014; Jasrotia et al. 2018; Karunanidhi et al. 2021a, 2021b; Li et al. 2014, 2017; Zhang et al. 2019, 2021a, 2021b, 2021c). The water resources in numerous countries are in critical condition due to changes in their physicochemical nature. These changes cause damages to human beings, plants and animals. Upon consumption, the poor quality of water may cause diseases or toxic health effects to human beings and livestock. Similarly, the deterioration in water quality may directly hamper the survival conditions of the aquatic animals. To prevent the crops from diseases and improve the crop production, the water quality should be suitable. The persistent application of contaminated water for irrigation may also deteriorate the soil condition making it less productive or even unfit for agriculture (Zhang et al. 2020a, 2020b). Therefore, to preserve and maintain the natural ecosystem, regular assessments of water quality are crucial (Bahita 2019; Xu et al. 2019a, 2019b, 2019c).
Groundwater plays a vital role in fulfilling the water demands for India's municipal, agricultural, and industrial sectors. It is also a fact that India is the largest user of groundwater in the world, with an annual usage of 251 km3 (Sahoo et al. 2021; Swain et al. 2022). As groundwater is generally believed to be free from contaminants as their exposure is relatively lesser than surface water bodies, they are directly used for drinking purposes at several places, especially in developing countries (Dhal and Swain 2022). However, due to numerous natural or anthropogenic factors, the groundwater quality has been under threat of deterioration in terms of quality and quantity. The contamination of groundwater has been reported in several recent studies (Adimalla and Venkatayogi 2018; Adimalla et al. 2020; Kadam et al. 2021a, 2021b, 2021c; Li et al. 2016, 2021; Wu et al. 2015). Particularly in the urban areas of developing countries, the water quality has deteriorated significantly due to an exponential increase in industrialization. The effluents discharged from these industries have very harmful impacts on the surface and groundwater. Further, rapid population growth and urbanization in such regions have led to a remarkable increase in water demands. Under such circumstances, the degradation in water quality becomes a grave issue. Therefore, in the view of environmental management, it is necessary to evaluate and monitor groundwater quality regularly. Further, out of the 17 Sustainable Development Goals (SDG) established by United Nations in 2015, the SDG 6 of “Clean water and sanitation” aims to achieve universal and equitable access to safe and affordable drinking water for all. It also emphasizes improving the water quality by minimizing pollution and efficiently managing the contaminants (UNDESA 2016).
The geographic information system (GIS) is used to create, manage, analyse, and map various types of data. In the domain of groundwater and water quality assessments, GIS has been utilized to visualize the spatial variations in water quality parameters that helps in identifying the critical regions, which may be helpful to recognize the primary sources of contamination (Jasrotia et al. 2013, 2016, 2018; Karunanidhi et al. 2013, 2019a, 2019b; Khan et al. 2020; Thilagavathi et al. 2015; Venkatesan et al. 2021). However, evaluating many parameters to discern the overall water quality becomes a difficult task. This problem can be resolved by the water quality index (WQI), which integrates multiple parameters along with their relative importance to form a single unit. In addition, the statistical approaches viz., correlations and principal component analysis (PCA) are extensively used to carry out understand the inter-dependence and dominance of the water quality parameters (Li et al. 2019; Taloor et al. 2020; Wu et al. 2014). Both the geospatial and statistical approaches can certainly be helpful to the water resources managers for decision-making purposes.
The Gurgaon and Faridabad districts of Haryana, located in the periphery of New Delhi, have witnessed rapid urbanization and industrialization in last few years (Guptha et al. 2021, 2022; Rai and Saha 2015). This might have affected the groundwater quality of these two districts. Groundwater is the main source of for fulfilling the drinking, agricultural, domestic, and industrial water demands; yet there is hardly any study on the assessment of groundwater quality in recent period. As groundwater of the rapidly urbanizing centres is usually more vulnerable to pollution, their regular monitoring is necessary to minimize the associated human health risks. In this regard, this study aims to comprehensively evaluate groundwater quality using geospatial and statistical approaches. The specific objectives are, (a) to analyse the groundwater quality parameters and prepare geospatial maps depicting their distribution across Gurgaon and Faridabad districts, (b) to ascertain the groundwater suitability using WQI and maps to visualize their spatial variations, and (c) to apply the statistical approaches, viz., correlation and PCA to understand the inter-dependence and dominance among different parameters. In the subsequent sections of this paper, study area and data, methodology, results and discussion, and the key conclusions drawn from the study are described in detail.
Materials and methods
Study area and data
In the present study, a growing industrial area in the Gurgaon and Faridabad districts of Haryana, India, is considered to investigate groundwater quality. The study area lies between 76.6° E to 77.5° E longitudes and 28.2° N to 28.5° N latitudes. Gurgaon and Faridabad lie in the periphery of Delhi and are also the prominent constituents of India’s National Capital Region (NCR). The location of the study area is presented in Fig. 1. Due to the rapid growth of urbanization, industrialization, and population, the groundwater of these districts is under a severe threat of deterioration in terms of quality and quantity.

Location of the study area (Gurgaon and Faridabad districts, Haryana, India)
The study area is occupied by Quaternary alluvium and Pre-Cambrian meta- sediments of Delhi Super Group (Kaur et al. 2019; Singh and Bhatia 2013). Regarding aquifer system, the major part is underlain by Quaternary alluvium consisting of sand, clay, and silt, which forms the principal ground water bearing horizon. Thus, groundwater exists/occurs in alluvium and the underlying weathered or fractured quartzites. The semi-consolidated sand beds resulting from weathering and fracturing processes form potential aquifer zones (Kaur et al. 2019; Singh and Bhatia 2013). The average annual rainfall over the Gurgaon and the Faridabad districts is 596 mm and 542 mm, respectively, which is much lower compared to the average annual rainfall over the entire country (i.e., 1194 mm). Therefore, groundwater is a vital source to cater the water demands for irrigation, drinking, domestic and industrial purposes.
The data for the present study are procured from the Central Ground Water Board (CGWB), Government of India. The information on the water quality parameters viz., pH, electrical conductivity (EC), carbonate (CO32−), bicarbonate (HCO3−), chloride (Cl−), sulphate (SO42−), nitrate (NO3−), fluoride (F−), calcium (Ca2+), magnesium (Mg2+), sodium (Na+), potassium (K+), silica (SiO2), and total hardness as calcium carbonate equivalent (TH) are obtained for the year of 2017 (pre-monsoon season) from 28 sites over the study area. Out of these, 7 sites were located in Faridabad district, whereas 21 sites were located in Gurgaon district. The details (i.e., district, block, location, longitude and latitude) of all the 28 sites are summarized in Table 1. The procedure adopted by CGWB for sampling and measuring concentrations of different parameters are provided in the supplementary information.
Methodology
In the present study, the data collected for different sites over the study area are assessed for the concentration of geochemical parameters and whether they are suitable for human drinking. In addition, prevalent statistical techniques are also used for the risk assessments of groundwater quality. These statistical techniques include water quality index (WQI), correlation and significance testing, and principal component analysis (PCA), which are briefly described as follows. The data are presented in the Table S1 of the Supplementary Information.
Comparison with a reliable standard and geospatial mapping
The assessment of groundwater quality regarding its suitability for drinking purposes needs a comparison with respect to the permissible limits recommended by the Bureau of Indian Standards (IS 10500: 2012) as mentioned in previous studies (Bahita et al. 2021a; Prasanth et al. 2012). Therefore, the concentration of individual water quality parameters from each site is compared against the corresponding limit prescribed by BIS (2012) to detect the sites affected by pollution. Further, some of the quality parameters are geospatially mapped through GIS to understand the spatial variation of the groundwater contamination.
Water quality index (WQI)
WQI method is very commonly used to assess the overall quality of water considering the concentrations of several parameters, which makes it easier for the water resource managers, especially for decision-making on water supply for specified purposes (Adimalla and Qian 2019; Adimalla and Taloor 2020; Bahita et al. 2021a, 2021b; Gaikwad et al. 2020). The procedure to compute WQI is presented below.
The quality rating of ith parameter (qi) is obtained as,
where, Vi is the actual (i.e., measured) value and Si is the permissible value of the ith parameter recommended by BIS (2012) at a given sampling site, Vid is the corresponding ideal value of that parameter (i.e., in pure water). All Vid values are equal to zero for drinking water parameters barring pH, whose ideal value is 7 (Bahita et al. 2021a, b). Note that for a water sample with pH value above (below) 7, the value of Si is taken as 8.5 (6.5).
Then the relative weight (Wi) for the ith parameter is computed from the following equation:
where, wi is the weight of each parameter and n is the total number of parameters. The wi values are referred from the previous studies (Batabyal and Chakraborty 2015; Ramakrishnaiah et al. 2009). In this study, based on the availability of permissible limits, eleven parameters are considered for computing WQI. These parameters along with their corresponding Si, wi and Wi are provided in Table 2.
Finally, the overall WQI was computed as follows,
An example of the WQI calculation for site 1 (Pali) is provided in Table S2 of the Supplementary Information. The overall water quality rating based on WQI is presented in Table 3, which is referred from previous studies (Bahita et al. 2021a, b; Rao et al. 2020; Taloor et al. 2020).
Correlation
The correlation, which is a measure of the association between two variables, can be evaluated in terms of the coefficient of correlation (r). The range of r is from − 1 to + 1. The correlation between the water quality parameters is generally obtained to assess their inter-dependence, which helps in understanding the dominant parameters (Mohamed et al. 2019; Popugaeva et al. 2020). This ultimately helps in decision-making to monitor the water quality. Although a highly positive or negative (i.e., close to + 1 or − 1) value of r typically indicates a strong correlation, it is essential to assess the statistical significance or confidence of the correlation (Helena et al. 2000; Rocha et al. 2019). This can be achieved by the p value test. The lower the p value, the more significant is the correlation and vice-versa (Helena et al. 2000; Popugaeva et al. 2020; Rocha et al. 2019). In this study, the significance of the correlation is tested at a confidence level of 90% (i.e., p value < 0.1).
Principal component analysis (PCA)
PCA is a multivariate statistical technique commonly used as a dimensionality reduction approach (Dutta et al. 2018; Xu et al. 2021). PCA extracts eigenvalues and eigenvectors from the covariance matrix of the originally correlated variables (Singh et al. 2004). The eigenvector consists of a list of coefficients, which are also regarded as loadings. The principal component is obtained by multiplying the loadings to the original set of variables (Andrade et al. 2020; Helena et al. 2000; Xu et al. 2019b, 2019c). Therefore, PCA results in forming a new set of orthogonal uncorrelated variables through linear combinations of originally correlated variables. This method was developed by Hotelling (1933) and is widely applied in studies pertinent to water quality assessments (Andrade et al. 2020).
Results and discussions
The measured values of the physicochemical water quality parameters are listed in Table S1 of the Supplementary Information. The statistics viz., maximum, minimum, average and standard deviation (SD), for all the water quality parameters are presented in Table 4. The acceptable pH range for drinking water is 6.5–8.5, based on the standards set by BIS (2012) and World Health Organization (WHO 2011). The minimum and maximum values of pH over 28 sites are 7.33 and 8.88, respectively. This shows the alkaline nature of water over the study area. There are seven sites with pH values exceeding the permissible limit of 8.5 (Table S1). Similarly, for EC, the minimum and maximum values are 240 and 7215 µS/cm, respectively. There are 15 sites with EC values exceeding the permissible limit of 2000 µS/cm. The concentration of carbonate is nil in 19 sites, whereas the maximum goes up to 48 mg/l at Jhanirola (Table S1). The concentration of bicarbonate ranges from 85 to 659 mg/l with an average and SD of 394.4 and 133.5 mg/l, respectively. The minimum and maximum values of chloride are respectively 21 and 2014 mg/l. There are five sites with chloride values exceeding the permissible limit of 1000 mg/l. The concentration of sulphate ranges from 5 to 1215 mg/l with an average of 276.8 mg/l and a SD of 301.1 mg/l. There are six sites with sulphate values exceeding the permissible limit of 400 mg/l. The concentration of nitrate ranges from 0 to 96 mg/l with an average and SD of 34.6 and 29 mg/l, respectively. There are eight sites with nitrate values exceeding the permissible limit of 45 mg/l. Similarly, the minimum and maximum values of fluoride over 28 sites are respectively 0.23 and 2.35 mg/l, with three sites exceeding the permissible limit of 1.5 mg/l. The parameters viz., nitrates and fluorides, can be very harmful above the permissible limit, as evident from several prior studies (Adimalla and Li 2019; Adimalla et al. 2018a, 2018b; Adimalla and Li 2019; Narsimha and Sudarshan 2017; Wu et al. 2015). However, high concentrations of nitrates and fluorides are reported in recent studies over the Indian region, which can be attributed to both natural and anthropogenic causes (Adimalla and Li 2019; Karunanidhi et al. 2019a, 2019b; Narsimha and Rajitha 2018; Narsimha and Sudarshan 2017). The cations viz., calcium, magnesium, sodium and potassium have exceeded their corresponding permissible limits at 5, 7, 18 and 3 sites, respectively. The concentration of silica ranges from 5 to 36 mg/l with an average of 21.6 mg/l and a SD of 6.6 mg/l. Similarly, the total hardness ranges from 100 to 1962 mg/l with an average and SD of 564.6 and 510.6 mg/l, respectively. There are eight sites with TH values exceeding the permissible limit of 600 mg/l. There is a significant variation in TH values, as evident from its high SD value.
Overall, the concentrations of the water quality parameters at some sites exceeded the permissible limits for drinking purposes recommended by BIS (2012). This may be due to different natural factors, e.g., soil salinization, dissolution of minerals, the residence time of water–rock interactions, etc. However, anthropogenic activities play a major role in the deterioration of groundwater quality, especially in the urban and peri-urban regions. The percentage of samples beyond the permissible limits for each parameter is listed in Table 5.
The physicochemical parameters are also represented by the Piper diagram, as shown in Fig. 2. Piper diagram (Piper 1944) is an effective way to represent the ion concentrations, which helps to recognize the hydrochemical types of groundwater. From the left-side triangle in Fig. 2, it is evident that the groundwater over the study area is mostly sodium type. Similarly, from the diamond-shaped plot of the Piper diagram, it can be observed that the groundwater of the study area is mostly SO4-Cl-Na type, followed by HCO3-Na type. The right-side triangle reveals the samples to be mostly bicarbonate type or chloride type; however, water from some sites of Gurgaon district also belong to the ‘no dominant’ type.

Piper plot showing the concentration of geochemical parameters of groundwater over the study area (the orange-colored quadrilateral-shaped and blue-colored star-shaped marks represent the sites from Faridabad and Gurgaon districts, respectively)
The geospatial mapping of various water quality parameters is carried out to visualize their variations, which also helps to identify the contaminated regions. The spatial variations of pH, EC, TH, fluoride, nitrate and sulphate over the study area are presented in Fig. 3. It can be observed that the groundwater in the western portions of the Gurgaon district is highly alkaline in nature. The EC values are beyond the permissible limit of 2000 µS/cm over a majority of the study area. Groundwater over a significant portion of the study area is affected by very high EC, i.e., more than 3500 µS/cm, which goes up to as high as 7215 µS/cm. The groundwater in these regions also possesses total harness beyond the permissible limits for human drinking purposes. Although fluoride concentrations are within the limit over a majority of the study area, some portions of the Gurgaon district are affected by fluoride concentrations above 1.5 mg/l. Similar inferences can also be drawn for nitrate, as evident from Fig. 3. The concentrations of fluoride and nitrate in groundwater are crucial as their increasing concentrations may have very harmful impacts on human health upon consumption. Therefore, groundwater in these regions should be handled with the utmost care, especially when considered for drinking purposes. The sulphate concentrations are beyond the permissible limit over a major portion of the Faridabad district.

Geospatial mapping of the water quality parameters over the study area
The three principal natural factors controlling the groundwater hydrochemistry are precipitation, evaporation, and rock weathering. To understand and visualize the influencing aspects, Gibbs (1970) created a simple and effective graphic comparing TDS concentration versus the weight ratios of Na+/(Na+ + Ca2+), or TDS versus the weight ratios of Cl−/(Cl− + HCO3−). The Gibbs diagram for the samples used in this study is presented in Fig. 4. Most of the samples are found in the rock weathering dominant region, indicating that water–rock interactions are the dominant natural mechanism in regulating groundwater chemistry. Evaporation has an impact on the groundwater too, while not a single sample showed precipitation dominance. The ratios of Cl−/(Cl− + HCO3−) ranged from 0.041 to 0.892. Similarly, the ratios of Na+/(Na+ + Ca2+) ranged from 0.378 to 0.968 with an average of 0.776, indicating a strong cation exchange in the groundwater system (Gao et al. 2019).

Gibbs diagram representing dominant factors of groundwater quality
The water quality index (WQI) was employed to assess the overall status of groundwater quality in the study area and its suitability for drinking purposes. The weighted-sum approach of WQI makes it convenient to communicate the water quality information to diverse audiences as it assimilates all the parameters into a single numerical value. The WQI of individual sites are computed and are presented in Table 6. The WQI values are geospatially interpolated through ArcGIS to prepare the spatial distribution map, as presented in Fig. 5. It can be seen that 10 out of 28 sites have WQI above 100 and therefore, groundwater at these sites is unsuitable for drinking purposes. The groundwater at Chandu possessed the highest WQI (= 212.1), which is indicative of the highest pollution amongst all the sites. On the other hand, Kasan was the least polluted site with a WQI of 34.36. The majority of the study area has groundwater of just acceptable quality. The north-western portions of the Gurgaon district and southwestern portions of the Faridabad district are suffering from very high WQI values indicating very poor quality of groundwater, which must be avoided for drinking.

Spatial distribution map of WQI over the study area
The inter-dependence amongst the 13 geochemical parameters over the 28 sites are assessed by determining their correlations and the results are presented in Fig. 6. Typically, a higher positive or negative value of r indicates a strong correlation; however, it is essential to assess the statistical significance or confidence of the correlation by p test. The statistically significant correlations (p value < 0.1) are represented by the asterisk marks (Fig. 6). The exact values of r and the corresponding p values are presented in Tables S3 and S4 of the Supplementary Information, respectively. It can be seen that the parameters mostly exhibited positive correlations amongst them. Particularly, the parameters viz., electrical conductivity, chloride, sulphate, calcium, magnesium, sodium, and total hardness showed significantly positive correlations amongst them. The concentration of these parameters in groundwater may be from the same source. The quality parameters from the same source are generally well correlated and vice-versa. However, these parameters showed a significantly negative correlation with pH. On the other hand, bicarbonates, nitrate, fluoride, potassium, and silica did not show any correlations, indicating their sources might differ.

Correlation (r) amongst the geochemical parameters in groundwater over the study area (the asterisk represents the correlation to be significant at 90% confidence level)
The 13 water quality parameters are also assessed for PCA, whose results are presented in Fig. 7. The individual and cumulative variances explained by each principal component (PC) are shown in Fig. 7a and b, respectively. Their exact values are also mentioned in Table S5 of the Supplementary Information. It can be observed that 95.72% of the variance is explained by PC1, whereas the percentage of variance explained by other PCs is much lower (Table S5).
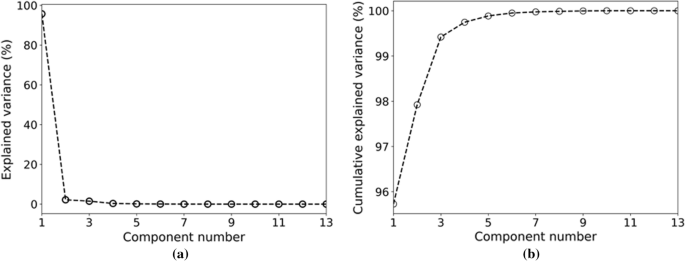
The results of PCA in terms of a individual variance and b cumulative variance, explained by the principal components
Typically, the PCs cumulatively explaining 90% of the total variance are considered as that would lead to a reduction of dimensionality with minimum loss of information (Bahita et al. 2021b). In this case, the PC1 is able to capture almost the entire variance of the 13 parameters, thereby indicating a significant reduction in dimensionality. Therefore, the loadings of the original parameters for only PC1 are presented in Table 7. It is evident that the parameters viz., EC, chlorides, and total hardness have relatively higher loadings for PC1. On the other hand, the loadings of pH, bicarbonates, nitrate, fluoride, potassium, and silica are very low.
Conclusions
This study assessed the groundwater quality over 28 sites from Faridabad and Gurgaon districts that have been subjected to rapid urbanization and industrialization in recent years. The concentrations of the water quality parameters (pH, EC, CO32−, HCO3−, Cl−, SO42−, NO3−, F−, Ca2+, Mg2+, Na+, K+, SiO2, and TH) are evaluated for hydrochemistry and human drinking suitability considering the permissible limits recommended by BIS (2012). The geospatial mapping of various water quality parameters is carried out to visualize their variations, which also helps to identify the contaminated regions. The number of sites exceeding the permissible limits of pH, EC, Cl−, SO42−, NO3−, F−, Ca2+, Mg2+, Na+, K+, and TH is obtained to be 7, 15, 5, 6, 8, 3, 5, 7, 18, 3, and 8, respectively. The overall water quality of the sites was assessed by WQI, which revealed 10 out of the 28 sites to be unsuitable for drinking purposes. The analysis of correlation amongst the parameters and their significance revealed most of the parameters to be positively correlated except pH, which showed a negative correlation with other parameters. From PCA, the first principal component is found to explain more than 95% of the total variance. This study highlights the impacts of anthropogenic activities, i.e., rapid urbanization and industrialization, on the water quality of the two districts. In view of these findings of human health risk, this study also recommends that groundwater use for municipal water supply should be handled with utmost care. Moreover, this study has assessed only the physicochemical parameters; however, groundwater quality may also be deteriorated due to heavy metals, microbial pollutants, and other emerging contaminants. Hence, regular water quality monitoring is necessary to ensure safety of human health.
Data availability
The data for water quality parameters are procured from the Central Ground Water Board (CGWB), Govt. of India. The data used in this study are provided in the Supplementary Information.
Code availability
Not applicable.
References
Adimalla N (2019) Groundwater quality for drinking and irrigation purposes and potential health risks assessment: a case study from semi-arid region of South India. Exposure and Health 11(2):109–123
Adimalla N (2020) Controlling factors and mechanism of groundwater quality variation in semiarid region of South India: an approach of water quality index (WQI) and health risk assessment (HRA). Environ Geochem Health 42:1725–1752
Adimalla N, Li P (2019) Occurrence, health risks, and geochemical mechanisms of fluoride and nitrate in groundwater of the rock-dominant semi-arid region, Telangana State, India. Hum Ecol Risk Assess 25(1–2):81–103
Adimalla N, Qian H (2019) Groundwater quality evaluation using water quality index (WQI) for drinking purposes and human health risk (HHR) assessment in an agricultural region of Nanganur, South India. Ecotoxicol Environ Saf 176:153–161
Adimalla N, Taloor AK (2020) Hydrogeochemical investigation of groundwater quality in the hard rock terrain of South India using Geographic Information System (GIS) and groundwater quality index (GWQI) techniques. Groundw Sustain Dev 10:100288
Adimalla N, Venkatayogi S (2018) Geochemical characterization and evaluation of groundwater suitability for domestic and agricultural utility in semi-arid region of Basara, Telangana State, South India. Appl Water Sci 8(1):44
Adimalla N, Li P, Venkatayogi S (2018a) Hydrogeochemical evaluation of groundwater quality for drinking and irrigation purposes and integrated interpretation with water quality index studies. Environ Process 5(2):363–383
Adimalla N, Vasa SK, Li P (2018b) Evaluation of groundwater quality, Peddavagu in Central Telangana (PCT), South India: an insight of controlling factors of fluoride enrichment. Model Earth Syst Environ 4(2):841–852
Adimalla N, Li P, Qian H (2019) Evaluation of groundwater contamination for fluoride and nitrate in semi-arid region of Nirmal Province, South India: a special emphasis on human health risk assessment (HHRA). Hum Ecol Risk Assess 25:1107–1124. https://doi.org/10.1080/10807039.2018.1460579
Adimalla N, Dhakate R, Kasarla A, Taloor AK (2020) Appraisal of groundwater quality for drinking and irrigation purposes in Central Telangana, India. Groundw Sustain Dev 10:100334
Aravinthasamy P, Karunanidhi D, Rao NS, Subramani T, Srinivasamoorthy K (2020) Irrigation risk assessment of groundwater in a non-perennial river basin of South India: implication from irrigation water quality index (IWQI) and geographical information system (GIS) approaches. Arab J Geosci 13:1125
Bahita TA (2019) Water quality assessment and pollution status of Upper Ganga Canal. PhD Thesis, Indian Institute of Technology Roorkee, India
Bahita TA, Swain S, Dayal D, Jha PK, Pandey A (2021a) Water quality assessment of Upper Ganga canal for human drinking. Climate impacts on water resources in India. Water science and technology library series. Springer, Cham, pp 371–392. https://doi.org/10.1007/978-3-030-51427-3_28
Bahita TA, Swain S, Pandey P, Pandey A (2021b) Assessment of heavy metal contamination in livestock drinking water of Upper Ganga Canal (Roorkee City, India). Arab J Geosci 14:2861. https://doi.org/10.1007/s12517-021-08874-7
Batabyal AK, Chakraborty S (2015) Hydrogeochemistry and water quality index in the assessment of groundwater quality for drinking uses. Water Environ Res 87(7):607–617
BIS (2012) Bureau of Indian Standards: Drinking water specifications. IS 10500: 2012, New Delhi, India
de Andrade CD, de Azevedo JP, Dos Santos MA, Assumpção RD (2020) Water quality assessment based on multivariate statistics and water quality index of a strategic river in the Brazilian Atlantic Forest. Sci Rep 10:22038
Dhal L, Swain S (2022) Understanding and modeling the process of seawater intrusion: a review. Advances in remediation techniques for polluted soils and groundwater. Elsevier, pp 269–290. https://doi.org/10.1016/B978-0-12-823830-1.00009-2
Dutta S, Dwivedi A, Kumar MS (2018) Use of water quality index and multivariate statistical techniques for the assessment of spatial variations in water quality of a small river. Environ Monit Assess 190(12):718
Gaikwad SK, Kadam AK, Ramgir RR, Kashikar AS, Wagh VM, Kandekar AM, Gaikwad SP, Madale RB, Pawar NJ, Kamble KD (2020) Assessment of the groundwater geochemistry from a part of west coast of India using statistical methods and water quality index. HydroResearch 3:48–60
Gao Z, Liu J, Feng J, Wang M, Wu G (2019) Hydrogeochemical characteristics and the suitability of groundwater in the alluvial-diluvial plain of southwest Shandong Province. China Water 11(8):1577
Gibbs RJ (1970) Mechanisms controlling world water chemistry. Science 170(3962):1088–1090
Guptha GC, Swain S, Al-Ansari N, Taloor AK, Dayal D (2021) Evaluation of an urban drainage system and its resilience using remote sensing and GIS. Remote Sens Appl Soc Environ 23:100601. https://doi.org/10.1016/j.rsase.2021.100601
Guptha GC, Swain S, Al-Ansari N, Taloor AK, Dayal D (2022) Assessing the role of SuDS in resilience enhancement of urban drainage system: a case study of Gurugram City, India. Urban Clim 41:101075. https://doi.org/10.1016/j.uclim.2021.101075
Helena B, Pardo R, Vega M, Barrado E, Fernandez JM, Fernandez L (2000) Temporal evolution of groundwater composition in an alluvial aquifer (Pisuerga River, Spain) by principal component analysis. Water Res 34(3):807–816
Hotelling H (1933) Analysis of a complex of statistical variables into principal components. J Educ Psychol 24(6):417–441
Jasrotia AS, Kumar A (2014) Groundwater Quality Mapping Based on the Geographical Information System (GIS) of Jammu District, Jammu and Kashmir India. J Spat Hydrol 12(1):1–21
Jasrotia AS, Bhagat BD, Kumar A, Kumar R (2013) Remote sensing and GIS approach for delineation of groundwater potential and groundwater quality zones of Western Doon Valley, Uttarakhand, India. J Indian Soc Remote Sens 41(2):365–377
Jasrotia AS, Kumar A, Singh R (2016) Integrated remote sensing and GIS approach for delineation of groundwater potential zones using aquifer parameters in Devak and Rui watershed of Jammu and Kashmir, India. Arab J Geosci 9(4):304
Jasrotia AS, Taloor AK, Andotra U, Bhagat BD (2018) Geoinformatics based groundwater quality assessment for domestic and irrigation uses of the Western Doon valley, Uttarakhand, India. Groundw Sustain Dev 6:200–212
Jasrotia AS, Taloor AK, Andotra U, Kumar R (2019) Monitoring and assessment of groundwater quality and its suitability for domestic and agricultural use in the Cenozoic rocks of Jammu Himalaya, India: a geospatial technology based approach. Groundw Sustain Dev 8:554–566
Kadam A, Wagh V, Jacobs J, Patil S, Pawar N, Umrikar B, Sankhua R, Kumar S (2021a) Integrated approach for the evaluation of groundwater quality through hydro geochemistry and human health risk from Shivganga river basin, Pune, Maharashtra, India. Environ Sci Pollut Res. https://doi.org/10.1007/s11356-021-15554-2
Kadam A, Wagh V, Patil S, Umrikar B, Sankhua R (2021b) Seasonal assessment of groundwater contamination, health risk and chemometric investigation for a hard rock terrain of western India. Environ Earth Sci 80:172
Kadam A, Wagh V, Patil S, Umrikar B, Sankhua R, Jacobs J (2021c) Seasonal variation in groundwater quality and beneficial use for drinking, irrigation, and industrial purposes from Deccan Basaltic Region, Western India. Environ Sci Pollut Res 28(20):26082–26104
Karunanidhi D, Vennila G, Suresh M, Subramanian SK (2013) Evaluation of the groundwater quality feasibility zones for irrigational purposes through GIS in Omalur Taluk, Salem District, South India. Environ Sci Pollut Res 20(10):7320–7333
Karunanidhi D, Aravinthasamy P, Subramani T, Roy PD, Srinivasamoorthy K (2019a) Risk of fluoride-rich groundwater on human health: remediation through managed aquifer recharge in a hard rock terrain, South India. Nat Resour Res 29:2369–2395
Karunanidhi D, Aravinthasamy P, Subramani T, Wu J, Srinivasamoorthy K (2019b) Potential health risk assessment for fluoride and nitrate contamination in hard rock aquifers of Shanmuganadhi River basin, South India. Hum Ecol Risk Assess 25(1–2):250–270
Karunanidhi D, Aravinthasamy P, Subramani T, Kumar M (2021a) Human health risks associated with multipath exposure of groundwater nitrate and environmental friendly actions for quality improvement and sustainable management: a case study from Texvalley (Tiruppur region) of India. Chemosphere 265:129083
Karunanidhi D, Aravinthasamy P, Subramani T, Muthusankar G (2021b) Revealing drinking water quality issues and possible health risks based on water quality index (WQI) method in the Shanmuganadhi River basin of South India. Environ Geochem Health 43(2):931–948
Kaur A, Sharma A, Parkash D, Mohiddin SK (2019) Ground water year book of Haryana State (2018–2019). Central Ground Water Board, Department of water resources, river development and Ganga rejuvenation, Ministry of Jal Shakti, Government of India
Khan A, Govil H, Taloor AK, Kumar G (2020) Identification of artificial groundwater recharge sites in parts of Yamuna River basin India based on remote sensing and geographical information system. Groundw Sustain Dev 11:100415
Li P, Wu J, Qian H, Lyu X, Liu H (2014) Origin and assessment of groundwater pollution and associated health risk: a case study in an industrial park, northwest China. Environ Geochem Health 36(4):693–712
Li P, Li X, Meng X, Li M, Zhang Y (2016) Appraising groundwater quality and health risks from contamination in a semiarid region of northwest China. Expo Health 8(3):361–379
Li P, Tian R, Xue C, Wu J (2017) Progress, opportunities, and key fields for groundwater quality research under the impacts of human activities in China with a special focus on western China. Environ Sci Pollut Res 24(15):13224–13234
Li P, Tian R, Liu R (2019) Solute geochemistry and multivariate analysis of water quality in the Guohua phosphorite mine, Guizhou Province, China. Expo Health 11(2):81–94
Li P, Karunanidhi D, Subramani T, Srinivasamoorthy K (2021) Sources and consequences of groundwater contamination. Arch Environ Contam Toxicol 80:1–10
Mohamed AK, Liu D, Song K, Mohamed MA, Aldaw E, Elubid BA (2019) Hydrochemical analysis and fuzzy logic method for evaluation of groundwater quality in the North Chengdu Plain, China. Int J Environ Res Public Health 16(3):302
Narsimha A, Rajitha S (2018) Spatial distribution and seasonal variation in fluoride enrichment in groundwater and its associated human health risk assessment in Telangana State, South India. Hum Ecol Risk Assess 24(8):2119–2132
Narsimha A, Sudarshan V (2017) Contamination of fluoride in groundwater and its effect on human health: a case study in hard rock aquifers of Siddipet, Telangana State, India. Appl Water Sci 7(5):2501–2512
Piper AM (1944) A graphic procedure in the geochemical interpretation of water-analyses. EOS Trans Am Geophys Union 25(6):914–928
Popugaeva D, Kreyman K, Ray AK (2020) Assessment of Khibiny Alkaline Massif groundwater quality using statistical methods and water quality index. Can J Chem Eng 98(1):205–212
Prasanth SS, Magesh NS, Jitheshlal KV, Chandrasekar N, Gangadhar KJ (2012) Evaluation of groundwater quality and its suitability for drinking and agricultural use in the coastal stretch of Alappuzha District, Kerala, India. Appl Water Sci 2(3):165–175
Rai SC, Saha AK (2015) Impact of urban sprawl on groundwater quality: a case study of Faridabad city, National Capital Region of Delhi. Arab J Geosci 8(10):8039–8045
Ramakrishnaiah CR, Sadashivaiah C, Ranganna G (2009) Assessment of water quality index for the groundwater in Tumkur Taluk, Karnataka State, India. E-J Chem 6(2):523–530
Rao NS, Sunitha B, Adimalla N, Chaudhary M (2020) Quality criteria for groundwater use from a rural part of Wanaparthy District, Telangana State, India, through ionic spatial distribution (ISD), entropy water quality index (EWQI) and principal component analysis (PCA). Environ Geochem Health 42(2):579–599
Rocha CH, Casquin AP, Pereira RO (2019) Correlations chart: Tool to analyse the dynamics of water quality parameters. Rev Bras Eng Agríc Ambient 23:383–390
Sahoo S, Swain S, Goswami A, Sharma R, Pateriya B (2021) Assessment of trends and multi-decadal changes in groundwater level in parts of the Malwa region, Punjab, India. Groundw Sustain Dev 14:100644
Singh T, Bhatia AK (2013) Ground water information booklet: Faridabad District, Haryana. Central Ground Water Board, Ministry of Water Resources, Government of India
Singh KP, Malik A, Mohan D, Sinha S (2004) Multivariate statistical techniques for the evaluation of spatial and temporal variations in water quality of Gomti River (India)—a case study. Water Res 38(18):3980–3992
Swain S, Mishra SK, Pandey A (2021) A detailed assessment of meteorological drought characteristics using simplified rainfall index over Narmada River Basin, India. Environ Earth Sci 80:221. https://doi.org/10.1007/s12665-021-09523-8
Swain S, Mishra SK, Pandey A, Kalura P (2022) Inclusion of groundwater and socio-economic factors for assessing comprehensive drought vulnerability over Narmada River Basin, India: a geospatial approach. Appl Water Sci 12:14. https://doi.org/10.1007/s13201-021-01529-8
Taloor AK, Pir RA, Adimalla N, Ali S, Manhas DS, Roy S, Singh AK (2020) Spring water quality and discharge assessment in the Basantar watershed of Jammu Himalaya using geographic information system (GIS) and water quality Index (WQI). Groundw Sustaine Dev 10:100364
Thilagavathi N, Subramani T, Suresh M, Karunanidhi D (2015) Mapping of groundwater potential zones in Salem Chalk Hills, Tamil Nadu, India, using remote sensing and GIS techniques. Environ Monit Assess 187:164
UNDESA (2016) The sustainable development goals report 2016. United Nations Department of Economic and Social Affairs. https://doi.org/10.18356/3405d09f-en
Venkatesan G, Subramani T, Karunanidhi D, Sathya U, Li P (2021) Impact of precipitation disparity on groundwater fluctuation in a semi-arid region (Vellore district) of southern India using geospatial techniques. Environ Sci Pollut Res 28(15):18539–18551
Wagh V, Panaskar D, Aamalawar M, Lolage Y, Mukate S, Adimalla N (2018) Hydrochemical characterisation and groundwater suitability for drinking and irrigation uses in semiarid region of Nashik, Maharashtra, India. Hydrospatial Analysis 2(1):43–60
Wagh VM, Mukate SV, Panaskar DB, Muley AA, Sahu UL (2019a) Study of groundwater hydrochemistry and drinking suitability through water quality index (WQI) modelling in Kadava river basin, India. SN Appl Sci 1(10):1251
Wagh VM, Panaskar DB, Jacobs JA, Mukate SV, Muley AA, Kadam AK (2019b) Influence of hydro-geochemical processes on groundwater quality through geostatistical techniques in Kadava River basin, Western India. Arab J Geosci 12:7
Wagh V, Mukate S, Muley A, Kadam A, Panaskar D, Varade A (2020) Study of groundwater contamination and drinking suitability in basaltic terrain of Maharashtra, India through PIG and multivariate statistical techniques. J Water Supply Res Technol AQUA 69(4):398–414
WHO (2011) Guidelines for drinking water quality, 4th edn. World Health Organization, Geneva
Wu J, Li P, Qian H, Duan Z, Zhang X (2014) Using correlation and multivariate statistical analysis to identify hydrogeochemical processes affecting the major ion chemistry of waters: a case study in Laoheba phosphorite mine in Sichuan, China. Arab J Geosci 7(10):3973–3982
Wu J, Li P, Qian H (2015) Hydrochemical characterization of drinking groundwater with special reference to fluoride in an arid area of China and the control of aquifer leakage on its concentrations. Environ Earth Sci 73(12):8575–8588
Xu P, Feng W, Qian H, Zhang Q (2019a) Hydrogeochemical characterization and irrigation quality assessment of shallow groundwater in the Central-Western Guanzhong Basin, China. Int J Environ Res Public Health 16(9):1492. https://doi.org/10.3390/ijerph16091492
Xu P, Li M, Qian H, Zhang Q, Liu F, Hou K (2019b) Hydrochemistry and geothermometry of geothermal water in the central Guanzhong Basin, China: a case study in Xi’an. Environ Earth Sci 78(3):87. https://doi.org/10.1007/s12665-019-8099-1
Xu P, Zhang Q, Qian H, Li M, Hou K (2019c) Characterization of geothermal water in the piedmont region of Qinling mountains and Lantian-Bahe group in Guanzhong Basin, China. Environ Earth Sci 78(15):442. https://doi.org/10.1007/s12665-019-8418-6
Xu P, Zhang Q, Qian H, Li M, Yang F (2021) An investigation into the relationship between saturated permeability and microstructure of remolded loess: a case study from Chinese Loess Plateau. Geoderma 382:114774. https://doi.org/10.1016/j.geoderma.2020.114774
Zhang Q, Xu P, Qian H (2019) Assessment of groundwater quality and human health risk (HHR) evaluation of nitrate in the Central-Western Guanzhong Basin, China. Int J Environ Res Public Health 16(21):4246. https://doi.org/10.3390/ijerph16214246
Zhang Q, Xu P, Qian H (2020a) Groundwater quality assessment using improved water quality index (WQI) and human health risk (HHR) evaluation in a semi-arid region of northwest China. Expo Health 12:487–500. https://doi.org/10.1007/s12403-020-00345-w
Zhang Q, Xu P, Qian H, Yang F (2020b) Hydrogeochemistry and fluoride contamination in Jiaokou Irrigation District, Central China: assessment based on multivariate statistical approach and human health risk. Sci Total Environ 741:140460. https://doi.org/10.1016/j.scitotenv.2020.140460
Zhang Q, Qian H, Xu P, Hou K, Yang F (2021a) Groundwater quality assessment using a new integrated-weight water quality index (IWQI) and driver analysis in the Jiaokou Irrigation District, China. Ecotoxicol Environ Saf 212:111992. https://doi.org/10.1016/j.ecoenv.2021.111992
Zhang Q, Qian H, Xu P, Li W, Feng W, Liu R (2021b) Effect of hydrogeological conditions on groundwater nitrate pollution and human health risk assessment of nitrate in Jiaokou Irrigation District. J Clean Prod 298:126783. https://doi.org/10.1016/j.jclepro.2021.126783
Zhang Q, Xu P, Chen J, Qian H, Qu W, Liu R (2021c) Evaluation of groundwater quality using an integrated approach of set pair analysis and variable fuzzy improved model with binary semantic analysis: a case study in Jiaokou Irrigation District, east of Guanzhong Basin, China. Sci Total Environ 767:145247. https://doi.org/10.1016/j.scitotenv.2021.145247
Acknowledgements
The authors would like to thank Central Ground water Board (CGWB), Government of India, for provision of data. The constructive suggestions of both anonymous reviewers are thankfully acknowledged.
Funding
The author(s) received no specific funding for this work.
Author information
Authors and Affiliations
Contributions
SS: conceptualization, data curation, formal analysis, visualization, writing—original draft. SS: data curation, visualization, writing—review and editing. AKT: writing—review and editing.
Corresponding author
Ethics declarations
Conflict of interest
The authors declare no competing interest.
Ethical approval
Not applicable.
Consent to participate
Not applicable.
Consent for publication
Not applicable.
Additional information
Publisher's Note
Springer Nature remains neutral with regard to jurisdictional claims in published maps and institutional affiliations.
Supplementary Information
Below is the link to the electronic supplementary material.
Rights and permissions
Open Access This article is licensed under a Creative Commons Attribution 4.0 International License, which permits use, sharing, adaptation, distribution and reproduction in any medium or format, as long as you give appropriate credit to the original author(s) and the source, provide a link to the Creative Commons licence, and indicate if changes were made. The images or other third party material in this article are included in the article's Creative Commons licence, unless indicated otherwise in a credit line to the material. If material is not included in the article's Creative Commons licence and your intended use is not permitted by statutory regulation or exceeds the permitted use, you will need to obtain permission directly from the copyright holder. To view a copy of this licence, visit http://creativecommons.org/licenses/by/4.0/.
About this article

Cite this article
Swain, S., Sahoo, S. & Taloor, A.K. Groundwater quality assessment using geospatial and statistical approaches over Faridabad and Gurgaon districts of National Capital Region, India. Appl Water Sci 12, 75 (2022). https://doi.org/10.1007/s13201-022-01604-8
Received:
Accepted:
Published:
DOI: https://doi.org/10.1007/s13201-022-01604-8