
Abstract
Unpredictability by local farmers, insufficiency and seasonality of rainfall have severely affected productivity of rain-fed agriculture in Cheleleka watershed. Thus, irrigated agriculture has a paramount role in lifesaving and insuring food security. Mismanagement of irrigation water influences agricultural productivity and efficiency of water uses. This study aimed to assess performance and potential of traditional surface irrigation schemes and to survey conflicts resulting from irrigation water use and management. Three major rivers in Cheleleka watershed (Wesha, Worka and Wodesa) where traditional irrigation has been widely practiced were selected purposively. The irrigable areas of each river were identified and categorized into upper, middle and lower parts based on its related location in the watershed. The soil samples, infiltration rate, long time meteorology, conveyance efficiency, irrigable areas and discharge at diversion points were analyzed. In addition, 49 households in irrigable areas of the three rivers were interviewed and three focus group discussions were held. About 0.16 and 0.14 m3/s of discharge were recorded in irrigation areas of the middle Wodesa and upper Worka rivers, respectively. The conveyance efficiency of the traditional surface irrigation canals at middle Wodesa and upper Wesha and Worka was less than 50%. The general potentials of surface irrigation water across the three perennial rivers were greater than 23 million cubic meters per year. The moisture stored in root zone or readily available water in existing farmers’ practices was found far beyond the carrying capacity of the soils, especially in middle Wodesa and upper Wesha and Worka areas. Performances of the traditional surface irrigation schemes are very low and had aggravated irrigation water losses and contributed to crop water scarcity and conflicts. The results also showed that farmers in the upper parts of the area and close to the diversion points excessively irrigate the cropland, whereas those far away and in lower watersheds of each river receive irrigation water insufficiently and irregularly. Even though there was irrigation management system/committee, the set principle was not respected.
Introduction
Water is an irreplaceable resource used for numerous economic, social, spiritual, social and representative purposes, on which the existence of life depends (Sehring and Diebold 2012). Thus, water has a special status and is often at the beginning of creation accounts. According to Thakkar (1999), irrigation has acquired increasing significance in agriculture over the biosphere in which 8 million ha land was irrigated in 1800 and 40 million ha was irrigated in 1900. Irrigated agriculture is one of the most critical human activities sustaining civilization. The current world population of 6.8 billion people is sustained in a large part by irrigated agriculture. United States Department of Agriculture statistics display that 17% of farm crop land in the USA is irrigated (Michael 2010). Yet this acreage produces nearly 50% of total US crop revenues. According to the Food and Agricultural Organization, the approximately 1260 million ha under rain-fed agriculture, corresponding to 80% of the world’s total cultivated land, supplies 60% of the Globe’s food, while the 277 million ha cover by irrigation, the remaining 20% of land under agriculture, donates the other 40% of the food supplies. On average bases, irrigated crop yields are 2.3 times higher than those from rain-fed land. These figures prove that irrigated agriculture will remain to play an important role as an important donor to the worlds food supply (Michael 2010).
In Ethiopia, agriculture remains major economic activity that comprises high proportion of employment, foreign exchange and GDP. The traditional rain-fed agriculture, which is susceptible to the challenges of climate change, has been dominantly practiced for long time. This doesn’t mean that irrigated agriculture is resistant to climate change; but it is less vulnerable than rain-fed agriculture. Irrigation is an energetic component of agricultural production in Ethiopia, and the modern irrigated cultivation was started in the country during 1960s in the middle Awash valley (Abegaz 2006). Due to population burden and increasing request for food, supplementary irrigation gradually becomes vital in dry, cool and humid zones of Ethiopia (Chandrasekaran et al. 2009). Ethiopia has a huge cultivable land covering about 30–70 million ha, but only about 15 million ha is presently cultivated with recent irrigation schemes covering about 640,000 ha (Awulachew et al. 2016). However, the study estimates that total irrigable land potential in the country is 3.7 million ha assuming use of currently available technologies. Among the irrigation methods, surface irrigation, which is public in different part of the world (Awulachew et al. 2016), has been dominantly experienced in modern and traditional irrigation. Old-style surface irrigation accounts about 56% of the total countrywide irrigated zones (Awulachew et al. 2016).
Efficient and effective utilization of irrigation water has been major challenge in irrigation scheme. Long-lasting irrigation water supply technique and effective water management approaches are pressing needs nowadays with changing climate (Khokan et al. 2016). Efficient and adequate dosage of irrigation water advances crop production and raises water use efficiency for future purposes (Taddesse and Peden 2001). The aim of irrigation water management is to keep the water level in the root zone within a range where crop yield and quality are not damaged due to either inadequate or excess water (Geremew et al. 2008). Therefore, capable use and appropriate allocation of irrigation water are energetic for durability of cultivation in water scarce areas (Ashraf et al. 2007; Khalkheili and Zamani 2009). However, irrigation water use has been dared by many factors including quality and accessibility of water, types of crop grown, struggle in sharing water, wasteful water use practices (Wolf et al. 1999; OECD 2005; Kameri-Mbote 2007; Tulloch 2009).
Crops need water during growth period, and it is vital to uphold the amount of readily available moisture in the soil by irrigation (Modi 1995). Different crops require different quantities of water at different growth stages. The irrigation system may not be designed to supply the total amount of moisture required for crop growth. Both excessive and deficit water applications have negative impacts including retarding of crop performances. As a matter of practicality, depth of water application under traditional surface irrigation practices may exceed or be less than the optimal depth of water required for a given crop. Management of water at field level is relatively low cost, more practicable, and simply workable and can be realized in short duration of time (Tagar et al. 2012). Benefit and hazard assessment of irrigation water has now become a paramount importance not only to point out where the problem lies but also helps to identify alternatives that can be more effective.
In central Rift Valley areas, traditional surface irrigation has been widely implemented by using lakes and rivers. In Cheleleka watershed, the traditional surface irrigation schemes have been implemented for about four decades. In recent years, the demand for irrigated agriculture is increasing due to growing awareness, climate change and increase in human population. This is the only part of Lake Hawassa from which perennial water flow to the lake. The nearby towns such as Hawassa and Shashemene get water from this watershed. The increasing demand of irrigation water and inefficient utilization of the water resource can influence agricultural productivity and water supply to the lake and towns. In the area, there were no studies that can address the existing and divergent problems occurring on traditional surface irrigation water use. Therefore, this study was aimed to assess performance and potential of traditional surface irrigation schemes and survey conflicts resulting from irrigation water use and management.
Materials and methods
Site description
The Cheleleka watershed is located in Central Rift Valley of Ethiopia, at about 260 km from Addis Ababa in south direction. The watershed is geographically situated between 6.280 and 7.20N of latitude and 38.50 to 38.70E of longitude (Fig. 1). It covers the land area of 8030 ha (Table 1). The watershed consists of a chain of hills, and the elevation ranges up to 1700–2580 m above sea level. Mean annual rainfall of the area ranges from 950 mm at lower part of the watershed to the 1500 mm at upper part of the watershed. Rainfall pattern of the area is bimodal type. The short rainy season occurs from February to May, and the long rains extend from June to September. The mean temperature in the foothills varies from 17 to 19 °C. The soil is mainly young and volcanic origin, and sandy clay loam dominates the top soil (Table 6). Few remnant native forests consist of Podocarpus falcatus, Croton macrostachyus, Cordia africana, Milletia ferugenia, Celtis africana and Aningeria adlof fridrich. The dominantly planted tree species include Eucalyptus species, Grevillea robusta, Pinus patula, Persea americana and cupressus lusitanica in the middle parts of the watershed. Sugar cane and khat (Chata edulis) have been widely grown in middle and lower watershed.

Study area map by land use
Enset (Enset ventricosum) is a staple, perennial crop which is dominantly grown at homestead. Annual crops such as wheat and barley are widely cultivated in the upper part of the watershed. The middle and lower parts of the watershed are mainly covered with Khat and sugar cane which dominantly use the supplementary irrigation water. In lower watershed, maize and potato have been grown. The traditional irrigation system was one of the land use types, and it had area coverage of more than 85% in relation to the other land uses, especially in the middle and lower parts of the watershed. In the upper part of the watershed, because of topography, irrigation has not been commonly practiced.
In the Cheleleka watershed, the middle and lower parts of the watershed where traditional surface irrigation has been commonly practiced was identified. Location and topography of the area on which the irrigation system was implemented in three major rivers, namely Wesha, Worka and Wodesa, have been considered in this study. The traditional surface irrigation scheme constructed at the middle (hillside/steeply slope) of the area was considered as the upper end of irrigation system, and the irrigated area was categorized as upper, middle and lower parts. The lower part is close to the Cheleleka wetland. The land use in the considered area is described in Table 1.
Discharge estimation was conducted at the upper stream beyond diversion point during 12/02/2014 across the existing perennial rivers that join Cheleleka wetland. The data provided in Table 1 were the stream flow rate throughout dry period of the year (November, December, January and February). Farmers dwelling in Wondo Genet Watershed had been using these rivers for irrigation (complete irrigation while dry period approximately 6 months and supplemental irrigation during rare rainfall season) (Table 2).
Methodology
Soil and discharge analysis
The most important biophysical data collected in this study include soil, climate, crop and water data. Soil samples were taken from 0 to 40 cm soil depth. The samples were collected through grid method (equal division of irrigated land into segments). The irrigation area of each river was divided into upper, middle and lower parts. In each part, soil samples were collected from 10 m × 10 m quadrant. Using this process, a total of eighty-four soil samples were collected and used to determine moisture kept in the root zone, application efficiency, distribution efficiency and texture (Hillel 1980; Brady and Weil 2002). The soil moisture content at field capacity and wilting point (mm/m) was investigated in the laboratory using the pressure membrane at 1/3 and 15 atm suction pressure, correspondingly (Horst et al. 2005).
Irrigation time, amount and frequency have been recorded while farmers exercise the irrigation activity. Using core sampler, 21 soil samples were collected from undisturbed soils adjacent to irrigated field. For soil water content determination, gravitational method was used as suggested by Hillel (1980). Water infiltration was measured on irrigation ground using double-ring infiltrometer, and elapsed time was noted using stopwatch (Hillel 1980). The experiment was replicated three times on the same field, and a total of twenty-one measurements were conducted over seven sites (Fig. 2).

Irrigation water measurement along canals as farmers exercises
In the absence of weirs and gates, estimation of discharge was done on a uniform section of the channel at both inlet and outlet of conveyance systems. The shape was noted and dimensions of the channels were measured. In addition, the depths of flow were determined on the same section. Observations and measurements have been made to the selected parameters such as channel discharge, application depth and field size as indicated by FAO (1989). Floating was done over 50 m distance for flow velocity, and cross-sectional area had been determined to estimate flow rate (Majumdar 2000; Machibya et al. 2004). To investigate performances of the traditional surface irrigation schemes in the area, existing diversion points (seven sites) were selected from three rivers considering upper, middle and lower parts of the irrigation area in each river. In this case the word “upper” represents the higher elevation where irrigation water has been diverted firstly. Middle indicates the average elevation where irrigation water was diverted among the two elevations. The lower indicates the lower elevation where the last irrigators (irrigation field) were located. Generally, 42 channel discharge measurements were conducted at inlet/outlet of irrigation channels. All the relevant data for the calculations were sparingly collected. Accordingly, the following irrigation scheme performance indicators were employed.
where Ec is conveyance efficiency (%), Q1 is water flowing into the system (m3/s), Q2 is water flowing out of the system (m3/s)
where Ea is irrigation water application efficiency in %, WZr is irrigation water stored in the root zone in mm, WF is irrigation water applied to the field in mm
where Ed = water distribution efficiency, D = mean depth of water stored during irrigation (mm), d = average of the absolute values of deviations from the mean (mm)
where Es is surface irrigation scheme efficiency
where SRIS is seasonal relative irrigation supply, TVWdiverted is seasonal volume of irrigation water diverted (m3), TVWdemand is seasonal volume of irrigation water demanded (m3).
The following indicators were used to evaluate the performances of the irrigation systems in terms of yield and financial values. Particularly, the latter will be used to compare the economic return when different crops are cultivated using irrigation.
where OPHA is output per harvested area (tons/ha), production is in Isuzu, and ICA is irrigated cropped area in m2
where OPHA is output per harvested area (US$/ha), LVP is local value of production (BIRR).
In order to characterize water-holding capacity (WHC) of the soils, soil samples were taken to the laboratory. Texture of the soil sample was analyzed (Brady and Weil 2002). Proportions of sand and clay were used as an input to the newest version of the Soil Hydraulic Properties Calculator software as indicated by Saxton et al. (1986) to examine soil water indicative parameters such as FC, PWP, bulk density and saturated hydraulic conductivities. Therefore, water-holding capacity of soils like total available water (TAW) and readily available water (RAW) has been calculated using equations given below as indicated by (FAO 2006).
where TAW is the total available soil water in the root zone (mm), θFC is the soil water content at field capacity (m3/m3), θPWP is the soil water content at wilting point (m3/m3), Zr is the rooting depth (m)
where RAW is the readily available soil water in the root zone (mm) and ρ is an average fraction of TAW (total available water) that can be depleted from the root zone before moisture stress (reduction in ET) occurs [0–1].
Frequencies of irrigation water application were in accordance with daily crop water demand. It was calculated by the equation provided below as ordered by (FAO 1977).
where Etc is daily crop water use in mm/day.
The irrigation depth stored within crop root zone as farmers’ practices has been determined by the equation given below.
where Wai = moisture content of the ith layer of the soil after irrigation (at field capacity) on oven-dry weight basis (%), Wbi = moisture content of the ith layer of soil before irrigation on oven-dry weight basis, (%), ASi = apparent specific gravity of the ith layer of soil, Di = depth of ith layer of the soil (D is 40 cm for this study), n = number of layers in the root zone (n = 1 for this study).
The rate at which a soil could absorb water was determined using the equation below as indicated by Panda (2005).
where IR represents infiltration rate (cm/h), Qw quantity of water infiltrated (cm), Tt elapsed time (min)
Climatic data of the area were gathered from national meteorological agency. Precipitation and minimum and maximum temperatures on daily bases were acquired and used to indicate climatic condition over long period (1983–2012). The 2014 weather data were obtained from meteorological station and used as an input into the equation suggested by Hargreaves. The other climatic parameters and crop coefficient were assimilated from FAO (2006). The data were used to estimate the water requirement of the most irrigated crops (Sugarcane, khat, potato and fruit (avocado) in the area. The irrigated area was determined using GPS points and GIS software interface.
where ETo is the reference evapotranspiration, Tmax is the daily maximum temperature, Tmin is the daily minimum temperature, Tmean is the mean temperature, Ra = extra-terrestrial radiation (mm/day), ETc is the crop water requirement, and Kc is the crop coefficient.
House survey and focus group discussion
From upper, middle and lower parts of the study area, a total of 49 households were selected randomly out of 1240 total households. The heads of household were allowed to respond on a questionnaire about their irrigation practice, irrigation water use scheduling, challenges in the irrigation water use, type of crop they cultivate by using irrigation water, performance of irrigation, and conflict resolution mechanism on irrigation water use. In addition, three focus group discussions were conducted in three parts of the study area. The focus group discussions were held with group of people encompassing irrigators, non-irrigators, elderly persons, development agents and women in study area. Location of the irrigation site, wealthy, education and age (experience) have been used as criteria for sample selection. Proportions were made to select representative householder farmers both for interview and focus group discussion.
Data analysis
Descriptive statistics such as percentage and average were applied to analyze data of irrigation water discharge, water use efficiency, and water-holding capacity of the soil. The data collected from householder farmers has been analyzed on percentage bases.
Results and discussion
Performance and potentials of the traditional irrigation schemes
Majority of the irrigation schemes practiced in Cheleleka watershed were made of locally available materials such as stones, logs and mud implemented by using indigenous knowledge of irrigators. Concrete canals were constructed in a few main canals on Wesha and Worka rivers. Following traditionalist of the system, variable quantities of irrigation water were taken for surface irrigation at different points along rivers. Accordingly, larger discharges were recorded at the middle irrigated area of Wodesa river and the upper irrigated area of Worka river (Table 3). Relatively minimum discharge was noted at upper irrigated area of Wodesa river which implies that there were no proper dosage concerning the cultivation area. These have created inequity of irrigation water in mid and lower parts of the watershed in the irrigated area (Table 3). These indicated that users at upper irrigation area of Worka river and those closer to irrigation water in middle parts of Wesha and Wodesa rivers had an opportunity of over irrigation. Due to the limited amount of water resources, the efficient and equitable use of water is of paramount importance. Improper irrigation water dosages were brought large difference of losses. The larger irrigation water diverted was implied for lower conveyance efficiency and larger losses. Particularly, irrigation canals at the middle part of irrigation area in Wodesa, and the upper part of irrigation area in Wesha and Worka rivers, were less efficient, even less than 50%. Continued water application can end in extreme runoff, while low rates of application incline to result in sluggish water advance, producing deprived water distribution and deep drainage losses (Jha et al. 2016). For earthen or unlined irrigation channels, it would be up to 70% (Halcrow and Partners 1992). So, out of the diverted irrigation water from the rivers, more than 50% had been lost before reaching the field. The basic purpose of irrigation is to supply plants with required amount of water to optimize yield. It is the major consumer of water taking 53% of the total annual amount used (Norman 1999). This indicates that the schemes/irrigation channels performance was very low. Flood irrigation was not effective, as most of the water is vanished by deep percolation or leakage before it reaches the field, and occasionally the water not even reaches the end of the field (Austin 2002). The primary prevalence of the event was earth channels.
Irrigation time was noted as farmers’ exercises. As indicated in Table 3, different sizes of irrigated land have been watered with inappropriate irrigation water dose. This can be derived by elongated time of irrigation. Time elapsed while irrigation water application would be matched with sizes of irrigated land. The larger the area irrigated, the longer the elapsed time and much water needs to be applied. In contrast, the smaller the area irrigated, the shorter the elapsed irrigation time and comparatively the smaller the irrigation water quantity required. Long irrigation time was observed at the middle irrigation area of Wesha and Wodesa rivers. This is because of the difference in irrigable area in the respective parts of the watershed.
The depth of irrigation water used must be matched with the crop type to be cultivated. The irrigation depth was not in accordance with the crop type. Too different quantity of irrigation water has been applied to the same crop across the irrigated field. This indicates that there were improper dosage of irrigation water and probability of taking others share which leads to over irrigation at upper areas of irrigation system in Worka River. Similar problem was observed in middle irrigation area of Wodesa River and no irrigation water diversion at middle Worka river.
The efficient use of the existing irrigation water potential will ensure its allocation and resolve irrigation water disputes among farmers across streams. Controlled flooding and furrow irrigation methods were in use by the farmers in the study area. Under controlled flooding, irrigators have been directed water flow using local farm tools. These were common for irrigating potato, khat and avacado (Wesha upper stream) in the area. Misuse of irrigation water was familiar with this method. Furrow irrigation method was used with row crops, particularly for sugarcane. According to Malano et al. (1996), in the traditional surface irrigation, water control was supported out manually based on the skill of the irrigator (Fig. 3). In this practice, the irrigator cuts off the water supply when the advance is completed. It leads to severe water losses except it was appropriately checked while irrigating fields (Majumdar 2000).

Traditional surface irrigation water application systems of farmers
Complete irrigation was being in use intensively during dry period. In addition, existence of dry spells among successive rainfall events and its uneven distribution have initiated continuous use of irrigation water in the Cheleleka watershed. Following low water-holding capacity of soils, irrigation water was applied as a supplementary during erratic rainy season. Consequently, the general potentials of surface irrigation schemes at diversion points across the three perennial rivers in Table 4 were about 3.8-fold of water applied into the field. Since 12,647 m2 areas had consumed 4115 m3 of irrigation water within 39:20 h of irrigation time, the surface irrigation potential at diversion point will irrigate 7187 ha of land. These were based on practices of traditional surface irrigation water application of farmers in Cheleleka watershed. Misuse of irrigation water has seriously affected crop production at mid- and lower irrigation of each river. This has initiated conflict over irrigation water among farmers located at down streams in the study area.
The figure indicates that there was a variation in irrigation water application in crop root zone among different farm plots. The average moisture stored in the crop root zone has been estimated as 45 mm at the upper part of irrigated area in Wodesa River on khat production and a maximum of 79 mm at the middle part of irrigated area in Wesha River on sugarcane cultivation. These were taken as readily available water. Taking this into consideration, irrigation interval was calculated. A minimum frequency of 7 days for Wodesa upper stream for khat cultivation and a maximum frequency of 10 days at middle part of irrigated area in Wesha River for sugarcane production were recorded. The standard deviation in Table 5 indicated that the soil moisture stored across test points was variable. These estimations were based on irrigation water application by farmers in the area.
Water distribution efficiency indicates degree of uniformity of water infiltrated into the soil. Analyses were done to understand that the system was applying irrigation water evenly throughout the irrigated area/crop. It is a key indicator of the performance of the irrigation schemes. Very low distribution efficiency was observed in the upper irrigation area of Wesha River, and greater or equal to 60% was observed across the field (Fig. 4). Distribution efficiency of less than 70% is categorized as poor, between 70 and 90% is good, and beyond 90% is excellent (Hansen 1960). Distribution efficiency of less than 70% was observed on four irrigated fields. With surface irrigation, uneven distribution of water will cause drainage losses and possibly under-irrigation causing very low water use efficiency (FAO 1977).
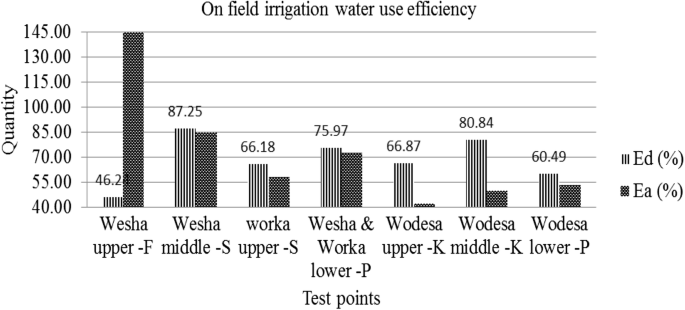
Traditional surface irrigation water use efficiency in study area. Note F fruit, S sugarcane, P potato, K khat, Ed distribution efficiency, Ea application efficiency
The following field irrigation water measurements 35, 73 and 69% were calculated as channel conveyance, water application and water distribution efficiency, respectively. Irrigation schemes efficiency was calculated based on average values of the efficiency. The overall irrigation schemes efficiency in Cheleleka watershed was 17%, which was very poor. The system efficiency is expected 60% as indicated by (Halcrow and Partners 1992; Merwe et al. 1997). Therefore, the surface irrigation scheme in study area was performing poorly (Hansen 1960; Halcrow and Partners 1992; FAO 1977; Merwe et al. 1997), indicating that irrigation water was mismanaged.
Climatic condition in Cheleleka watershed
Climatic data have been collected from meteorological agency of Ethiopia. The 32-year monthly rainfall analysis showed lower values for months November, December, January and February. This could have initiated intensive and continuous uses of irrigation water in those months. The daily temperature data also indicated the need for irrigation water application for field crop cultivation. These were the reason why irrigation water used highly during dry periods (Table 3).
The daily crop evapotranspiration was calculated for major crops cultivated in the study area (Fig. 6). Based on the crop type, the daily crop water requirement was variable. Average Etc in February was 8.34, 7.67, 7 and 8 mm/day for sugarcane, potato, khat and avocado, respectively. These have indicated that irrigation water would be applied in different amounts for different field crops (Fig. 5).

Average monthly precipitation and daily temperature at Wondo Genet Watershed (1980–2012)
Hydraulic properties of soils
Irrigated area was dominated by sandy clay loam (Table 5). Bulk density of the soils ranges from 1.36 up to 1.53 g/cm3. The saturated hydraulic conductivity of the soils ranges between 0.21 and 1.36 in./h. The average moisture stored in the crop root zone was 64 mm (Table 4). However, based on textural class of the soil, average water-holding capacity of the soil was 30 mm. This shows that the irrigation water stored in the root zone was more than twofold of the soils carrying capacity (Table 6). The irrigation water to be stored in the crop root zone needs to be adjusted according to water-holding capacity of the soil in the study area.
Since field works on irrigation water and soil moisture measurement were conducted in February, crop water requirements of this month have been used. As to the calculated RAW from the hydraulic properties of soils calculator suggested by Saxton and Rawls (2006) and daily crop water requirement, the actual irrigation interval was estimated. As indicated in Fig. 6, irrigation interval ranges between 3 and 5 days depending on soil, crop and climate of the site. Irrigation schedule was calculated based on irrigation depth (RAW) and Etc as indicated in FAO (2006). The indicated RAW must be applied on the specified day (Table 7). The irrigation interval in use by the farmers needs to be adjusted according to this specification.

Average daily crop evapotranspiration of main field crops and fruit in Cheleleka watershed, Ethiopia
Infiltration
Infiltration result indicates that the rate at which water enters into the soil. Actual soil intake rate has been compared with that applied by farmers. The minimum application rate estimated at upper irrigation area of Wodesa river 0.0101 m3/s (Table 8) could be 36.36 * 109 mm/h. Farmers were applying irrigation water at the rate beyond intake capacity of the soil. Traditionalist of the system might influence but lack of know how have been highly aggravated such unexpected and problematic water application rates. Rates of irrigation water application should be according to soils intake rate. As illustrated by Savva and Frenken (2002), infiltration rate is highly influenced by the soil textural class. Infiltration rate of greater than 30, between (20–30, 10–20 and 5–10), and less than 5 mm/h were reported for sandy, sandy loam, loam, clay loam and clay textural classes, respectively (Dagadu and Nimbalkar 2012).
Farmers’ perception on traditional surface irrigation
Majority of the irrigators were lived long years in the area, and they are familiar with traditional irrigation practices. They were experienced of the system, but there were gaps of education since 57% of them attended only adults’ education (Yegolmasoch Timihirt) ‘others’ (Table 9). This had brought its own consequences on traditional irrigation water use because it affects access to information that can help to acquire different skills. Low level ability of farmers and absence of support services to access improved agricultural inputs and extension services embarrassed yield of the schemes (Awulachew and Ayana 2010).
Farmers’ perception about traditional surface irrigation practices
As a higher proportion (53%) of respondents perceived that the irrigation practice is appropriate. About 40% of irrigators said that the existing practice is not righteous and full of long-lasting challenges as well. The irrigation practice whether traditional or modern it might have its own watering days. About 30% of irrigators (Table 10) could obtain irrigation water in the 1-month interval. This is based on the irrigation schedule settled by irrigation water committees of the area. About 20% of them receive water within a week. These are those located closer to diversion point. Potentials of traditional irrigation water have been surveyed from farmers, and most of them responded that irrigation water potential lags far below crop water demand.
Traditional surface irrigation challenges have been pointed out by familiar irrigators in the study area. The problems perceived by respondents (Table 10) brought scarcity/unsatisfaction of irrigation water need for crop production. Absence of fair irrigation water distribution and very low irrigation water potential (to users located at lower stream) were perceived as some of the most overriding challenges to the farmers. About 86% of householder farmers said that the existing irrigation schemes are those made of locally available materials with local knowledge. In addition, the transportation schemes are earthen and not constructed in accordance with the discharge they have to convey. In line with these, the irrigation water supply has been acutely affected.
Irrigation water dosage might be based on crop water requirement. However, most of farmers said that our water application is according to the need of the crop under cultivation. In contrast to this, the rest spelled out that since the scheme is traditional it was difficult to dose irrigation water as to crop water requirement. During field survey, it was observed that some irrigators go back to their home after irrigation water is directed to the field. In addition, focus group discussant has addressed that traditional surface irrigation water application has been to the level of farmers understanding. Some might exercise wisely, but others not. They have been spelled out that we had raised such existing and challenging problems many times to the respective institution. Nevertheless, they said that no ground pressing solutions had been replied yet and they have been living with problems of irrigation water distribution.
About 67% of respondents said that there were disputes among traditional surface irrigation water users located in different parts of the watershed. Irrigation water usage highly influenced by the type of irrigation system in use. Particularly, it is intensive under traditional surface irrigation scheme. Consequently, farmers located at upper parts and those closely positioned unto the river diversion point have high access for irrigating fields as required by them. This implies that these farmers can excessively irrigate as indicated by 68% of respondents. Therefore, these have contributed negative impact on irrigation water distribution. Deprived irrigation water controlling techniques have negative consequence on land output (Aklilu 2006; Belete 2006).
It was impossible to expect irrigation activities free of challenges. Many problems that seriously affect irrigation water allocation and use were identified (Table 11). Wilting of crops until next turn for irrigation water use and not respecting for others turn were the overriding problems that brought irrigation water conflict. The focus group discussants agreed that even though the irrigation water application turns arranged by the irrigation committee do not match with irrigation period, lack of compensation/punishment of irrigation water blockers from others turn had intensified disputes and led to conflict on irrigation water among farmers.
Improved water supervision can save the extreme water that would be used for either the extension of irrigated land or ecosystem functions (Awulachew and Ayana 2010). In order to solve the existing traditional surface irrigation water problems, options were listed by irrigators. About 35% of farmers said that they do not know the best option which fit well to the area, but the government can do all the best. Irrigation canal construction (lining), fair distribution of irrigation water among users and awareness creation (trainings on irrigation water use) were laid down by the local community for the existing irrigation water conflicts and water shortages as well.
Crop production has been carried out over available as well as productive land unit. More than 40% of farmers are both holders of greater than 5000 m2 crop land and producers of more than two Isuzu per production period. Isuzu refers to a unit measurement used to transport products as indicated by focus group discussion.
Irrigators of the study area were sold field crops on farm land. Since they highly cultivate marketable products such as sugarcane and khat, they can obtain good income. On average, about fifty thousand birr was the annual income of farmers in the area (Table 12). As suggested by focus group discussion, more products were produced and were cultivated based on the effort made by individuals of farmers. The values indicated below are income of products per annum.
Conclusions
Locally available materials and local knowledge of irrigators had been used to construct the traditional surface irrigation schemes (diversions and transportations) in the study area. Other than traditionalist of the scheme, quantities of irrigation water diverted were not in accordance with the carrying capacity of the channels that brought overtopping of water. There was over irrigation at upper and middle streams of those located closer to diversion points across streams. The larger irrigation water diverted across streams was resulted in water shortage at lower streams and initiated irrigation water conflict among farmers. Very poor conveyance efficiency was observed on traditional surface irrigation channels due to high losses, long path and not in accordance with the discharge that they have to convey. The moisture stored in root zone or RAW as farmers’ practices was found far beyond the carrying capacity of the soils. The irrigation interval as farmers’ exercises was larger than that of calculated based on soil texture. Performances of the traditional surface irrigation schemes are very low and contributed for wilting of crops. Potentials of the traditional surface irrigation system were far beyond the irrigated area based on the current water use practices in the area. The irrigation turn was not respected, and irrigation water committees are less fair as indicated by focus group discussion.
References
Abegaz F (2006) Research achievements, gaps and directions in irrigation water management. Agricultural Research Center Ethiopian Institute of Agricultural Research, Addis Ababa
Aklilu A (2006) Assessment of irrigation system at state farm. MSc thesis, Arba Minch University, Ethiopia
Ashraf M, Kahlown MA, Ashfaq A (2007) Impact of small dams on agriculture and ground water development: a case study from Pakistan. Agric Water Manag 92(90–98):4
Austin C (2002) Drought proofing in Ethiopia. www.bigpond.net.au. Accessed in August
Awulachew SB, Ayana M (2010) Performance of irrigation: an assessment at different scales in Ethiopia. Exp Agric 47(S1):57–69. https://doi.org/10.1017/S0014479710000955
Awulachew SB, Merrey D, Van Koopen B, Kamara A, Penning de Vries F, Boelee E (2016) Roles, constraints and opportunities of small roles, constraints and opportunities of small scale irrigation and water harvesting in scale irrigation and water harvesting in ethiopian agricultural development: Ethiopian agricultural development: assessment of existing situation. ILRI workshop on ILRI workshop on developing policy for more effective management of water and Liv developing policy for more effective management of water and livestock resources for restock resources for community based irrigation in Ethiopia
Belete B (2006) Across-system comparative assessment of medium-scale irrigation system performance. MSc thesis, Arba Minch University, Ethiopia
Brady NC, Weil RR (2002) The nature and properties of soils, 13th edn. Prentice-Hall, Upper Saddle River
Chandrasekaran K, Devarajulu S, Kuppannan P (2009) Farmers’ willingness to pay for irrigation water: a case of tank irrigation systems in South India. Water 1:5–18
Dagadu JS, Nimbalkar PT (2012) Infiltration studies of different soils under different soil conditions and comparison of infiltration models with field data. Bharati Vidyapeeth Deemed University College of Engineering, Pune
FAO (1977) Guidelines for designing and evaluating surface irrigation systems. FAO Corporate Document Repository, Natural Resource Management and Environmental Department, Rome
FAO (1989) Irrigation scheduling. Irrigation water management. Training manual no. 4. FAO, Rome
FAO (2006) Crop Evapotranspiration (guidelines for computing crop water requirements). FAO irrigation and drainage paper no. 56
Geremew EB, Steyn JM, Annandale JG (2008) Comparison between traditional and scientific irrigation scheduling practices for furrow irrigated potatoes (Solanum tuberosum L.) in Ethiopia. S Afr J Plant Soil 25:42–48
Halcrow W, Partners (1992) Infrastructure operation and maintenance manual: Kapunga project. National Agricultural and Food Cooperation, Tanzania
Hansen VE (1960) New concepts in irrigation efficiency. Trans Am Soc Agric Eng/ASAE 3:55–64
Hillel D (1980) Environmental soil physics—fundamentals, applications and environmental considerations. Elsevier, Amsterdam
Horst MG, Shamutalov SS, Pereira LS*, Goncalves JM (2005) Field assessment of the water saving potential with furrow irrigation in Fergana, Aral Sea basin. Agric Water Manag 77:210–231
Jha AK*, Malla R, Sharma M, Panthi J, Lakhankar T, Krakauer NY, Pradhanang SM, Dahal P, Shrestha ML (2016) Impact of irrigation method on water use efficiency and productivity of fodder crops in Nepal. Climate 4:4
Kameri-Mbote P (2007) Water, conflict, and cooperation: lessons from the Nile River Basin. Navigating Peace (Woodrow Wilson International Center for Scholars) (4). escp Publication, Washington
Khalkheili TA, Zamani GH (2009) Farmers participation in irrigation management: the case of Doroodzan Dam Irrigation Network, Iran. J Agric Water Manag 96:859–865
Machibya M, Mdemu M, Lankford B (2004) Draft irrigation efficiency and productivity manual tools for irrigation professionals and practioners; DFID; Knowledge and Research KAR R8064 Theme W5
Majumdar KD (2000) Irrigation water management principles and practices. Institute of Agriculture, New Delhi
Malano HM, Turral HN, Wood ML (1996) Surface irrigation management in real time in southeastern Australia: irrigation scheduling and field application. In: Irrigation scheduling: from theory to practice, proceedings ICID/FAO workshop, Sept 1995, Rome. Water report no. 8, FAO, Rome
Merwe FPJ, Burger HJ, Heyns PJ, Koegelenberg FH, Lategan MT, Mulder DJ, Smal HS, Stimie CM, Viljoen PD (1997) Irrigation design manual. ARC - Institute for Agricultural Engineering, Silverton, pp 2.1–2.18
Michael FD (2010) The impact of irrigated agriculture on a stable food supply. In: Proceedings of the 22nd annual central plains irrigation conference, Kearney, NE, February 24–25, 2010. Available from CPIA, 760 N. Thompson, Colby, Kansas. Market Manager Agriculture; Netafim Irrigation Inc., Fresno, CA
Modi PN (1995) Irrigation water resource and water power engineering. Standard Book House, Delhi
Norman WR (1999) Aspects of on-farm water management in small holder’s irrigation systems of arid regions. In: Goosen MFA, Shayya WH (eds) Water management, purification and conservation in arid climates, vol 1. Technic Publication Company, Inc., Lancaster, pp 219–235
OECD (Organization for Economic Co-Operation and Development Assistance Committee), (2005) Main streaming conflict prevention: water and violent conflict. OECD, Paris
Panda SC (2005) Principles and practices of water management. Agro bios India, Jodhpur
Sarker KK, Akanda MAR, Biswas SK, Roy DK, Khatun A, Goffar MA (2016) Field performance of alternate wetting and drying furrow irrigation on tomato crop growth, yield, water use efficiency, quality and profitability. J Integr Agric 15:2380–2392
Savva AP, Frenken K (2002) Planning, development, monitoring and evaluation of irrigated agriculture with farmers’ perception, vol 2. Food and Agriculture Organization of the United Nations (FAO) Sub-Regional Office for East and Southern Africa (SAFR), Harare
Saxton KE, Rawls WJ (2006) Soil water characteristic estimates by texture and organic matter for hydrologic solutions. Soil Sci Soc Am J 70:1569–1578
Saxton KE, Rawls WJ, Romberger JS, Papendick RI (1986) Estimating generalized soil water characteristics from texture. Trans ASAE 50:1031–1035
Sehring J, Diebold A (2012) From the glaciers to the aral sea water unites. Printed on Schleipen Fly at Passavia, Passau Printed in Germany. www.Waterunitesca.org
Taddesse G, Peden D (2001) Effective management of water and livestock resources for community based irrigation in Addis Ababa, Ethiopia
Tagar A, Chandio FA, Mari IA, Wagan B (2012) Comparative study of drip and furrow irrigation methods at farmer’s field in Umarkot. World Acad Sci Eng Technol 69:863–867
Thakkar H (1999) Assessment of irrigation in India, contributing paper. South Asia Network on Dams, Rivers and People, Delhi
Tulloch J (2009) Water conflicts: fight or flight? Allianz. www.knowledge.allianz.com. Accessed 11 June 2017
Wolf A, Natharius J, Danielson J, Ward BS, Pender JK (1999) International river basins of the world. Int J Water Resour Dev 15(4):387–427
Author information
Authors and Affiliations
Corresponding author
Additional information
Publisher's Note
Springer Nature remains neutral with regard to jurisdictional claims in published maps and institutional affiliations.
Rights and permissions
Open Access This article is distributed under the terms of the Creative Commons Attribution 4.0 International License (http://creativecommons.org/licenses/by/4.0/), which permits unrestricted use, distribution, and reproduction in any medium, provided you give appropriate credit to the original author(s) and the source, provide a link to the Creative Commons license, and indicate if changes were made.
About this article

Cite this article
Teshome, Y., Biazin, B., Wolka, K. et al. Evaluating performance of traditional surface irrigation techniques in Cheleleka watershed in Central Rift Valley, Ethiopia. Appl Water Sci 8, 219 (2018). https://doi.org/10.1007/s13201-018-0862-z
Received:
Accepted:
Published:
DOI: https://doi.org/10.1007/s13201-018-0862-z