
Abstract
This paper focuses on the analysis of persistence in the unemployment and inflation rates in a group of 38 OECD countries as well as on the relationship between the two variables. For this purpose, fractional integration is used. The results indicate that the two individual variables are highly persistent, especially the unemployment rate, and evidence of mean reversion is only found in the cases of Colombia and Costa Rica for unemployment and in Norway for inflation. Conducting the analysis on the difference between the two variables, the order of integration is significantly smaller in a number of cases, and reversion to the mean takes place in the cases of Austria, Switzerland, Costa Rica, Israel, and Turkey. Policy recommendations derived from the results are presented in the concluding section of the article.
Introduction
Inflation and unemployment rates are major targets of numerous macroeconomic policies. These variables have an adverse consequence on the welfare of individuals (Bhattarai, 2016; Blanchflower et al., 2014). Studies such as Krugman (1994) showed that OECD nations have witnessed very diverse long-term trends in unemployment with high unemployment since the mid-1970s. Causes of unemployment include excessive levels of real wages, institutional arrangements in the labour market, inefficient job searches, structural change, technological change, demographic change, and inadequate aggregate demand (Mitchell, 2000). On the other hand, the two significant oil price shocks in the 1970s triggered increases in inflation rates in several countries (Walsh, 2022). In both the 1970s and 1980s, financial authorities combatted spiralling inflation eventually managing to reduce and stabilise inflation expectations (Schnabel, 2022). Inflation has followed a downward trend since the 1980s for advanced economies and since the mid-1990s in emerging and developing economies. By the year 2000, inflation had stabilised at low levels (Ha et al., 2019). Factors such as globalisation, deregulation, technological advances, and improved fiscal policy have all exerted a relative influence on the low inflation rates (Rogoff, 2003). This 30-year-long period of moderate inflation, apparently independent of fluctuations in the labour market, has been interpreted as a weakening of the relationship between unemployment and inflation (Crump et al., 2024).
In recent years, the impacts of the Russia–Ukraine war and the impact of COVID-19 in some parts of the world have impaired growth and put more pressure on prices (OECD, 2022). Inflation has increased above target levels in most countries due to several key factors: supply chain bottlenecks, a shift in demand toward durable goods and away from services, fiscal and monetary stimulus and post-pandemic recovery, employment shortfall, and supply shocks to energy and food (Agarwal & Kimball, 2022). These events have brought the discussions of a changing unemployment–inflation relationship back to centre stage (Crump et al., 2024).
This paper analyses the extent of persistence of the unemployment and inflation rates for 38 OECD countries during the period 1970–2021 and examines whether there is a trade-off between unemployment and inflation. The difference between the current paper and previous ones is that we employ fractional differentiation. The use of fractional integration techniques provides more flexibility in the examination of the degree of persistence of both unemployment and inflation rates than the traditional methods used in estimating persistence and based in most cases on integer degrees of differentiation (Gil-Alana et al., 2023; Solarin et al., 2020). Using fractional integration methods, this study identifies the countries where unemployment and the inflation rate are stationary and those where the series are non-stationary. Another contribution of this study is that we have not only considered the persistence of inflation and unemployment but also the relationship between the two. Hence, this paper is likely to produce more useful results relative to studies that have either focussed on the persistence of the series or only the relationship between the two series. Moreover, we have also included a dataset which encompasses the COVID-19 period.
This paper presents the following structure: the “Literature Review” section describes the literature review; the “Methodology” section presents the methodology; the “Data” section details the dataset; the “Empirical Results” section displays the empirical results; and the “Concluding Comments” section provides some concluding remarks.
Literature Review
The relationship between unemployment and inflation was popularised by Phillips (1958), who argued that there is a negative relationship between the series, and an implication of that work is that expansionary monetary policy might lead to more inflation but less unemployment. Following his work, much additional research has been done on the interrelationship between these two economic variables (Santomero & Seater, 1978). Innovation theories, such as Triple Helix, Quadruple Helix, and Quintuple Helix have also been associated with the two variables (Peschke et al., 2023; Ben Hassen, 2024).
There are two possible explanations for this relationship, one in the short run and another in the long run (Yelwa et al., 2015). In the short run, for traditional Keynesians like Lipsey (1960) and Samuelson and Solow (1960), there is an inverse relationship between unemployment and inflation. While, in the long run, for monetarists like Friedman (1968) and Phelps (1967) and neoclassicists like Lucas (1973), the concepts of unemployment and inflation are not related due to the hypotheses of adaptive and rational expectations (Alisa, 2015).
The extensive literature on unemployment persistence highlights two fundamental theories of unemployment: the hysteresis theory of unemployment (Blanchard & Summers, 1986) and the classical “natural” rate theory of Friedman (1968) and Phelps (1967). According to the hysteresis theory, the unemployment rate does not return to an equilibrium level, and the shocks are not transitory. In contrast, the theory of the natural rate of unemployment assumes that the unemployment rate is subject to temporary fluctuations around this natural rate in accordance with inflationary expectations (Fosten & Ghoshray, 2011). Therefore, the rate of unemployment will tend to revert to its equilibrium in the long run (Omay et al., 2020). Several studies conducted for Asian countries (Lee et al., 2010), Latin American countries (Ayala et al., 2012), European countries (Bolat et al., 2014; Cuestas et al., 2011), the United States (Romero-Ávila and Usabiaga, 2007), OECD countries (Bermejo et al., 2023; Cheng, 2022; Omay et al., 2021), Canada, France, and the UK (Yilanci et al., 2020) showed evidence of the unemployment hysteresis hypothesis. Recent studies such as Cheratian et al. (2023) for Iran and Gil-Alana et al. (2024) for G-7 countries have also provided evidence for convergence. However, studies such as Song et al. (1998), León-Ledesma (2002), Camarero and Tamarit (2004), Yilanci (2008), Lee et al. (2009), and Furuoka (2014), among others, supported the natural rate hypothesis.
From a policy perspective, if the hysteresis hypothesis is valid, monetary and fiscal policies can be employed to decrease unemployment rates. By contrast, if the natural rate hypothesis is valid, an activist policy will not be effective and can be destabilising (Omay et al., 2021). Other factors influencing the persistence of unemployment might be high real wages, unemployment protection schemes, powerful labour unions, and the stigma connected with being jobless for a long time (Godday et al., 2022).
In relation to the persistence of unemployment, the dynamics of inflation are essential because it has vital policy implications (Gadea & Mayoral, 2006). Several studies found that inflation persistence has fallen. For example, Kumar and Okimoto (2007) investigated the dynamics of inflation persistence using fractionally integrated processes. These authors found a decline in inflation persistence in the United States since the 1980s. These results are similar to the study by Carlstrom et al. (2009). The latter authors showed evidence of a change in the persistence of inflation in the United States since the 1980s.
On the other hand, various studies have presented evidence that inflation persistence seems to be high. For instance, Gadea and Mayoral (2006) considered the inflation rates of 21 OECD countries, which were modelled as fractionally integrated processes. The results showed that inflation persistence is very high although non-permanent in several nations. Likewise, Pivetta and Reis (2007) used non-linear Bayesian methods to estimate the persistence of inflation in the United States for the period 1965–2001. The results showed that inflation persistence has been high and unchanged for the estimation period. In the same vein, Caporale et al. (2022a) investigated the persistence in the inflation rates of the G7 nations by investigating their order of integration. The empirical findings indicated that the series is very persistent. Also, recent studies such as Ebuh et al. (2023) for Nigeria and Yu et al. (2023) for the United States have provided evidence for persistence. However, other studies such as Caporale et al. (2022b) for the UK and Altissimo et al. (2006) for the Euro area have concluded that inflation persistence had remained stable.
Understanding inflation persistence is very important for policymakers because it has immediate consequences on the conduct of monetary policy (Marques, 2004). Studies like Mester (2022) indicate that better economic outputs were obtained under the assumption that the inflation rate is persistent. In this case, policymakers will opt for monetary policies that are characterised by a relatively aggressive response to the evolution of inflation (Coenen, 2007; Schnabel, 2022).
Methodology
We suppose the data display long memory, and we use techniques based on fractional integration and cointegration that apply to unemployment and inflation rate series in 38 OECD countries. This methodology (fractional integration) is more flexible than that based on stationary/unit root tests (e.g., Dickey and Fuller, 1979; Phillips and Perron, 1988; Kwiatkowski et al., 1992; Elliot et al., 1996; etc.) that simply consider integer degrees of differentiation, i.e., 0 in case of stationary series and 1 for nonstationary ones. By allowing the order of integration to be fractional, we can consider cases like those of series which are nonstationary though displaying a mean reverting pattern, for example, if the order of integration is higher than 0.5 but smaller than 1. Moreover, it is a well-known fact that the above-mentioned unit-root procedures have an extremely lower power against fractional alternatives. Classical references here are Diebold and Rudebusch (1991), Hassler and Wolters (1994), and Lee and Schmidt (1996) among many others. On the other hand, the classical framework of cointegration (Johansen, 1991, 1996) is once more specified for the nonstationary I(1) series with I(0) equilibrium errors. In that sense, our work is more general and flexible than these classical approaches.
According to the definition of fractional integration, the number of differences to be adopted in a time series to render it stationary I(0) may be a fractional value. This modelling approach belongs to the category of long memory or long-range dependence processes, which is characterised because of a strong degree of dependence in the data that implies that the infinite sum of its autocovariance is infinite.
A time-series process is said to be integrated of order d, and denoted by I(d) for any real value d if it can be represented as:
where L refers to the lag operator and ut is I(0) or short memory, which is defined as a process where the infinite sum of its autocovariance is finite and includes, for example, the stationary and invertible AutoRegressive Moving Average (ARMA)-class of models. The polynomial in L in the left-hand side of (1) can be expanded in terms of its Binomial representation such that, for all real d,
implying that Eq. (1) can be written as:
In this context, for fractional values of d, xt is dependent on all its previous history, and the higher the d is, the higher the association between the values is. Remember that long memory occurs as long as d is positive; stationarity asymptotically holds if d is smaller than 0.5, and mean reversion takes place if d is strictly smaller than 1; the lower the value of d, the faster the convergence process.
Fractional integration is extended to the multivariate case throughout cointegration. According to Engle and Granger (1987), two series cointegrate if they display individually the same degree of integration, say d, but there exists a linear combination of the two which is integrated in a smaller order. They propose a two-step strategy, testing in the first step the value of d in the individual series, and then testing the order of integration in the estimated residuals from the regression of one variable against the order. Nevertheless, if cointegration does not hold, the regression produces spurious estimates invalidating the analysis. In the empirical application conducted in this work, rather than making a regression of unemployment on inflation (or vice versa), we simply look at the difference between the two series, thus avoiding the problem of estimation and directly working with the observed data.
Data
The data for the inflation rate (which is defined as the annual growth rate of the consumer price index with base year 2015) and unemployment rate (which is defined as the total number of unemployed as a percentage of the labour force) for the 38 OECD countries analysed have been obtained from OECD Statistics (OECD Statistics, 2023). The Consumer Price Index (CPI) used in the computation of the inflation rates involves the prices of a fixed set of consumer goods and services of constant characteristics and quantity paid for or obtained by the residents of the countries under observation. The selection of these countries is due to data limitations. The length of the series is different for each of them. Table 1 shows all countries, the start of the series, and the sample size.
Table 2 shows the descriptive statistics of the inflation and unemployment series of the 38 OECD countries considered. It is observed that the average unemployment rate takes values between 2.75 (the minimum value that corresponds to Japan) and 16.72 (the maximum value that corresponds to Spain). Although it is not only Spain that has double-digit unemployment rates, this also happens with Colombia, Costa Rica, Greece, Ireland, Lithuania, Latvia, Poland, Slovak Republic, and Turkey. These large differences in the unemployment rate between countries can be explained on the one hand by the different ways of calculating the unemployment rate, and on the other hand because the natural unemployment rate (NAIRU) is not the same in all countries since this rate corresponds to the potential output of an economy. Moreover, according to the Phillips curve between unemployment and inflation, an attempt to reduce the unemployment rate could lead to high inflation. In general terms, most countries have average unemployment rates higher than their average inflation rates. In terms of average rates, only Mexico has an average inflation rate much higher than the average unemployment rate. This low unemployment rate is because it tends to concentrate only on frictional unemployment and part of cyclical unemployment (Banco de Mexico, 2017). For these reasons, the difference between unemployment and inflation is positive, on average, for all countries except Mexico (Fig. 1). Also, Fig. 2 shows the evolution of this difference during the periods considered for each country. There is an increasing trend and a value greater than 0 that is common, in general, to all countries, except for the case of Mexico with an increasing trend but a value less than 0.

Difference between average unemployment rate and average inflation rate
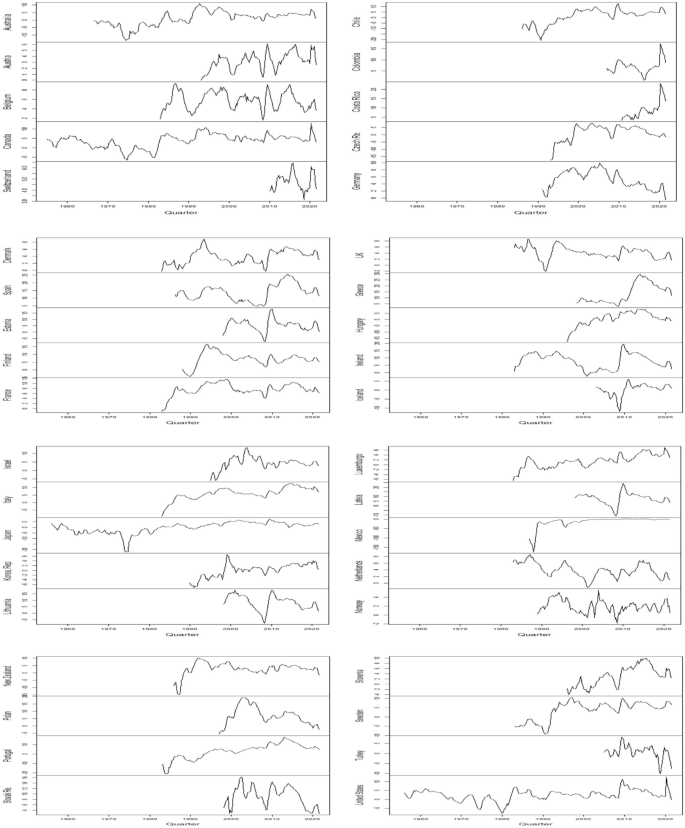
Evolution of the difference between the average unemployment rate and the average inflation rate
Empirical Results
Based on the monthly nature of the series under examination, the model of interest is as follows,
where ut is supposed to follow a seasonal AR(1) process of the form:
We estimate the differencing parameter d in a model given by Eqs. (3) and (4) under the three classical specifications in the unit-roots literature:
-
(1)
With no deterministic terms, i.e., imposing α = β = 0 a priori in (3),
-
(2)
Including only an intercept, i.e., with β = 0, and
-
(3)
With an intercept and a linear time trend as in Eq. (3).
We start with (3), and if the two coefficients α and β are significant, we choose that model. However, if β is insignificant, we move to the model in (2) with an intercept. Finally, if α is also found to be insignificant, we choose the model in (1) with no terms.
Tables 3 and 4 refer to unemployment while Tables 5 and 6 to inflation. In Tables 3 and 5, we report the estimates of d for the three selected cases, marking in bold the selected model for each country. Tables 4 and 6 report the estimated coefficients on these selected models for each series.
Starting with the results for unemployment, we observe in Table 3 that the time trend coefficient is found to be statistically insignificant in all countries, with an intercept being sufficient for the description of the deterministic part of the model. Looking at the estimated coefficients, in Table 4, the values of d are very heterogeneous across countries; thus, evidence of mean reversion is found in two cases: Colombia (d = 0.74) and Costa Rica (0.75); there is evidence of unit roots in a group of seven countries (Austria, Belgium, Canada, Switzerland, Israel, Japan, and the United States), while in the remaining 28 countries, the unit root hypothesis is rejected in favour of values of d above 1, the highest one corresponding to Germany with an estimated d of 1.91. Looking at the seasonal coefficient, the values are relatively low in all cases, with the highest values corresponding to Luxembourg (ρ = − 0.316), Austria (− 0.234), and Finland (− 0.227).
Next, we look at inflation. Table 5 indicates that the time trend is also insignificant in all countries for this variable, and even the intercept is unrequired in the cases of Canada, Iceland, Japan, and the United States. Focussing on d, in Table 6, apart from the case of Norway, where mean reversion is detected, the rest of the countries can be grouped into two categories: those where the unit root null hypothesis cannot be rejected (Australia, Austria, Switzerland, Costa Rica, Germany, Denmark, Spain, Greece, Israel, Republic Korea, the Netherlands, New Zealand, Slovak Republic, Slovenia, and Turkey) and those where this hypothesis is rejected in favour of values of d > 1 (Belgium, Canada, Republic Czech, Chile, Colombia, Estonia, Finland, France, the United Kingdom, Hungary, Ireland, Iceland, Italy, Japan, Lithuania, Luxembourg, Latvia, Mexico, Poland, Portugal, Sweden, and the United States). The seasonal coefficient is once smaller, with three main exceptions: Canada (ρ = − 0.470), Japan (− 0.446), and the United States (− 0.444).
Table 7 resumes the selected estimate of d for each country, and we have marked in bold the countries where we cannot reject the null that the two orders of integration are equal. For this purpose, we have used the homogeneity test developed by Robinson and Yajima (2002). Similar results are obtained when using alternative methods like Hualde’s (2013). Using the homogeneity test by Robinson and Yajima (2002), we test the null hypothesis:
where the orders of integration of the individual series are represented by \({d}_{y1}\) and \({d}_{y2}\). The test statistic dy1is:
where \(h\left(T\right)>0\) and \({\widehat{G}}_{y1.y2}\) denote the (y1.y2)th element of \(\widehat{\Lambda }{\left({\lambda }_{j}\right)}^{-1}I\left({\lambda }_{j}\right)\widehat{\Lambda }\left({\lambda }_{j}\right)\) with \(\widehat{\Lambda }\left({\lambda }_{j}\right)={\text{diag}}\left\{{e}^{i\pi {\widehat{d}}_{y1}/2}{\lambda }^{-{\widehat{d}}_{y1}},{e}^{i\pi {\widehat{d}}_{y2}/2}{\lambda }^{-{\widehat{d}}_{y2}}\right\}\).
Check Gil-Alana and Hualde (2009) for proof of the small sample performance of this procedure. The empirical findings using this approach are displayed in bold in Table 7. We observe that only for 11 countries do we have divergence in the degree of integration. These countries are Australia, Colombia, Germany, Denmark, Spain, Korea Republic, Mexico, Netherlands, Norway, Sweden, and Slovak Republic. For the rest of the countries, we cannot reject the null of equal degrees of differentiation, so we can go ahead and test for cointegration in the relationship between unemployment and inflation. However, as earlier argued, testing the residuals of a regression of unemployment and inflation may produce spurious results if cointegration is not satisfied and inconsistent estimates of the coefficients are obtained in the model (see Robinson & Hidalgo, 1997). However, though there exist some consistent methods of estimation based on narrow bandwidths in the frequency domain (Robinson, 1994, and more recently, Christensen & Nielsen, 2006), a much simpler approach is to directly work with the observed differenced data, and this approach is employed as follows. Thus, we estimate once more the model given by Eq. (3), but this time on the difference between unemployment and inflation. The results of the estimated parameters are displayed in Table 8.
We first observe in this table a positive time trend in a number of cases: Austria (β = 0.030), Chile (0.107), Costa Rica (0.278), Hungary (0.156), Israel (0.076), and Luxembourg (0.060) and a negative one in the case of Turkey (− 0.058). More importantly, if we look at the orders of integration, evidence of mean reversion is found in the cases of Austria (0.53), Switzerland (0.27), Costa Rica (0.32), Israel (0.67), and Turkey (0.11). For the rest of the countries, though most of the estimates of d are below 1, the confidence bands are so wide that the unit root null cannot be rejected. Thus, only for this group of five countries do we find evidence of a long-run equilibrium relationship.
Two major results arise from the empirical findings. The first major result is that the two individual variables are highly persistent. The second major result indicates that the order of integration on the difference between the two variables is significantly smaller in a number of cases. An economic rationale for the results in the persistence of national output is a determinant of both unemployment and inflation. According to Smyth (2013), a series which is dependent on another variable that is persistent will imbibe this persistence. Rapach (2002) has shown that national output is a persistent series. Through cost-push inflation, a decrease in national output causes inflation, and through the supply-side proposition, an increase in national output causes unemployment to reduce (Gil-Alana et al., 2023).
Concluding Comments
The aim of this paper is to evaluate the persistence of both unemployment and inflation rates in 38 OECD countries. The long-run equilibrium relationship between the two series has also been examined. A major difference between the current paper and the previous works is that the data used in this paper covers the COVID-19 period. Besides, we have also used fractional integration approaches, which allow for more flexibility in the examination of the degree of persistence of the series. The results suggest that the unemployment rate is a highly persistent series (in line with the hysteresis hypothesis) as 36 countries or 95% of the countries have persistent unemployment series. Moreover, the results indicate that the inflation rate is also a highly persistent series as 37 countries or 97% of the countries have persistent inflation series. The results further suggest that a long-run equilibrium relationship exists between the series in only five countries or 13% of the countries under observation (Austria, Switzerland, Costa Rica, Israel, and Turkey).
An implication of the results is that high unemployment rates will persist in the long run if adequate policies are not introduced to tame unemployment in these OECD countries. It also implies that a robust combination of policies is needed to sufficiently address high unemployment rates whenever they arise. Hence, in addition to fiscal policies, there is a need to expand the currently available job retention schemes in these countries, sustaining and, where feasible, increasing cost-effective active labour market measures, while decreasing labour market duality. Some of these policies have been introduced from time to time to tackle unemployment in these countries. For instance, the expansion of eligibility for job retention schemes to include temporary workers was introduced to further benefit many young workers in OECD countries, especially during the COVID-19 period (OECD, 2021).
Another implication of our results is that inflation will persist in the long run if adequate policies are not introduced to address the rising inflation in OECD nations. Active monetary policies such as relevant open-market operations, a wide interest rate corridor, and other reforms are needed to address high inflation, whenever it occurs in OECD countries. Supply-side measures should be implemented to improve innovation, competition, and productivity—all of which have the potential to tame inflation. Some forms of these measures have been introduced in the past in the OECD countries. For instance, market-oriented initiatives under the structural programme “A New Start for Sweden” were introduced in Sweden after the economy experienced a high inflation episode in the 1980s.
Since the two series are not cointegrated in many cases, this implies that comprehensive measures are needed to reduce the incidence of stagflation. The elimination of barriers to work via mitigating work disincentives in tax and occupational licencing reforms should enhance labour force participation and simultaneously reduce the cost of production for companies. Furthermore, the deregulation of housing, energy, and other markets would lessen the regulatory burden on firms, depressing the cost of national production.
Decreasing supervisory uncertainty for firms should bring about improvement in business activities (Muensriphum et al., 2021) and consequently have a favourable impact on both inflation and unemployment. There are a few examples of countries implementing these measures. The EU Commission has introduced a series of initiatives over the last few years to enhance the legislation quality aimed at decreasing the total administrative burden imposed on firms (OECD, 2015).
Finally, the fact that the period under examination includes the time of the COVID-19 pandemic might suggest that the results reported could be a consequence of structural breaks that have not been taken into account (see Granger & Hyung, 2004). However, removing the years 2020 and 2021 from the analysis, the results were not materially different. Nevertheless, to examine how the presence of potential breaks in the data may affect the long-run equilibrium relationships in a fractional cointegration set-up and is something that should be considered.
References
Agarwal, R., & Kimball, M. (2022). Will inflation remain high. Finance & development, 59, 002.
Alisa, M. (2015). The relationship between inflation and unemployment: A theoretical discussion about the Phillips curve. Journal of International Business and Economics, 3(2), 89–97.
Altissimo, F., Ehrmann, M., & Smets, F. (2006) Inflation persistence and price-setting behaviour in the Euro area-a summary of the IPN evidence. European Central Bank Occasional paper series, (46).
Ayala, A., Cuñado, J., & Gil-Alana, L. A. (2012). Unemployment hysteresis: Empirical evidence for Latin America. Journal of Applied Economics, 15(2), 213–233.
Banco de Mexico. (2017). Quarterly Report October-December 2016. Mexico City: Banco de Mexico.
Ben Hassen, T. (2024). A study on Lebanon’s competitive knowledge-based economy, relative strengths, and shortcomings. Journal of the Knowledge Economy, 1–28. https://doi.org/10.1007/s13132-023-01644-8
Bermejo, L., Malmierca-Ordoqui, M., & Gil-Alana, L. A. (2023). Unemployment and COVID-19: An analysis of change in persistence. Applied Economics, 55(39), 4511–4521.
Bhattarai, K. (2016). Unemployment–inflation trade-offs in OECD countries. Economic Modelling, 58, 93–103.
Blanchard, O. J., & Summers, L. H. (1986). Hysteresis and the European unemployment problem. NBER Macroeconomics Annual, 1, 15–90.
Blanchflower, D. G., Bell, D. N., Montagnoli, A., & Moro, M. (2014). The happiness trade-off between unemployment and inflation. Journal of Money, Credit and Banking, 46(S2), 117–141.
Bolat, S., Tiwari, A. K., & Erdayi, A. U. (2014). Unemployment hysteresis in the Eurozone area: Evidences from nonlinear heterogeneous panel unit root test. Applied Economics Letters, 21(8), 536–540.
Camarero, M., & Tamarit, C. (2004). Hysteresis vs. natural rate of unemployment: New evidence for OECD countries. Economics Letters, 84, 413–417.
Caporale, G. M., Gil-Alana, L. A., & Poza, C. (2022a). Inflation in the G7 countries: Persistence and structural breaks. Journal of Economics and Finance, 46(3), 493–506.
Caporale, G. M., Gil-Alana, L. A., & Trani, T. (2022b). On the persistence of UK inflation: A long-range dependence approach. International Journal of Finance & Economics, 27(1), 439–454.
Carlstrom, C. T., Fuerst, T. S., & Paustian, M. (2009). Inflation persistence, monetary policy, and the great moderation. Journal of Money, Credit and Banking, 41(4), 767–786.
Cheng, K. M. (2022). Doubts on natural rate of unemployment: Evidence and policy implications. The Quarterly Review of Economics and Finance, 86, 230–239.
Cheratian, I., Goltabar, S., & Gil-Alana, L. A. (2023). The unemployment hysteresis by territory, gender, and age groups in Iran. SN Business & Economics, 3(2), 44.
Christensen, B. J., & Nielsen, M. Ø. (2006). Asymptotic normality of narrow-band least squares in the stationary fractional cointegration model and volatility forecasting. Journal of Econometrics, 133, 343–371.
Coenen, G. (2007). Inflation persistence and robust monetary policy design. Journal of Economic Dynamics and Control, 31, 111–140.
Crump, R. K., Eusepi, S., Giannoni, M., & Şahin, A. (2024) The unemployment-inflation trade-off revisited: The Phillips curve in COVID times. Journal of Monetary Economics, 103580.
Cuestas, J. C., Gil-Alana, L. A., & Staehr, K. (2011). A further investigation of unemployment persistence in European transition economies. Journal of Comparative Economics, 39(4), 514–532.
Dickey, D. A., & Fuller, W. A. (1979). Distribution of the estimators for autoregressive time series with a unit root. Journal of the American Statistical Association, 74(366), 427–431. https://doi.org/10.1080/01621459.1979.10482531
Diebold, F. X., & Rudebusch, G. D. (1991). On the power of Dickey-Fuller tests against fractional alternatives. Economics Letters, 35, 155–160. https://doi.org/10.1016/01651765(91)90163-F
Ebuh, G. U., Salisu, A., Oboh, V., & Usman, N. (2023). A test for the contributions of urban and rural inflation to inflation persistence in Nigeria. Macroeconomics and Finance in Emerging Market Economies, 16(2), 222–246.
Elliot, G., Rothenberg, T. J., & Stock, J. H. (1996). Efficient tests for an autoregressive unit root. Econometrica, 64, 813–836. https://doi.org/10.2307/2171846
Engle, R. F., & Granger, C. W. J. (1987). Co-Integration and error correction: Representation, estimation, and testing. Econometrica, 55(2), 251–276.
Fosten, J., & Ghoshray, A. (2011). Dynamic persistence in the unemployment rate of OECD countries. Economic Modelling, 28, 948–954.
Friedman, M. (1968). The role of monetary policy. American Economic Review, 58, 1–17.
Furuoka, F. (2014). Are unemployment rates stationary in Asia-Pacific countries? New findings from Fourier ADF test. Economic Research, 27, 34–45.
Gadea, M. D., & Mayoral, L. (2006). The persistence of inflation in OECD countries: A fractionally integrated approach. International Journal of Central Banking, 2, 51–104.
Gil-Alana, L. A., Solarin, S. A., Balcilar, M., & Gupta, R. (2023). Productivity and GDP: International evidence of persistence and trends over 130 years of data. Empirical Economics, 64(3), 1219–1246.
Gil-Alana, L. A., & Hualde J. (2009) Fractional integration and cointegration. An overview and an empirical application. Palgrave Handbook of Econometrics: Volume 2: Applied Econometrics, 434–469.
Gil-Alana, L. A., González-Blanch, M. J., & Poza, C. (2024). Labour market mismatches in G7 countries: A fractional integration approach. Applied economics, 1–17. https://doi.org/10.1080/00036846.2024.2305620
Godday, E. U., Usman, N., & Salisu, A. A. (2022). Testing for unemployment persistence in Nigeria. Economic Change and Restructuring, 55(4), 2605–2630.
Granger, C. W. J., & Hyung, N. (2004). Occasional structural breaks and long memory with an application to the S&P 500 absolute stock returns. Journal of Empirical Finance, 11(3), 399–421.
Ha, J., Ivanova, A., Ohnsorge, F., & Unsal, D. F. (2019). Inflation: Concepts, evolution, and correlates. World Bank Policy Research Working Paper, (8738).
Hassler, U., & Wolters, J. (1994). On the power of unit root tests against fractional alternatives. Economic Letters, 45, 1–5. https://doi.org/10.1016/0165-1765(94)90049-3
Hualde, J. (2013). A simple test for equality in the integration orders. Economics Letters, 119(3), 233–237.
Johansen, S. (1991). Estimation and hypothesis testing of cointegration vectors in Gaussian vector autoregressive models. Econometrica, 59, 1551–1580.
Johansen, S. (1996). Likelihood-based inference in cointegrated vector autoregressive models. Oxford University Press.
Krugman, P. (1994). Past and prospective causes of high unemployment. Federal Reserve Bank of Kansas City Economic Review, 79(4), 23–43.
Kumar, M. S., & Okimoto, T. (2007). Dynamics of persistence in international inflation rates. Journal of Money, Credit, and Banking, 39(6), 1457–1479.
Kwiatkowski, D., Phillips, P. C. D., Schmidt, P., & Shin, Y. (1992). Testing the null hypothesis of stationarity against the alternative of a unit root: How sure are we that economic time series have a unit root? Journal of Econometrics, 54, 159–178. https://doi.org/10.1016/0304-4076(92)90104-y
Lee, D., & Schmidt, P. (1996). On the power of the KPSS test of stationary against fractionally integrated alternatives. Journal of Econometrics, 73, 285–302. https://doi.org/10.1016/0304-4076(95)01741-0
Lee, J. D., Lee, C. C., & Chang, C. P. (2009). Hysteresis in unemployment revisited: Evidence from panel LM unit root tests with heterogeneous structural breaks. Bulletin of Economic Research, 61(4), 325–334.
Lee, H. Y., Wu, J. L., & Lin, C. H. (2010). Hysteresis in East Asian unemployment. Applied Economics, 42(7), 887–898.
León-Ledesma, M. A. (2002). Unemployment hysteresis in the US states and the EU: A panel approach. Bulletin of Economic Research, 54(2), 95–103.
Lipsey, R. G. (1960). The relationship between unemployment and the rate of change of money wage rates in the U. K. 1862–1957: A further analysis. Economica, 27, 1–31.
Lucas, R. E. (1973). Some international evidence on output-inflation tradeoffs. American Economic Review, 63(3), 326–334.
Marques, C. R. (2004). Inflation persistence: Facts or artefacts. European Central Bank. Working Paper Series, 371. Available at SSRN: https://doi.org/10.2139/ssrn.533131
Mester, L. J. (2022). An update on the economic outlook and monetary policy. Speech 94728, Federal Reserve Bank of Cleveland.
Mitchell, W. F. (2000). The causes of unemployment. In S. Bell (Ed.), The unemployment crisis in Australia: Which way out? (pp. 49–87). Cambridge University Press.
Muensriphum, C., Makmee, P., & Wongupparaj, P. (2021). Cross-cultural competence - A crucial factor that affects Chinese corporations’ business performance in the eastern special development zone of Thailand. ABAC Journal, 41(4), 175–197.
OECD. (2022). OECD Economic outlook, interim report September 2022: Paying the price of war. OECD Publishing.
OECD Statistics. (2023). OECD statistics website. Available at https://stats.oecd.org/ (Accessed on 30 January 2023)
OECD. (2015). OECD policy responses to coronavirus (COVID-19): Escaping the stagnation trap: Policy options for the euro area and Japan. Available at https://www.oecd.org/eu/escaping-the-stagnation-trap-policy-options-for-the-euro-area-and-japan.pdf (Accessed on 30 January 2023)
OECD. (2021). OECD policy responses to coronavirus (COVID-19): What have countries done to support young people in the COVID-19 crisis? Available at https://www.oecd.org/coronavirus/policy-responses/what-have-countries-done-to-support-young-people-in-the-covid-19-crisis-ac9f056c/ (Accessed on 30 January 2023)
Omay, T., Özcan, B., & Shahbaz, M. (2020). Testing the hysteresis effect in the US state-level unemployment series. Journal of Applied Economics, 23, 329–348.
Omay, T., Shahbaz, M., & Stewart, C. (2021). Is there really hysteresis in the OECD unemployment rates? New evidence using a Fourier panel unit root test. Empirica, 48(4), 875–901.
Peschke, L., Gyftopoulos, S., Kapusuzoğlu, A., Folkvord, F., Gümüş Ağca, Y., Kaldoudi, E., & Güneş Peschke, S. (2023). Practices of knowledge exchange in the context of the COVID-19 pandemic. Journal of the Knowledge Economy, 1–38. https://doi.org/10.1007/s13132-023-01537-w
Phelps, E. S. (1967). Money wage dynamics and labour market equilibrium. Journal of Political Economy, 76(4, Part 2), 678–711.
Phillips, A. W. (1958). The relationship between unemployment and the rate of change of money wages in the United Kingdom, 1861–1957. Economica, 25(100), 283–299.
Phillips, P. C. B., & Perron, P. (1988). Testing for a unit root in time series regression. Biometrika, 75(2), 335–346. https://doi.org/10.1093/biomet/75.2.335
Pivetta, F., & Reis, R. (2007). The persistence of inflation in the United States. Journal of Economic Dynamics and Control, 31(4), 1326–1358.
Rapach, D. E. (2002). Are real GDP levels nonstationary? Evidence from panel data tests. Southern Economic Journal, 68(3), 473–495.
Robinson, P. M. (1994). Semiparametric analysis of long memory time series. Annals of Statistics, 22, 515–539.
Robinson, P. M., & Hidalgo, F. J. (1997). Time series regression with long-range dependence. Annals of Statistics, 25(1), 77–104.
Robinson, P. M., & Yajima, Y. (2002). Determination of cointegrating rank in fractional systems. Journal of Econometrics, 106, 217–241.
Rogoff, K. (2003). Globalization and global disinflation. Economic Review-Federal Reserve Bank of Kansas City, 88(4), 45–78.
Romero-Ávila, D., & Usabiaga, C. (2007). Unit root tests, persistence, and the unemployment rate of the US states. Southern Economic Journal, 73(3), 698–716.
Samuelson, P. A., & Solow, R. M. (1960). Analytical aspects of anti-inflation policy. The American Economic Review, 50(2), 177–194.
Santomero, A. M., & Seater, J. J. (1978). The inflation-unemployment trade-off: A critique of the literature. Journal of Economic Literature, 16(2), 499–544.
Schnabel, I. (2022, August). Monetary policy and the great volatility. In Remarks made at the Jackson Hole Economic Policy Symposium: Macroeconomic Policy in an Uneven Economy. Available at: https://www.ecb.europa.eu/press/key/date/2022/html/ecb.sp220827~93f7d07535.en.html
Smyth, R. (2013). Are fluctuations in energy variables permanent or transitory? A survey of the literature on the integration properties of energy consumption and production. Applied Energy, 104, 371–378.
Solarin, S. A., Gil-Alana, L. A., & Lafuente, C. (2020). Persistence of the misery index in African countries. Social Indicators Research, 147, 825–841.
Song, F. M., & Wu, Y. (1998). Hysteresis in unemployment: Evidence from OECD countries. The Quarterly Review of Economics and Finance, 38(2), 181–192.
Walsh, C. E. (2022). Inflation Surges and Monetary Policy. Bank of Japan Monetary and Economic Studies, 40, 30–65.
Yelwa, M., David, O. O., & Awe, E. O. (2015). Analysis of the relationship between inflation, unemployment and economic growth in Nigeria: 1987–2012. Applied Economics and Finance, 2(3), 102–109.
Yilanci, V. (2008). Are unemployment rates nonstationary or nonlinear? Evidence from 19 OECD countries. Economics Bulletin, 3(47), 1–5.
Yilanci, V., Ozkan, Y., & Altinsoy, A. (2020). Testing the unemployment hysteresis in G7 countries: A fresh evidence from fourier threshold unit root test. Romanian Journal of Economic Forecasting, 23(3), 49.
Yu, D., Chen, L., & Li, L. (2023). Nonparametric modeling for the time-varying persistence of inflation. Economics Letters, 225, 111040.
Acknowledgements
Comments from the Editor and two anonymous reviewers are gratefully acknowledged.
Funding
Open Access funding provided thanks to the CRUE-CSIC agreement with Springer Nature.
Author information
Authors and Affiliations
Corresponding author
Ethics declarations
Conflict of Interest
The authors declare no competing interests.
Additional information
Publisher's Note
Springer Nature remains neutral with regard to jurisdictional claims in published maps and institutional affiliations.
Rights and permissions
Open Access This article is licensed under a Creative Commons Attribution 4.0 International License, which permits use, sharing, adaptation, distribution and reproduction in any medium or format, as long as you give appropriate credit to the original author(s) and the source, provide a link to the Creative Commons licence, and indicate if changes were made. The images or other third party material in this article are included in the article's Creative Commons licence, unless indicated otherwise in a credit line to the material. If material is not included in the article's Creative Commons licence and your intended use is not permitted by statutory regulation or exceeds the permitted use, you will need to obtain permission directly from the copyright holder. To view a copy of this licence, visit http://creativecommons.org/licenses/by/4.0/.
About this article

Cite this article
Solarin, S.A., Lafuente, C., Gil-Alana, L.A. et al. Persistence in the Unemployment and Inflation Relationship. Evidence from 38 OECD Countries. J Knowl Econ (2024). https://doi.org/10.1007/s13132-024-02034-4
Received:
Accepted:
Published:
DOI: https://doi.org/10.1007/s13132-024-02034-4