
Abstract
Small-scale visualizations can augment text, show information on mobile devices, or geographical information on a map. In such situations, there is often not enough space to show complex data with approaches like juxtaposed visualizations. To alleviate this issue, we propose the use of animated transitions between several small-scale visualizations. We discuss design considerations for animated transitions between small-scale visualizations and differences to normal-sized visualizations. Further, we present the results of two online studies on the effectiveness of those animated transitions to convey information and attribute relations, as well as the mental load of following the animated transitions. As a result, we found that animated transitions between visualizations are understandable in small scale, but performance depends on the specific task and the type of operation carried out with the animated transition.
Graphical abstract

1 Introduction
Small-scale visualizations are common in a number of application scenarios, but have a limited ability to show all characteristics of complex multidimensional data. For example, text can be augmented with small-scale visualizations, also referred to as word-scale visualizations, to support understanding of data in the text. Tufte (2006) first introduced word-scale visualizations as sparklines showing stock data  , but they can be other types of visualizations, such as a scatter plot
  or a box plot
  . There can be several word-scale visualizations in a text to show different aspects of the underlying data, like temporal differences or levels of detail. However, space is limited, because the visualization-to-text ratio should not exceed a certain level to not disturb the reading flow.
Other use cases include map visualizations showing geography-related data (Schumann and Tominski 2011), like covid cases, election results, or trending twitter contributions (Bosch et al. 2013). Symbols, glyphs, and small statistical graphics are common means to convey data values for locations or regions. Here, visualization space is limited as well, because multiple graphics have to fit on the map while still making it possible to annotate a place or region with enough spatial precision. Further, people nowadays also use small-scale visualizations on small displays of mobile devices like phones, tablets, or smartwatches, with design challenges of limited screen space, computational power, and interaction possibilities (Chittaro 2006; Horak et al. 2021; Neshati et al. 2019). Boundaries of size in the definitions of large-scale, normal-sized and small-scale visualizations are fluid. For the purpose of this work, we assume visualizations that are at most three lines of text in height, and without axis marks and gridlines, to be small-scale visualizations.
In these scenarios, visualizing complex or multidimensional data are challenging due to the small scale of the visualizations. Only a limited amount of data attributes can be shown in one visualization. We approach a solution to this problem by proposing to transition between visualizations, with the goal of improving comprehension of the multidimensional data. Animated transitions offer the possibility to browse the data even when little visualization space is available. The animation aims to help understand the relation of data between the visualizations and to counteract change-blindness.

Two animation sequences in small-scale visualizations of a car dataset (Auto MPG 1993). a Filtering by cars with four cylinders in a scatter plot that shows range by horsepower. b Aggregating the acceleration by number of cylinders to median acceleration for each cylinder number
We contribute design considerations for animated transitions between small-scale visualizations (see Fig. 1), in contrast to normal-sized ones. With two online studies and two pilot studies, we compare animated transitions between small-scale visualizations to those between normal-sized ones and show their potential to improve analysts’ understanding of the data.
This article is an extension of our previous publication (Huth et al. 2022). We dug deeper into the data of the first study, repeated parts of the first study with a modified animated transition, and performed a follow-up study that we describe in Sect. 4.
2 Related work
In the following, we discuss the relevant related work including application scenarios of small-scale visualizations, studies on animated transitions, the design of animated transitions, and recommender systems.
2.1 Application scenarios
Researchers have examined small-scale visualizations in a multitude of settings. Word-scale visualizations are used, for example, to increase the understanding of eye-tracking study results (Beck et al. 2015), to augment scientific texts (Beck and Weiskopf 2017), for better clarity of software code and code quality (Hoffswell et al. 2018), or to highlight discussion diversity in social media (Huth et al. 2021). For map visualizations, Jakobsen and Hornbæk (2013) studied benefits and drawbacks of small-scale, normal-sized, and large-scale visualizations, and found that a larger display size does not improve task performance. Chittaro (2006) gave an overview of the challenges of designing visualizations for mobile small-screen devices, such as limited screen space and computational power, as well as differences in interaction possibilities, while Neshati et al. (2019) similarly discussed design challenges for data visualizations on small smartwatch screens. Horak et al. (2021) described the design space of responsive visualizations, focusing on mobile devices. We consider these studies and the design space when designing our small-scale visualizations.
2.2 Studies on animated transitions
The use of animated transitions between (normal-sized) visualizations to help with data comprehension proved effective in several studies. Comparing small multiples to animated transitions, Archambault et al. (2011) conducted a study on animated graphs versus their small multiples versions. They found that, although with small multiples the participants answered faster for graph comprehension tasks, they also had a higher error rate than with animated graphs for tasks of determining changes in the graph structures. In a study, Peña-Araya et al. (2020) compared the effectiveness of small multiples, animation, and glyphs, for visualizing geographic propagation. They found that with small multiples, participants answered quickest, and animation yielded the highest confidence in participants’ answers, although overall performance depended on the tasks. A study by Brehmer et al. (2020) compared finding trends in small multiples of scatter plots versus their animated versions, on mobile phones. They found that with small multiples, people performed the tasks faster, but with less confidence than with the animated versions, while accuracy was task dependent. Overall, most studies found that with animation it takes people slightly more time to perform a task than without, while the error rate is slightly lower, and participants generally prefer animations over the alternatives. Thus far, it remains an open question whether similar results hold for small-scale visualizations, although we have first results from the study in our previous paper (Huth et al. 2022).
2.3 Animated transition design
Several previous works describe the design space of animated transitions for normal-sized visualizations, and study the effectiveness of animated transitions for tasks like exploration, comparison, or summarizing. For example, Heer and Robertson (2007) introduced theoretical groundwork and a taxonomy for transitions between charts, as well as design principles. They performed a study and found that animated transitions help with graphical perception. Kim et al. (2019) described a design space of animations for showing data aggregation. They complemented their work with a study of different animation types and found that animations help people to understand the aggregation better, although sometimes increasing the required time to solve a task. For high dimensional data, Elmqvist et al. (2008) presented an interactive navigation approach between scatter plots of multidimensional data, in a scatter plot matrix, as a dice rolling animation. The animation can be used to explore multidimensional datasets by moving through the scatter plot matrix. Wang and Mueller (2018) introduced a system that supports exploration of high dimensional data by transitioning between scatter plot visualizations of 3-dimensional subspaces of the data, supported by a trail map of consistent thumbnail previews. What has not been investigated yet is how animated transitions can be designed for small-scale visualizations and how well people understand the small-scale transitions, without helpful features such as labels or axes.
2.4 Recommender systems
From the design space of animated transitions between normal-sized visualizations stem recommender systems for animation sequences. For example, Graph Scape by Kim et al. (2017) maps out transitions between charts as a graph, with costs assigned to each transition, based on the mental effort to follow the transition. The authors determined the cost values through studies and refined them over the years and during the development of their recommender system Gemini (Kim and Heer 2021, 2021). Data Animator by Thompson et al. (2021) is a similar system that uses the Data Illustrator (Liu et al. 2018) framework, while Shi et al. (2019) use reinforcement learning to suggest chart sequences based on analysts’ tasks. However, thus far, there are no animation sequence recommender systems that consider the unique challenges that come with creating animations on a smaller scale. As a first step, we need to better understand the effectiveness of animated transitions between small-scale visualizations.
2.5 Summary
There are multiple research gaps that exist in the field of animated transitions between small-scale visualizations, which our paper can only partly address. In our previous work (Huth et al. 2022) and in this extension, we report on first insights. In addition, we provide basic design considerations and test performance with two online studies.
3 Design considerations
Visualizations consist of marks, including points, lines, areas, or even volumes, which have attributes such as position, size, shape, orientation, hue, saturation, and many others, as well as labels, legends, axes, and gridlines (Munzner 2014). Due to the limited space, in small-scale visualizations, labels, axes, gridlines, and legends are often omitted and are inferred from the context of the visualization. In the following, we discuss design considerations specific to small-scale visualizations.
3.1 Chart types
Not all visualization types are suitable for small-scale visualizations with limited pixel space, for example, Latif and Beck (2018) describe visualization types applicable as word-scale visualizations. Visual clutter needs to be avoided, and chart types that use position to encode information are harder to read when small. Small-scale visualizations typically do not contain more than two attributes of a dataset, such as a bar chart that shows the average horsepower by number of cylinders of a collection of cars, or a line chart showing the average horsepower of new cars over time. We, therefore, focus on analyzing animated transitions between suitable visualization types. We consider those to be bar charts  , grouped or stacked bar charts
  (if the number of categories is small), line charts
  , area charts
  , box plots
  , and scatter plots
  . What data types are applicable is closely correlated with the chart types. In our analysis, we focus on multidimensional data. Other typical visualizations for multidimensional data are, for example, parallel coordinate plots or scatter plot matrices. However, they are not suited for our case because essential visualization elements quickly become unidentifiable on a small scale.
3.2 Animated transitions
Chalbi et al. (2020), Heer and Robertson (2007), Horak et al. (2021) and Kim et al. (2017) described types of changes to the key elements of a visualization, that occur separately or in combination with each other when animating a visualization. The changes performed in an animation can be split into subsequent steps. Each step is called a keyframe.
In an axis re-scaling operation, the maximum or minimum axis values are changed. This entails a change in position of the marks. When performing a panning or zooming operation, the viewpoint changes and with it the axis scale and the position of the marks. Changing how the underlying data is filtered involves adding or removing marks and may require re-scaling the axes before or after the change of the mark, to account for new maximum and minimum data values. The data re-ordering operation involves altering the position of the marks and axis labels. A modification of the encoding of the data, for example, from bars to points, is usually done because of data aggregation or an adjustment of the level of detail, and entails an axis change. When changing one of the data attributes that are visualized, an axis has to be changed accordingly. Whereas, changing the level of detail of the visualized data might entail a color change for some of the marks. Another class of animated transitions are timesteps, in detail analyzed by Archambault et al. (2011) and Brehmer et al. (2020). In a timestep, typically only the marks change, while leaving the axis scaling intact to ensure comparability.
When designing animated transitions for visualizations, it is important to preserve an analysts’ mental model of the data. Guidelines for normal-sized visualizations include that during animation, the relation between the marks and axes should remain meaningful, that is, marks should not be reassigned to a different semantic. For example, when re-scaling an axis, the marks should move to their new position along with the axis instead of delayed in the next keyframe. Further, one should avoid ambiguity in marks and occlusions of the marks, as well as make use of staging with keyframes to ease the understanding of transitions with changes to multiple visualization elements. All these guidelines hold for small-scale animated transitions as well. A factor that works in favor of small-scale animated transitions is that all marks are in focus of the viewer, and none in their peripheral vision as in normal-sized visualizations, making small-scale mark movement easier to follow.
In normal-sized visualizations, changes to the marks or axes can be grouped and played simultaneously, which in small-scale might require too much mental effort to follow. In contrast to normal-sized visualizations, in small-scale visualizations the axes often are omitted, which increases the mental effort for an analyst to follow an animation that involves changes to an axis. When the only change is a re-scaling of the axis, the axis change is still understandable in how the marks move because of the law of common fate. For all changes affecting an axis, it might be beneficial to temporarily show that axis while slightly decreasing the size of the other visualization elements, in case it is not possible to temporarily enlarge the whole visualization.
Some operation types require many changes to the marks and data attributes; therefore, the animation needs a larger number of intermediate keyframes and more time, which might lead to problems with the mental map the viewer has of the data. For example, when the initial visualization is a bar chart that shows aggregated data and a plotted data attribute is changed, if the bars are simply changed to show the data for the new attribute, it can be difficult for analysts to make the connection between the corresponding marks. Such an operation type requires intermediate steps displaying the path of the marks throughout the transition, for example, by changing the mark type to show the un-aggregated data.
Some consideration is required for scenarios, in which there are multiple small-scale visualizations of the same type on the screen, for example, on a map, and analysts transition one of them. The question is, whether the other visualizations should transition accordingly. If they do, it would put a high mental load on the viewer, who can only focus on one visualization at a time. We, therefore, recommend using the animated transition in only one visualization at a time, even though in that case the inconsistency of visualization types might be perceived as somewhat confusing.
3.3 Aiding the understanding of an animated transition
An option to ease the mental load of following animated transitions between small-scale visualizations is to enlarge the visualization temporarily and add axes and labels. In this normal-sized version, the animation is played and due to the additional information it is presumable easier to follow. After the animation finishes, the visualization is re-sized back to its small-scale version. For designing a larger version of a visualization, insights from responsive visualization research (Hoffswell et al. 2020; Kim et al. 2021a, b) can be employed. However, on a smartphone or smartwatch, it might not be feasible to increase the size of the visualization momentarily because of screen size limitations. An alternative could be to show axes and labels temporarily to support understanding of the transition. Although this decreases the space left for the marks, it could still be a good solution.
Another possibility to help analysts better understand the animated transition is to split it into more keyframes than a normal-sized one, such that there is only one change type at a time. Examples for this keyframe by keyframe change can be seen in Fig. 1. When performing the animated transition operations attribute change or sorting, marks often overlap, increasing the difficulty of following specific marks through the transition. We, therefore, recommend enabling analysts to highlight marks they want to observe, for example, with a color or shape different to the rest of the marks.
3.4 Animation duration
When choosing the duration of an animation, there is a tradeoff between being slow and having to repeat the animation. The duration of the animated transition should be neither too long nor too short to avoid both waiting time and unnecessary replay. In previous work, Heer and Robertson (2007) as well as Robertson et al. (2002) recommended a duration of one second for each animated transition stage. With an increased number of keyframes for small-scale visualizations, taking one second between each pair of keyframes may lead to long overall animation durations and disengagement. Because of the decreased complexity of each animated transition keyframe but presumably increased mental load due to the smaller size of the visualization, we propose to use the same animation duration for small-scale visualizations compared to normal-sized visualizations.
3.5 Visual cues
For the existence of more visualizations that can be transitioned to, there should be visual cues for the analyst. Some of the possible clickable visual cues are dots below the chart, arrows left and right of the chart, a ‘shadow cards’ effect, or a preview on mouseover, as demonstrated in Fig. 2. On touchscreens, swiping is also an option to trigger the animated transition, and on smartphones and smartwatches, the preferred option due to the limited screen size. There are benefits and drawbacks to each of these visual cues, for example, if there are more than two visualizations, with dots, it is possible to transition between two not ‘neighboring’ charts, and the animated transition has to use more keyframes and is presumably harder to understand. A preview on mouseover blocks other options for mouseover effects, and shadow cards or dots might be too small to target with a mouse pointer. For our studies, we decided to use arrows.

Visual cues for possible transitions between visualizations
4 Evaluation
To assess the mental load for people following animated transitions between small-scale visualizations, as well as whether they could read the visualizations well and understand their information, we performed two online studies. In the first online study, we investigated filter, sort, and attribute change operations as animated transition changes (Huth et al. 2022). In the second online study, we focused on the aggregate operations minimum, maximum, median, average, sum, and count. We also performed two smaller pilot studies to find suitable parameters for the study conditions. We have approval from the university’s ethics board for the project this research is part of and all studies within the project.
We want to answer the research question whether animated transitions between small-scale visualizations are the same as those between normal-sized ones. We aim to compare accuracy and task completion time, animated transition play count, perceived difficulty and confidence in answers, general satisfaction with the animated transitions, as well as testing which type of transitioning between small-scale visualizations performs best. All visualizations are based on a car data set (Auto MPG 1993). We designed the animated transitions with the help of Gemini (Kim and Heer 2021, 2021), using an animation speed of 1s per keyframe. We manually fine-tuned the animated transitions in D3.js (Bostock 2012), following our design considerations. Example videos of the stimuli can be found in our OSF wiki (OSF 2022).
4.1 Stimuli
Small-scale visualizations in settings like those we described earlier always exist in context. Information on the plotted data attributes is inferred from this context, explicitly via text labels, or implicitly by, for example, previous steps an analyst took. We, therefore, added describing text below the visualization to state which data attributes in which range are shown on the x- and y-axis.
 are those that make little sense semantically,
  those we used in our first online study,
 those we used in the second online study, and
  those we decided not to use
We aim to keep confounding factors like visual literacy low, so for our online studies we chose the basic chart types scatter plot, line chart, and bar chart, to transition between for viewing multiple data attributes. Common data transformations between these chart types in animated transitions are aggregate, filter, sort, and attribute change (Chalbi et al. 2020; Heer and Robertson 2007; Kim et al. 2017; Qu and Hullman 2018). Of all possible combinations listed in Table 1, we chose those that are semantically reasonable and most commonly used. Filter, sort, and attribute change make most sense within the same visualization type. Changing the plotted data attribute in scatter plots is often used for exploring multidimensional data (Elmqvist et al. 2008; Wang and Mueller 2018). The operation type aggregation can be further subdivided into, for example, binning, averaging, aggregating to median, minimum or maximum. Because of these many subcategories, we carried out two separate online studies for the different types of operations.
For our first online study, we investigated filter, sort, and attribute change operations. In the second online study, we focused on aggregate operations. The latter include aggregating to minimum, maximum, median, average, sum, count, standard deviation, and inter-quartile-range, according to the taxonomy of Kim et al. (2019). Aggregating to average was part of some stimuli in the first online study, with bar and line chart attribute change, but is worth looking at in isolation. We decided to omit the aggregate operations standard deviation and inter-quartile-range, because we cannot assume that an online study audience is familiar with these operations. For temporal data, aggregation to line charts is often used, but to keep the complexity of the study design low we decided to aggregate to bar charts for operations that collect points, that is, average, sum, count, and to scatter plots for operations that select points, that is, minimum, maximum, median. For designing the animated transitions for aggregations between normal-sized visualizations, we used the versions that performed best in the paper by Kim et al. (2019), and for the small-scale visualizations, we adapted them according to our design considerations.

Size comparison of visualizations used in the studies, a small-scale visualization (left) and its normal-sized equivalent (right)

Example of axis re-scaling and mark change animations between a small-scale and b normal-sized visualizations
The small-scale visualizations had a height of 2 lines of text and an aspect ratio of 2:1. The normal-sized versions were 7 times larger (Fig. 3). An example of the difference in the animation sequence between small-scale and normal-sized visualizations is shown in Fig. 4. Between small-scale visualizations, only one type of change to the marks is performed per keyframe. Between normal-sized visualizations, changes are presumably easier to follow and thus combined into multiple changes per keyframe.
4.2 Tasks
We asked participants to perform three types of tasks.
(T1) Object Tracking. The first task was to follow a mark from the initial visualization and determine its position in the second visualization. In the visualization participants saw first, one mark was highlighted with a red outline in the bar charts and colored entirely in red in the line charts and scatter plots. During the animated transition, the highlight was removed, and participants were given three answer options of marks highlighted with different colors in the second visualization. Although for aggregate operations this task becomes almost trivial—solving it requires to merely focus on the x-value of the highlighted mark —we kept it for comparability to the first online study.
(T2) Operation Identification. The second task type was semantic. Here, we asked how the data changed from the initial to the end visualization. For example, whether the data were filtered, sorted, or an attribute changed in the first online study, and in the second online study, which type of aggregate operation was performed. In the second online study, for comparability of both studies, we grouped answer options into sets of three, depending on the chart type, that is, aggregating to points representing the minimum, maximum, median, or to bars representing the average, sum, or count.
(T3) Data Exploration. The last task type was about data exploration. We used only the attribute change operation and asked questions about attributes of a specific data group, that could only be answered when connecting the data properties of both visualizations. For example, when the attribute on the y-axis changed from y1 to y2, we asked whether low values of y1 correspond to high or low values of y2 and x. Because the second online study did not include attribute change operations, Task T3 was omitted in that study.
With Tasks T1 and T2, we tested the general understandability of animated transitions between small-scale visualizations. With Task T3, we tested whether they are suited to explore multiple data attributes. We did not randomize the order of the task categories, because Task T1 also served a role to familiarize participants with the semantics of the animation operations, and Task T3 is a more complicated task.
4.3 Study process
After participants read and agreed to the consent form, we asked them to scale their browser window to match a given frame on the screen to approximately credit card size. This was to achieve a similar size of the visualizations for all participants. Then, we asked demographic questions, introduced the chart types scatter plot, bar chart, and line chart, and asked about participants’ experience with these chart types, as well as with animation in visualizations.
We gave participants a training task before the main part of both studies, with all question types on the same page, to introduce the tasks of the studies. The data for the training task contained a subset of 12 items from the dataset. The operation in the animated transition for the training task was filtering data in a scatter plot in the first online study, and aggregation to the median in the second online study.
In between tasks, we asked participants to rate the difficulty of answering the questions and the confidence in their answers. To gauge whether the participants used the visualizations or just the accompanying textual context to solve the tasks, we asked whether they focused mostly on the visualizations, the accompanying text, or both. Further, we asked about participants’ previous experience with visualizations and animation, their satisfaction with the animated transitions in general and the animation speed in particular, as well as whether they leaned closer to the screen during the study.
In the main part, for Task T1, each participant saw 3 stimuli per operation type, and between each block the qualitative rating questions. We randomized the order in which participants saw the stimuli within each operation type, as well as the order of the transition types, to account for learning effects during study participation. For Task T2, each participant saw 3 stimuli per transition type, in random order over all operation types and stimuli, and after that again the qualitative questions. For Task T3 in the first online study, each participant saw 3 stimuli of the operation type attribute change for all chart types. In each of the study conditions, we had a total of 51 stimuli per participant in the first online study and 36 stimuli per participant in the second online study. The respective question for each stimulus was shown on the same page, and it was possible to trigger the animated transitions to switch back and forth between the visualizations without limitations.
4.4 Conditions
We compare the following versions of animated transitions between the visualizations.
- (C1):
-
Baseline condition—animated transitions between normal-sized visualizations.
- (C2):
-
Transitioning between small-scale visualizations without animation—participants can switch between small-scale visualizations, the initial visualization is sliding out and is replaced by the second one.
- (C3):
-
Animated transitions between small-scale visualizations.
- (C4):
-
Animated transitions between temporarily enlarged small-scale visualizations—the small-scale visualization is scaled to normal size, the same animation sequence as for C1 plays, and the visualization scales back to a small-scale one afterward.
- (C5):
-
The same condition as described in C4, but with a 2s pause between re-scaling and animated transition.
-
First pilot study We tested the concept and technical setup of our first online study with five local participants with a computer science background and some visualization experience. Our main goal was to collect qualitative feedback on the study tasks, the understandability of the instructions, and the time needed to complete the study. We also let some participants compare stimuli between multiple conditions. In this pilot study, C2 performed poorly for solving our tasks, especially Task T1, indicating that animation in the transitions is needed to understand the relation between the data in the visualizations. We, therefore, decided to omit this condition in the online studies.
-
Second pilot study In the qualitative feedback of the first online study, participants rated the animated transition speed of condition C4 as too fast. We presume that viewers need more time to familiarize themselves with the enlarged visualizations before the actual animated transition starts, which is consistent with the performance results of the other study conditions. We, therefore, added C5 after evaluating the first online study and re-ran the study with just this condition. For finding a suitable pause duration, we ran a pilot study with 16 participants from our lab. We used the same stimuli as for Task T1 in the initial study, tested pause durations of 1 to 5 seconds (within-subject) and asked whether the pause was too long or short on a 5-point Likert scale. In the responses, the rating shifted from the pause being perceived as too short to being too long between 1s and 2s (Fig. 5). We decided on a 2s pause duration for C5, taking into account that the participants of the pilot study were visualization experts and the participants of the online study might need a slightly longer pause.
Fig. 5 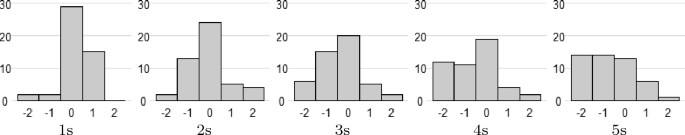
For the second pilot study, histogram of ratings (\(-2\) is too short, 2 is too long) for the pause durations between re-scaling the visualization and playing the animated transition

5 Study results
We performed the studies as between-subjects online studies on the platform Prolific [42] with 37 participants per condition. The first online study initially had 111 participants with conditions C1, C3, and C4, and later additional 37 participants with condition C5, leading to a total of 148 participants for the first online study. In the second online study, we recruited 111 participants with conditions C1, C3, and C5, again 37 per condition. We rejected the results of 27 participants (17 in the first and 10 in the second online study) who used a mobile phone for the study or did not click the arrow to view the animated transition for more than \(25\%\) of the stimuli.
Of the 148 participants in the first online study, 70 identified as  , 73 as
  , and 5
 . Eighty-eight participants were
  , 41 participants were
  , and 19 were
 . In the second online study, participants were slightly older. Fifty-five of the 111 participants were
  , 44 were
  , and 12 were
 . The gender distribution was similar to that of the first online study, with 55 participants identifying as
  , 54 as
  , and 2
 . In both studies, approximately \(80\%\)
 of the participants stated they were at least somewhat familiar with the visualizations, but only \(28\%\)
 stated that they have at least some experience with animation in visualizations.
For some stimuli, participants answered the question without viewing the animation. In the first online study, this happened 204 times out of 7548 total stimuli over all participants (\(2.7\%\)). The majority of those, 182 times (\(2.4\%\)), occurred in the data exploration Task T3. One participant remarked that with some general knowledge about car properties, it was possible to answer Task T3 by only reading the question and the answer options, without looking at the visualizations. Because Task T3 was the last question set, fatigue might also play a role. In the second online study, for all participants, there were only 25 occurrences out of 3996 total stimuli (\(0.6\%\)) for which the question was answered without triggering the animated transition. Because such behavior does not reflect the study task, we excluded the few individual stimuli in the analysis for which participants did not view the animated transition.
Some participants do not complete online studies without taking breaks. In our response time analysis, we account for this by excluding outlier response times. We follow the definitions and recommendations of Berger and Kiefer (2021), and define outliers as response times that are above the median plus two standard deviations, separate for each task type and participant. This results in removing 671 out of 11544 response times (\(5.8\%\)).
5.1 Analysis method
In the following analysis, we calculate average values and \(95\%\) Bootstrap confidence intervals, which means that we have \(95\%\) confidence that the population mean is contained within the interval. We used BCa bootstrapping to create the confidence intervals (5000 bootstrap iterations).
We also do pairwise comparisons between the study conditions, using Bootstrap CI calculations for two independent samples. In these pairwise comparisons, we perform Bonferroni corrections (Higgins 2004) to counteract the family-wise error rate. We separate each task and each performance measure, i.e., completion time, play count, accuracy, and each of the qualitative ratings, into a different family. We also separate the first and the second online study into different families, because participants saw different stimuli in each of the studies. In the comparative analysis of operation types in the animated transitions, the types filter, attribute change, and sort, were within-subject in the first online study, and the types minimum, maximum, median, average, sum, and count, were within-subject in the second online study. For Tasks T1 and T2, there are \(\frac{num\_conditions(num\_conditions-1)}{2} * (num\_operation\_types + 1\_overall)\) pairwise comparisons for each quantitative performance measure, in the first online study these are \(\frac{4*3}{2} * (3 + 1) = 24\), and in the second online study \(\frac{3*2}{2} * (6 + 1) = 21\) pairwise comparisons. For Task T3, we only have the attribute change operation type, and thus only \(\frac{num\_conditions(num\_conditions-1)}{2} = \frac{4*3}{2} =6\) pairwise comparisons per quantitative performance measure. For the qualitative performance measures, we do not split by operation type and thus have 6 pairwise comparisons for the first, and 3 pairwise comparisons for the second online study each.
To interpret the confidence interval of a pairwise difference, we inspect that if the interval does not overlap with 0, then there is evidence of a difference in that pair, equivalent to a result that is shown to be statistically significant using p-value tests. The strength of the evidence increases with the distance of the interval moving away from 0 and the confidence range becoming narrower. The Krzywinski and Altman (2013) approach can be used to determine equivalent p-values. Our analysis follows recommendations in the literature (Besançon and Dragicevic 2017, 2019; Cockburn et al. 2020; Cumming 2013; Dragicevic 2016), i.e., we show confidence intervals and report evidence and tendencies for differences between conditions.
The exact numbers depicted in the charts, R scripts for the calculations, and more statistical graphics can be found in our OSF wiki (OSF 2022).
5.2 Task T1: object tracking
Completion time In Fig. 6, we show the average time that participants needed to answer the question for each stimulus in Task T1. We show the average value and the \(95\%\) confidence interval, as well as Bonferroni corrected pairwise differences between the conditions. In both online studies, participants in all conditions needed a similar amount of time for each stimulus, with a tendency that participants with condition C5 needed more time than those with condition C4 in the first online study. When we consider task completion time separately for each type of operation that is performed in the animated transition (Fig. 7), there, too, are only small differences between conditions. For filtering data and attribute change, there is a tendency that participants with condition C5 needed longer than those with condition C4, and for attribute change a tendency that participants with condition C1 needed more time than those with C4. operation, participants with C1 needed more time in T1 than for those that showed sorting, aggregation to maximum or average. Participants with C5 needed the most time for the attribute change, aggregation to median, and count operation types. In task category T2, participants with condition C1 took the longest to recognize average, sum, and count aggregations, and participants with C5 were quickest in recognizing the sort operation type but needed more time for sum and count than for most other operation types. For participants with C3, the task completion times for the different operation types are closer together, there is evidence only that aggregation to sum takes longer to recognize than the sort, filter, and maximum operation types.

Task T1 completion time in seconds per stimulus, average with \(95\%\) bootstrap confidence intervals (left chart, respectively). Pairwise differences between the study conditions (right chart, respectively), with red lines indicating the Bonferroni corrections for 24 and 21 pairwise comparisons in the first and the second online study, respectively

Task T1 completion time in seconds per stimulus, comparison between operation types, with  ,
,  ,
,  , and
, and  . Pairwise differences between the conditions (right chart, respectively), with red lines indicating the Bonferroni corrections for 24 and 21 pairwise comparisons in the first and the second online study, respectively
Play count To answer the question for each stimulus, participants needed to view the animated transition at least once, but sometimes they viewed it multiple times as shown in Fig. 8. There is no evidence of a difference between the conditions. In Fig. 9, we show the average number of animated transitions triggered per stimulus split up by operation type. Between conditions, we see the largest differences for sorting, for which there is evidence that participants with C3 triggered the transition more often than those in conditions C4 and C5, and a tendency for a higher play count of participants with condition C3 than that of participants with C1. For the aggregation to median operation type, there is weak evidence that participants with condition C3 played the animated transitions more often than those with condition C1. For aggregation to median and to average, there is a tendency that participants with condition C3 triggered the animated transitions more often than those with condition C5, and for filtering more often than participants with condition C1. There is a tendency that for attribute change, participants with condition C1 played the animated transitions more often than those with condition C4, and for aggregation to sum, more often than participants with condition C5.

Task T1 play count per stimulus, average with \(95\%\) bootstrap confidence intervals (left chart). Pairwise differences between the study conditions (right chart), with red lines indicating the Bonferroni corrections for 24 and 21 pairwise comparisons in the first and the second online study, respectively

Task T1 play count per stimulus, comparison between operation types, with  ,
,  ,
,  , and
, and  . Pairwise differences between the conditions (right chart, respectively), with red lines indicating the Bonferroni corrections for 24 and 21 pairwise comparisons in the first and the second online study, respectively
Accuracy We show a comparison of the average error rates of the participants’ answers in Fig. 10. In the first online study, there is strong evidence of a difference between condition C3 in comparison to C1, C4, as well as C5, in the percentage of wrong answers. While participants with conditions C1, C4 and C5 performed similarly with a \(10\%\) error rate, those with condition C3 performed worse with \(28\%\) incorrect answers on average. In the second online study, participants with condition C1 gave almost no incorrect answers in Task T1, resulting in weak evidence of a difference between C1 and C3, and a tendency for a difference between C1 and C5.

Task T1 error rate in percent, average with \(95\%\) bootstrap confidence intervals (left chart). Pairwise differences between the study conditions (right chart), with red lines indicating the Bonferroni corrections for 24 and 21 pairwise comparisons in the first and the second online study, respectively

Task T1 error rate in percent, comparison between operation types, with  ,
,  ,
,  , and
, and  . Pairwise differences between the conditions (right chart), with red lines indicating the Bonferroni corrections for 24 and 21 pairwise comparisons in the first and the second online study, respectively
We show a comparison of error rates between operation types in Fig. 11. For the filtering, attribute change, and sorting operations of the first online study, there is evidence that participants with condition C3 had a higher error rate than those with the other conditions. The evidence is strong for the difference between conditions C3 and C1 for filtering, between conditions C3 and C4 for attribute change, and between conditions C3 and C5 for sorting. For aggregation to minimum, median, and average, there is evidence that participants with condition C3 had a higher error rate than those with condition C1, and weak evidence that participants with condition C5 had a higher error rate than those with condition C1. For aggregation to maximum, there is weak evidence for a lower error rate of participants with condition C1 than of participants with conditions C3 and C5. For aggregation to sum and median, there is a tendency that participants with condition C1 had a lower error rate than those with condition C3, and for aggregation to count and median, a lower error rate than those with condition C5. or maximum, all transition types had a higher error rate than those with the other conditions. For the sorting transition type, the error rate of C3 differs most from the other conditions, which might be due to unavoidable overlap of data marks during the animation and missing axis labels. In Task T1, within the operations of the first online study, and within the aggregate operations, there are similar error rate patterns.
Note that the results in Fig. 11 deviate slightly from those reported in our previous paper (Huth et al. 2022). This is due to a mistake in our analysis of the study results for comparing error rates between operation types for Task T1, which did slightly change some of our reported error rates but not the overall trend.
Qualitative results To estimate mental load, we asked participants to report their perceived difficulty in connecting the content of the visualizations with the help of the animated transitions (Fig. 12). The difficulty of the first online study was rated similarly by participants with all conditions, with a tendency toward a higher difficulty rating by participants with condition C3 than by those with conditions C1 and C4. In the first online study, there is evidence that participants with condition C3 were less confident in their answers than those with condition C1, and strong evidence for participants with condition C3 being less confident than those with condition C4. Also in the first online study, there is a tendency for a higher confidence rating by participants with condition C4 than by those with condition C5, and that participants with condition C5 rated their confidence higher than those with condition C3. In the second online study, there is strong evidence that participants with condition C3 rated the task more difficult and were less confident in their answers than participants with the other conditions.

For Task T1, (left) rated difficulty of connecting the data between the visualizations through the animated transitions (0 is low, 4 is high difficulty), (middle) rated confidence that the given answers are correct (0 is low, 4 is high confidence), and (right) percentage of what participants stated they focused most on to solve the tasks—the visualizations (light shade), accompanying text (dark shade), or both (medium shade), for  ,
,  ,
,  , and
, and  . Shown are averages with \(95\%\) bootstrap confidence intervals (left chart), and pairwise differences between the study conditions (right chart), with red lines indicating the Bonferroni corrections for 6 and 3 pairwise comparisons in the first and the second online study, respectively
The object tracking task T1 was answered by the participants by mostly focusing on the visualizations and not on the data context that was given by the text label. With condition C3, there were less participants that stated they focused mostly on the visualization than with the other conditions.
5.3 Task T2: operation identification
Completion time In Task T2, there is weak evidence that for the first online study operation type, participants with condition C1 answered the questions faster than participants in conditions C3 and C5 (Fig. 13). There is a tendency that for the filter operation type, participants with condition C1 were faster than those with conditions C3 and C5. For attribute change, there is evidence that participants with condition C1 were faster than those with condition C5, strong evidence that participants with condition C1 were faster than those with condition C3, and a tendency that participants with condition C4 were faster than those with condition C3 but needed more time than participants with condition C1 (Fig. 14). For aggregation to minimum, there is a tendency that participants with condition C1 were quicker than those with condition C3. For aggregation to maximum, there is a tendency that participants with condition C5 needed more time than those with condition C3.

Task T2 completion time in seconds per stimulus, average with \(95\%\) bootstrap confidence intervals (left chart, respectively). Pairwise differences between the study conditions (right chart), with red lines indicating the Bonferroni corrections for 24 and 21 pairwise comparisons in the first and the second online study, respectively

Task T2 completion time in seconds per stimulus, comparison between operation
types, with  ,
,  ,
,  , and
, and  . Pairwise differences between the conditions (right chart, respectively), with red lines indicating the Bonferroni corrections for 24 and 21 pairwise comparisons in the first and the second online study, respectively
Play count There is weak evidence that for Task T2, participants with condition C5 triggered the animations less often than those with C1 in the first online study (Fig. 15). There is a tendency that participants with condition C5 repeated the animated transitions less often than those with condition C3, and a tendency that participants with C1 had a higher play count than those with C4. In the second online study, there is evidence that participants with condition C3 viewed the transitions more often than those with condition C5, and strong evidence that participants with C1 had a higher play count than those with C5.

Task T2 play count per stimulus, average with \(95\%\) bootstrap confidence intervals (left chart). Pairwise differences between the study conditions (right chart), with red lines indicating the Bonferroni corrections for 24 and 21 pairwise comparisons in the first and the second online study, respectively

Task T2 play count per stimulus, comparison between operation types, with  ,
,  ,
,  , and
, and  . Pairwise differences between the study conditions (right chart), with red lines indicating the Bonferroni corrections for 24 and 21 pairwise comparisons in the first and the second online study, respectively
For filtering, participants with condition C1 had a higher play count than those with the other conditions. For the sort operation type, there is evidence that participants with condition C3 had a higher play count than those with condition C5. For filtering, and aggregation to minimum, median, and count, there is evidence, for average there is strong evidence, for sum weak evidence, and for attribute change, sort, and maximum a tendency, that participants with condition C1 played the animated transitions more often than those with condition C5 more often than those with conditions C3 and C5 (Fig. 16). There is a tendency that participants with condition C1 had a higher play count than those with C3 for filtering and aggregation to average, and a higher play count than participants with C4 for filtering. Participants with condition C3 had a higher play count than those with C5 for sort and aggregation to minimum with evidence, to median with weak evidence, and to maximum, average, sum and count with a tendency. For sorting, there is a tendency that participants with condition C3 had a higher play count than those with condition C4.
Accuracy For Task T2, participants with C3 answered the least correct with evidence of a difference to conditions C1 and C5, which in the second online study is strong evidence for C1 and weak evidence for C5 (Fig. 17). In Fig. 18, we see that participants with condition C3 had a higher error rate than those with condition C1 for aggregation to minimum and average with strong evidence, for attribute change, sort, and sum with evidence, for aggregation to median with weak evidence, and for filtering with a tendency. For attribute change, there is a tendency that participants with condition C3 had a higher error rate than those with C4. or count, and (except for C1) for attribute change, and aggregation to min or average there is higher error rate than for the other operation types For filtering, sorting, and aggregation to minimum, there is evidence, and for attribute change and aggregation to median, average, and sum there is a tendency, that participants with condition C5 had a lower error rate than those with condition C3. There is a tendency that participants with condition C5 had a higher error rate than those with C1 for aggregation to sum, and a lower error rate than participants with C4 for filtering. and filtering operation types, participants with condition C3 had a higher error rate than those with conditions C1 and C5, and for aggregation to sum, participants with condition C1 gave more correct answers than participants with condition C3 and C5.

Task T2 error rate in percent, average with \(95\%\) bootstrap confidence intervals (left chart). Pairwise differences between the study conditions (right chart), with red lines indicating the Bonferroni corrections for 6 and 3 pairwise comparisons in the first and the second online study, respectively

Task T2 error rate in percent, comparison between operation types, with  ,
,  ,
,  , and
, and  . Pairwise differences between the conditions (right chart), with red lines indicating the Bonferroni corrections for 24 and 21 pairwise comparisons in the first and the second online study, respectively
Qualitative results In the first online study, there is evidence that participants with condition C3 rated the difficulty of Task T2 higher and the confidence in their answers lower than participants with conditions C1 and C5, and a tendency toward a difference between C3 and C4 for both difficulty and confidence (Fig. 19). In the second online study, there is evidence that participants with condition C3 rated difficulty higher and weak evidence that they rated their confidence lower than participants with condition C1, and a tendency for a difference of C3 to C5.

For Task T2, (left) rated difficulty of connecting the data between the visualizations through the animated transitions (0 is low, 4 is high difficulty), (middle) rated confidence that the given answers are correct (0 is low, 4 is high confidence), and (right) percentage of what participants stated they focused most on to solve the tasks—the visualizations (light shade), accompanying text (dark shade), or both (medium shade). With  ,
,  ,
,  , and
, and  , shown are averages with \(95\%\) bootstrap confidence intervals (left chart), and pairwise differences between the study conditions (right chart), with red lines indicating the Bonferroni corrections for 24 and 21 pairwise comparisons in the first and the second online study, respectively
In the first online study, participants stated they mostly focused on the visualization and accompanying text to solve the tasks. In the second online study, a similar number of participants focused on the visualization as those that focused on the visualization and accompanying text.
5.4 Task T3: data exploration
Completion time In Task T3, there is no evidence for differences between conditions in completion time, but a tendency that participants with condition C3 needed more time to solve the task than those with condition C5 (Fig. 20).

For Task T3, completion time in seconds, play count, and error rates in percent, with  ,
,  ,
,  , and
, and  . Shown are averages and \(95\%\) bootstrap confidence intervals (left chart, respectively). Pairwise differences between the study conditions (right chart, respectively), with red lines indicating the Bonferroni corrections for 6 pairwise comparisons
Play count There is evidence that participants with condition C4 had a higher play count than those with conditions C1 and strong evidence of a difference to C3. There is also evidence that participants with condition C5 repeated the animated transitions more often than those with C3.
Accuracy There is no evidence for differences between conditions regarding error rate.
Qualitative results There is evidence that participants with condition C1 were more confident in their answers than participants with condition C5 and a tendency that they rated the difficulty lower than those with conditions C4 and C5. There is a tendency that participants with condition C4 rated their confidence higher that those with C5. For the data exploration task T3, participants mostly relied on the textual content in combination with the visualizations (Fig. 21).

For Task T3, (left) rated difficulty of connecting the data between the visualizations through the animated transitions (0 is low, 4 is high difficulty), (middle) rated confidence that the given answers are correct (0 is low, 4 is high confidence), and (right) percentage of what participants stated they focused most on to solve the tasks—the visualizations (light shade), accompanying text (dark shade), or both (medium shade). With  ,
,  ,
,  , and
, and  , shown are averages with \(95\%\) bootstrap confidence intervals (left chart), and pairwise differences between the study conditions (right chart), with red lines indicating the Bonferroni corrections for 6 pairwise comparisons
5.5 Other qualitative results
We show answers to the general rating questions in Fig. 22. Participants with condition C1 rated the general satisfaction with the animated transitions highest in both online studies, with weak evidence for a difference to condition C4 in the first online study, a tendency toward a difference to C3 and C5 in the first online study, and with evidence of a difference to condition C3 in the second online study. In the first online study, participants with conditions C4 and C5 rated the animation speed as slightly too fast, with strong evidence of a difference to the better rating by participants with conditions C1 and C3. Similarly, in the second online study, there is strong evidence that participants with condition C5 rated the animation speed as too fast compared to participants with C3, and evidence that it was rated as too fast compared to C1. Overall, most participants reported that they sometimes or often leaned closer to the screen. In the first online study, there is a tendency toward a difference between conditions C1 and C5. In the second online study, there is weak evidence that participants with condition C3 leaned toward the screen more often than participants in condition C1.

Rated satisfaction with the animated transitions (left) from low (0) to high satisfaction (4). (middle) Animation speed from too slow (− 2) to too fast (2), and (right) how often participants reported leaning closer to the screen from never (0) to always (3) With  ,
,  ,
,  , and
, and  , with red lines indicating the Bonferroni corrections for 6 and 3 pairwise comparisons in the first and the second online study, respectively
Some participants reported strategies for solving the tasks. Strategies for the object tracking Task T1 include using their hands and trying to orient the marks’ value on the axes. One participant reported going back and forth between the visualizations to help make the data connection. Participants also reported that the accompanying text helped in understanding the visualizations and the animated transitions. In the second online study, for Task T1 participants reported concentrating on the x-values, and for Task T2 trying to learn the distinctions between the animation sequences. As general feedback, some participants stated that they found the tasks challenging, others wrote that completing the study was fun. Some participants with condition C5 would have preferred if the visualization stayed in normal size after the animated transition, instead of re-scaling back to small-scale.
6 Discussion
In the following, we discuss our findings and the limitations of the online studies.
6.1 Findings
Due to their form factor and the absence of describing features such as axes or legends, small-scale visualizations can be harder to interpret than normal-sized visualizations. We thus expected participants with C1, the animated transitions between normal-sized visualizations, to perform better than those with conditions C3 and C5, the animated transitions between small-scale visualizations, and wanted to investigate how much the performance differs. We saw evidence for a higher error rate for C3 than for the other conditions in about \(55\%\) of the cases in our comparative analysis, for both online studies. Especially for the sort operation type, participants with condition C3 had a high error rate, which might be due to unavoidable overlap of marks during the animation and missing axis labels. For participants with condition C5, there is evidence of a higher error rate than for participants with C1 in only \(10\%\) of our comparisons. Regarding task completion time and the number of times, the animated transition was triggered, and the results show no clear advantage of one condition over another.
We assumed that for the aggregate operations, Task T1 would be easy, which was confirmed by the quantitative and qualitative study results. In Task T1 in the second online study, and in the data exploration Task T3, participants with condition C3 perform only slightly worse than those with the other conditions, indicating that animated transitions between small-scale visualizations are suitable for those tasks in particular. T3 was challenging for participants with all conditions; they needed the most time and had the highest error rate, compared to the other tasks. Of the aggregation types, sum and count had the worst performance, for participants with all conditions. In the qualitative feedback, condition C3 was rated as slightly more difficult than the other conditions for Tasks T1 and T2 in both online studies, and confidence in answers was lower than for the other conditions.
As for animation speed, we saw that participants rated condition C4 as too fast, even when adding a pause between re-sizing and data animation (C5). In most of our metrics, C5 performed slightly better than C4. Overall, even between small-scale visualizations, animation in the transitions can be beneficial, compared to small-scale transitions without animation in condition C2, which we had to omit from the online study because some tasks were not reasonably solvable. When temporarily re-sizing a small-scale visualization, we recommend to pause after the re-size and play the animated transition only with another interaction by the analyst. One of the participants in the first pilot study remarked that it would be helpful to control the speed of the animation and pause it, for example, with a pause button or a slider like the one used by Archambault et al. (2011), or to customize the animation speed.
Depending on the application scenario, it might be beneficial to keep the currently focused on visualization at normal size. For example, for word-scale visualizations in a text, the text position can adapt to different visualization sizes, or the visualization can cover the text temporarily. Geographical features are briefly obscured by a temporarily enlarged visualization on maps, which is acceptable because analysts are focused on the visualization itself. On a mobile device, however, the visualization might take up a too large portion of the screen.
Finally, we recommend using as much screen space as possible for animated transitions, but have shown that animation between small-scale visualizations can still be effective for helping understand the relation of data between the visualizations. In usage scenarios for which it is not feasible to temporarily enlarge the small-scale visualization for the animated transition, the performance is still acceptable. There is evidence of a difference of condition C3 to the other conditions, but mostly there are only small differences. Although error rates tended to be higher, participants did not need more time for task completion for animated transitions between small-scale visualizations, compared to normal-sized ones. For normal-sized animated transitions participants rated task difficulty, confidence in their answers, as well as satisfaction with the animation, only slightly better than for small-scale animated transitions.
We found no correlation of task performance with any of the demographic data, visualization or animation experience, indicating that our results hold for casual as well as expert analytics usage scenarios.
6.2 Limitations
We chose the basic chart types bar chart, line chart, and scatter plot for our online studies because participants were a broad audience from the Prolific platform and not visualization experts, and could not be presumed to be familiar with more complex chart types. It would be interesting to extend the analysis to other chart types. There was overplotting in the scatter plots that were shown in our studies, which is even worse in small scale.
Further, the distribution of participants in our online studies was not representative of the general population. We had a balanced gender distribution, but did not balance other factors, such as cultural background or age. Expertise with the dataset we used, or with cars in general, may also be a confounding factor. Another limitation is the format of online studies (Borgo et al. 2018). In contrast to lab studies, observing nuances in participants’ behavior, or making sure they are not distracted, is not possible. We cannot be sure that participants answered the subjective questions truthfully. We also had limited control over their screen size and resolution, or the stability of their internet connection and browser performance without lags. Although we instructed participants to zoom the study page to a given size and logged zoom interactions, there were no means of making sure they actually did. Participants have an incentive to complete the online studies fast because they are paid a set sum for participating, but they may not always be motivated to provide accurate answers.
It is worth noting that some of the animations in C1 are 2s shorter than those in C3, because in C3 we use more keyframes (except for attribute change in scatter plots, sorting, and aggregation to maximum, sum, and count). In C4, the visualization is re-sized before the animated transition starts, making it 2s longer compared to C1, and C5 is 6s longer than C1 and 4s longer than C4 because of the pause between re-sizing and the animation of the data change. These differences influenced the response time results and were beyond participants’ control.
In the introduction, we posed application scenarios for the animated transitions, but in our online studies, we examined a more general setting. Although technically the results are applicable in other situations, it remains to be verified that the study’s findings apply to our application scenarios.
7 Future work
Recommender systems and automation attempts like Data Animator (Thompson et al. 2021) and Gemini 2 (Kim and Heer 2021), with mental load cost based on Graph Scape (Kim et al. 2017), help to design animated transitions. However, these mental load costs were determined for normal-sized visualizations and might differ for other visualization sizes, as previous studies have shown (Bezerianos and Isenberg 2012; Blascheck and Isenberg 2021). It thus remains to adapt the mental load cost graph to small-scale visualizations. Additionally, finding a good animation duration requires more investigation.
Further, steps toward the direction of small-scale equivalents to interactive visualizations and visual analytics systems need to be explored. In our scenario, there is no interaction possibility with the visualizations themselves. Goffin et al. (2020) describe a design space of interactions with word-scale visualizations, but focus on manipulation of the whole visualization, not its data. Whereas showing data attribute values on mouseover on a mark is the simplest interaction, it is worth investigating how typical interaction with data in normal-sized visualizations translates to small-scale visualizations and how interaction on one of the small-scale visualizations can be persisted through to the visualizations not visible at that time.
References
Auto MPG (1993) UCI Machine Learning Repository. https://archive.ics.uci.edu/ml/datasets/Auto%2BMPG
Archambault D, Purchase H, Pinaud B (2011) Animation, small multiples, and the effect of mental map preservation in dynamic graphs. IEEE Trans Vis Comput Graph 17(4):539–552. https://doi.org/10.1109/TVCG.2010.78
Beck F, Blascheck T, Ertl T, Weiskopf D (2015) Word-Sized Eye-Tracking Visualizations. In: Workshop on Eye Tracking and Visualization, ETVIS ’15, pp. 113–128. Springer International Publishing. https://doi.org/10.1007/978-3-319-47024-5_7
Beck F, Weiskopf D (2017) Word-sized graphics for scientific texts. IEEE Trans Visual Comput Graph 23(6):1576–1587. https://doi.org/10.1109/TVCG.2017.2674958
Berger A, Kiefer M (2021) Comparison of different response time outlier exclusion methods: a simulation study. Front Psychol. https://doi.org/10.3389/fpsyg.2021.675558
Besançon L, Dragicevic P (2017) The Significant Difference between p-values and confidence intervals. In: In Proceedings of the Conference on l’Interaction Homme-Machine, pp. 53–62. https://doi.org/10.5220/0010328501330143
Besançon L, Dragicevic P (2019) The continued prevalence of dichotomous inferences at chi. In: Extended Abstracts of the 2019 CHI Conference on Human Factors in Computing Systems, pp. 1–11. https://doi.org/10.1145/3290607.3310432
Bezerianos A, Isenberg P (2012) Perception of visual variables on tiled wall-sized displays for information visualization applications. IEEE Trans Visual Comput Graph 18(12):2516–2525. https://doi.org/10.1109/TVCG.2012.251
Blascheck T, Isenberg P (2021) A Replication Study on Glanceable Visualizations: Comparing Different Stimulus Sizes on a Laptop Computer. In: IVAPP 2021-12th International Conference on Computer Vision, Imaging and Computer Graphics Theory and Applications, pp. 133–143. SCITEPRESS - Science and Technology Publications. https://doi.org/10.5220/0010328501330143
Borgo R, Micallef L, Bach B, McGee F, Lee B (2018) Information visualization evaluation using crowdsourcing. Comput Graph Forum 37(3):573–595. https://doi.org/10.1111/cgf.13444
Bosch H, Thom D, Heimerl F, Püttmann E, Koch S, Krüger R, Wörner M, Ertl T (2013) ScatterBlogs2: real-time monitoring of microblog messages through user-guided filtering. IEEE Trans Visual Comput Graph 19(12):2022–2031. https://doi.org/10.1109/TVCG.2013.186
Bostock M (2012) D3.js - data-driven documents. http://d3js.org/
Brehmer M, Lee B, Isenberg P, Choe EK (2020) A comparative evaluation of animation and small multiples for trend visualization on mobile phones. IEEE Trans Visual Comput Graph 26(1):364–374. https://doi.org/10.1109/TVCG.2019.2934397
Chalbi A, Ritchie J, Park D, Choi J, Roussel N, Elmqvist N, Chevalier F (2020) Common fate for animated transitions in visualization. IEEE Trans Vis Comput Graph 26(1):386–396. https://doi.org/10.1109/TVCG.2019.2934288
Chittaro L (2006) Visualizing information on mobile devices. Computer 39(3):40–45. https://doi.org/10.1109/MC.2006.109
Cockburn A, Dragicevic P, Besançon L, Gutwin C (2020) Threats of a replication crisis in empirical computer science. Commun ACM 63(8):70–79. https://doi.org/10.1145/3360311
Cumming G (2013) Understanding the new statistics: Effect sizes, confidence intervals, and meta-analysis. Routledge
Dragicevic P (2016) Fair statistical communication in hci. Modern statistical methods for HCI pp. 291–330
Elmqvist N, Dragicevic P, Fekete JD (2008) Rolling the dice: multidimensional visual exploration using scatterplot matrix navigation. IEEE Trans Vis Comput Graph 14(6):1539–1548. https://doi.org/10.1109/TVCG.2008.153
Goffin P, Isenberg P, Blascheck T, Willett W (2020) Interaction Techniques for Visual Exploration Using Embedded Word-Scale Visualizations. In: Proceedings of the 2020 CHI Conference on Human Factors in Computing Systems, CHI ’20, pp. 1–13. Association for Computing Machinery. https://doi.org/10.1145/3313831.3376842
Heer J, Robertson G (2007) Animated Transitions in Statistical Data Graphics. IEEE Trans Vis Comput Graph 13(6):1240–1247. https://doi.org/10.1109/TVCG.2007.70539
Higgins JJ (2004) An introduction to modern nonparametric statistics. Brooks/Cole Pacific Grove, CA
Hoffswell J, Li W, Liu Z (2020) Techniques for Flexible Responsive Visualization Design. In: Proceedings of the 2020 CHI Conference on Human Factors in Computing Systems, CHI ’20, pp. 1–13. Association for Computing Machinery. https://doi.org/10.1145/3313831.3376777
Hoffswell J, Satyanarayan A, Heer J (2018) Augmenting Code with In Situ Visualizations to Aid Program Understanding. In: Proceedings of the 2018 CHI Conference on Human Factors in Computing Systems, CHI ’18, pp. 1–12. Association for Computing Machinery. https://doi.org/10.1145/3173574.3174106
Horak T, Aigner W, Brehmer M, Joshi A, Tominski C (2021) Responsive Visualization Design for Mobile Devices. In: Mobile Data Visualization, 1 edn., pp. 33–66. Chapman and Hall/CRC. https://doi.org/10.1201/9781003090823-2
Huth F, Blascheck T, Koch S, Ertl T (2022) Animated transitions for small-scale visualizations. In: Proceedings of the 15th International Symposium on Visual Information Communication and Interaction, VINCI ’22. Association for Computing Machinery, New York, NY, USA. https://doi.org/10.1145/3554944.3554945
Huth F, Blascheck T, Koch S, Utz S, Ertl T (2021) Word-sized Visualizations for Exploring Discussion Diversity in Social Media. In: IVAPP 2021-12th International Conference on Computer Vision, Imaging and Computer Graphics Theory and Applications, pp. 256–265. SCITEPRESS - Science and Technology Publications. https://doi.org/10.5220/0010328602560265
Jakobsen MR, Hornbæk K (2013) Interactive visualizations on large and small displays: the interrelation of display size, information space, and scale. IEEE Trans Vis Comput Graph 19(12):2336–2345. https://doi.org/10.1109/TVCG.2013.170
Kim H, Moritz D, Hullman J (2021) Design patterns and trade-offs in responsive visualization for communication. Comput Graph Forum 40(3):459–470. https://doi.org/10.1111/cgf.14321
Kim H, Rossi R, Sarma A, Moritz D, Hullman J (2021) An automated approach to reasoning about task-oriented insights in responsive visualization. IEEE Trans Vis Comput Graph 28(1):129–139. https://doi.org/10.1109/TVCG.2021.3114782
Kim Y, Correll M, Heer J (2019) Designing animated transitions to convey aggregate operations. Comput Graph Forum 38(3):541–551. https://doi.org/10.1111/cgf.13709
Kim Y, Heer J (2021) Gemini: a grammar and recommender system for animated transitions in statistical graphics. IEEE Trans Vis Comput Graph 27(2):485–494. https://doi.org/10.1109/TVCG.2020.3030360
Kim Y, Heer J (2021) Gemini2: Generating Keyframe-Oriented Animated Transitions Between Statistical Graphics. In: 2021 IEEE Visualization Conference (VIS), pp. 201–205. https://doi.org/10.1109/VIS49827.2021.9623291
Kim Y, Wongsuphasawat K, Hullman J, Heer J (2017) GraphScape: A Model for Automated Reasoning about Visualization Similarity and Sequencing. In: Proceedings of the 2017 CHI Conference on Human Factors in Computing Systems, CHI ’17, pp. 2628–2638. Association for Computing Machinery. https://doi.org/10.1145/3025453.3025866
Krzywinski M, Altman N (2013) Error bars: the meaning of error bars is often misinterpreted, as is the statistical significance of their overlap. Nat Methods 10(10):921–923. https://doi.org/10.1038/nmeth.2659
Latif S, Beck F (2018) Visually augmenting documents with data. Comput Sci Eng 20(6):96–103. https://doi.org/10.1109/MCSE.2018.2875316
Liu Z, Thompson J, Wilson A, Dontcheva M, Delorey J, Grigg S, Kerr B, Stasko J (2018) Data illustrator: Augmenting vector design tools with lazy data binding for expressive visualization authoring. In: Proceedings of the 2018 CHI Conference on Human Factors in Computing Systems, CHI ’18, p. 1–13. Association for Computing Machinery, New York, NY, USA. https://doi.org/10.1145/3173574.3173697
Munzner T (2014) Visualization analysis and design. CRC Press
Neshati A, Sakamoto Y, Irani P (2019) Challenges in Displaying Health Data on Small Smartwatch Screens. In: Studies in Health Technology and Informatics, ITCH ’19, vol. 257, pp. 325–332. https://doi.org/10.3233/978-1-61499-951-5-325
OSF—animated transitions in small-scale visualizations (2022). https://osf.io/ab4u5
Peña-Araya V, Bezerianos A, Pietriga E (2020) A Comparison of Geographical Propagation Visualizations. In: Proceedings of the 2020 CHI Conference on Human Factors in Computing Systems, CHI ’20, pp. 1–14. Association for Computing Machinery. https://doi.org/10.1145/3313831.3376350
\(\copyright\) 2022 Prolific (2022). https://www.prolific.co/
Qu Z, Hullman J (2018) Keeping multiple views consistent: constraints, validations, and exceptions in visualization authoring. IEEE Trans Vis Comput Graph 24(1):468–477. https://doi.org/10.1109/TVCG.2017.2744198
Robertson G, Cameron K, Czerwinski M, Robbins D (2002) Animated visualization of multiple intersecting hierarchies. Inf Vis 1(1):50–65. https://doi.org/10.1057/palgrave.ivs.9500002
Schumann H, Tominski C (2011) Analytical, visual and interactive concepts for geo-visual analytics. J Vis Lang Comput 22(4):257–267. https://doi.org/10.1016/j.jvlc.2011.03.002
Shi D, Shi Y, Xu X, Chen N, Fu S, Wu H, Cao N (2019) Task-Oriented Optimal Sequencing of Visualization Charts. In: 2019 IEEE Visualization in Data Science (VDS), pp. 58–66. https://doi.org/10.1109/VDS48975.2019.8973383
Thompson JR, Liu Z, Stasko J (2021) Data Animator: Authoring Expressive Animated Data Graphics. In: Proceedings of the 2021 CHI Conference on Human Factors in Computing Systems, pp. 1–18. Association for Computing Machinery. https://doi.org/10.1145/3411764.3445747
Tufte ER (2006) Beautiful Evidence, 1st edn. Graphics Press
Wang B, Mueller K (2018) The subspace voyager: exploring high-dimensional data along a continuum of salient 3D subspaces. IEEE Trans Vis Comput Graph 24(2):1204–1222. https://doi.org/10.1109/TVCG.2017.2672987
Acknowledgements
We thank all study participants. This research was funded by the Deutsche Forschungsgemeinschaft (DFG, German Research Foundation) – 314647693 – as part of the Priority Program VA4VGI (SPP 1894) and Grant DFG ER 272–14. It was also partially funded by the University of Stuttgart as part of the project Context Changes In Social Media Contributions. Tanja Blascheck is funded by the European Social Fund and the Ministry of Science, Research and Arts Baden-Württemberg.
Funding
Open Access funding enabled and organized by Projekt DEAL. This author funded by Ministerium für Wissenschaft, Forschung und Kunst Baden-Württemberg (DFG ER 272-14-1).
Author information
Authors and Affiliations
Corresponding author
Additional information
Publisher's Note
Springer Nature remains neutral with regard to jurisdictional claims in published maps and institutional affiliations.
Rights and permissions
Open Access This article is licensed under a Creative Commons Attribution 4.0 International License, which permits use, sharing, adaptation, distribution and reproduction in any medium or format, as long as you give appropriate credit to the original author(s) and the source, provide a link to the Creative Commons licence, and indicate if changes were made. The images or other third party material in this article are included in the article's Creative Commons licence, unless indicated otherwise in a credit line to the material. If material is not included in the article's Creative Commons licence and your intended use is not permitted by statutory regulation or exceeds the permitted use, you will need to obtain permission directly from the copyright holder. To view a copy of this licence, visit http://creativecommons.org/licenses/by/4.0/.
About this article

Cite this article
Huth, F., Blascheck, T., Koch, S. et al. Studies and design considerations for animated transitions between small-scale visualizations. J Vis 26, 1421–1443 (2023). https://doi.org/10.1007/s12650-023-00937-z
Received:
Revised:
Accepted:
Published:
Issue Date:
DOI: https://doi.org/10.1007/s12650-023-00937-z