
Abstract
The hydrological and physical characteristic description of a watershed constitutes an essential task for hydrologic research. Usually, this one requires a hydrologic model of which the running needs a great number of data and information. The main purpose of this study was to use Shuttle Radar Topography Mission (SRTM) data, free of charge, for hydrologic studies in Algeria. This work will also be a good assessment test of hydrologic geospatial tools HEC-GeoHMS integrated in the ESRI ArcView 3.2 GIS. It is to define the watershed of Macta and its sub-basins and to extract the hydrographical network and also other topographic and hydrologic parameters from the SRTM data. The data bank with the obtained results and the schematisation of the studied watershed (Macta watershed is in the western of Algeria) will be used as a foundation of a hydrologic model.
Introduction
We know that the physical and hydrological parameters can be taken from other sources such as topographic maps and satellite pictures, but the digital elevation model (DEM) has a lot of advantages. Nowadays, some sensors can establish the relief of an object. It gets several products as the DEM and it is derived, which are very important for the hydrologic applications (Bradley and Maidment 1999). With only altimeter information of the DEM, you can delineate the watershed and remove the hydrographical network. At the same time, a large number of hydrographical network and watershed characteristics can be defined. The integration of the other hydrologic data such as rainfall and curve number (CN) allows estimating others hydrologic parameters like the lag time, concentration time, etc. The automation of the extraction methods permits determining the hydrological and physical parameters very quickly, particularly when the watersheds are bigger and so the manual extraction is longer. In that case, some operator mistakes can appear (Chaponnière 2005). The increased development in the geographical information domain drives in several applications to the usage of the geographic information systems (GIS), powerful tools allowing the manipulation, storage, analysis and display of spatial referenced data. The GIS play a primary role as geographical information support, management tools of geographical and thematic data, also in modelling, calculation and communication abilities (Goodchild et al. 1996). Their role in hydrology is increasing. In addition to extracted data from GIS and introduced in simulation models, GIS are more developed for hydrologic modelling that integrates simulation models (Puech et al. 2004). Therefore, a digital elevation model of Shuttle Radar Topography Mission (SRTM) and a geospatial tool (Hydrologic Engineering Center Geospatial Hydrologic Modeling Extension, HEC-GeoHMS), extension of ArcView 3.2 of ESRI, have been used to delineate the sub-basins to extract the hydrographical network, to compute the physical characteristics and some hydrological parameters and to establish the watershed schematic appropriated with a hydrologic model.
Data and tools
SRTM data
The topography is one of the factors which influence spatial and temporal variability of the hydrologic process. It can be represented by a digital elevation model that can be used by a computer (Gamache 2005). From this, we can analyse territorial structural characters as the watershed limits and its characteristics, slope map, hydrographical network extraction, etc. The data used in this application are from the SRTM version 3 with a resolution about of 3 arcsec (90 m). The source of the data is free in all the selected research areas (Fig. 1). The 3-arcsec resolution is totally appropriated to our study. The SRTM data are available in Geotiff format and are given out by the US Geological Survey (Farr and Kobrick 2000). The Word Geodetic System 84 (WSG84) is used for the horizontal projection system; the vertical system is determined by the EGM 96 geoid (Earth Geopotential Model 96; Cemagref 2006).

SRTM data of the study area
To make use of the methodology, we have chosen the northwest of Algeria, between the north parallels 35°15′ and 35°57′, and the West Meridian 1°14′ and 0°40′ (Fig. 1). It is the hydrographic region of Oranie Chott Chergui. In this zone, we have the Macta watershed which covers an area of 14,235 km2 and three other watersheds named Oranese Coastal, Tafna and Chott Chergui. The limits and the hydrographical network of Macta watershed, determined from the 1/200,000 topographical plans, are available. So we can compare the obtained results.
Geospatial tools HEC-Geo HMS
HEC-Geo HMS is a geospatial hydrologic modelling extension of the ArcView 3.2 GIS. It uses Spatial Analyst extension (ESRI 1996) to develop a number of input entry data for a possible hydrologic modelling. Through analysis of the terrain digital information, it converts the drainage flows and the watershed boundaries into a hydrologic data structure. HEC-Geo HMS contributes to the valuation of the hydrologic parameters given in tabular form, extracted from the physical characteristics of watercourses and sub-basins (HEC 2003). Moreover, it allows visualising the spatial information (watershed characteristics), delineating sub-basins, extracting the hydrographical network and developing a basin schematic and a background map file (Fig. 2). The DEM of the watershed is the most important data, for this extension, which come from the GIS. Figure 2 shows the connection between the ArcView GIS, the HEC-GeoHMS module and the hydrologic model. The GIS ensures their geographic and topographic map digitisation and their treatment to obtain a spatial hydrologic database compound of DEM, soil type, crop cover, etc.

Relations between different tools
The HEC-GeoHMS software makes the processing of the DEM via the ArcView to achieve the schematisation in sub-basins of the watershed. The link between GIS functionalities and hydrologic model is made by the HEC-GeoHMS extension (HEC 2003). In this way, it translates the spatial information of the GIS into hydrologic information (Fig. 2).
Applications and results
Data processing is achieved in two main steps:
- 1.
Preprocessing allows correcting the DEM, defining sub-basins and extracting the hydrographical network.
- 2.
Physical and hydrological parameter extraction is necessary to hydrologic modelling.
DEM preprocessing
The different steps of DEM preprocessing are presented in Fig. 3. ArcView 3.2 GIS, the Spatial Analyst extension and the geospatial tool HEC-GeoHMS are used.

DEM preprocessing steps
DEM of the study area should be used in ESRI’s grid format. The following step consists of the process DEM with the HEC-GeoHMS:
DEM correction
“Terrain reconditioning” method has been used. Here, the hydrographical network, considered as a break-line and previously digitised or obtained by other methods, is superimposed to the DEM. This method allows the user to do lower cell stream elevation and also provides an option to gradually lower the neighbouring cells along the stream. This method creates a regular transition from the overbank to the stream centerline in the DEM to make water enter the stream (HEC 2003). Thus, the flow will be forced at the moment of the network extraction and will appear in better adequacy with the terrain reality. Then, depressions and pits are filled by increasing the elevation of the pit cells to a level of the surrounding terrain in order to determine flow directions. These depressions are owed to several mistakes committed at the DEM construction, especially at interpolation. This effect can prevent the water outflow and can distort the hydrographical network (Charleux-Demargne 2001).
Flow direction
Flow directions are determined using the D8 algorithm. This one takes into account the eight neighbouring cells of the considered point and computes the maximal difference between the central cell and its eight neighbours. Consequently, the flow direction of every cell will be defined according to the direction of the strongest determined slope. The flow directions obtained are represented in Fig. 4a.

Flow direction and accumulation
Flow accumulation
With the matrix used for determining flow direction, it is possible to compute its flow accumulations. Upstream cells drain to a given cell. Drainage area at a given cell is computed by multiplying the flow accumulation value by the cell area (Fig. 4b).
Stream definition and segmentation
To determine where the flow of the water is going, the present method uses a defined threshold. Cells with high flow accumulation, greater than a predefined threshold value, are considered part of a stream network.
After several iterations, we chose a threshold of 630 km2 for the following reasons:
The sub-basin number must be appropriate to simplify their corrections (subdivision and merge).
Upstream sub-basin aggregation should be made easily to delineate the Macta watershed.
Streams are then subdivided into segments. These stream segments join two successive junctions or a junction and an outlet.
Sub-basin delineation
Here, sub-basins or watersheds are delineated for every stream segment. From direction flow and stream segments GRID, the topographic watersheds are delineated since only elevation is used. Sub-basins and stream segments obtained into GRID format can be transformed into a vector representation (Fig. 5).

Vector representation of sub-basin and stream segments
Sub-basin aggregation
Sub-basins are aggregated in every stream confluence. This stage allows drawing interactively sub-basins and saving the obtained data (Fig. 6).

Sub-basin aggregation
Extraction of hydrologic model required information
Once the terrain preprocessing is over, we can do the information extraction required from the already obtained database.
Main elements of watershed
Sub-basins, reaches and junctions constitute the main elements of the watershed. To establish these elements, it is necessary first to choose the outlet of Macta watershed (Fig. 7). We should note here the role of the topographic map that gave us an idea of where the Macta watershed is from and the place its outlet is situated. The used method called, “original stream definition”, allowed creating our study area. A new project is formed taking into consideration only the study zone (Macta watershed). The new results required for the following steps of the project are related to the study zone only (Fig. 7).

Sub-bassins merge
HEC-GeoHMS gives the possibility to update sub-basins and streams. It allows merging or subdividing them. Using the “basin subdivision on existing stream” method and taking into account the data already published by the National Agency of Hydraulic Resources (ANRH), it is possible to define the cross point of published watershed and the existing streams and therefore to create new sub-basins.
Once sub-basins are corrected, we can compare between the results obtained in this work and data already published by ANRH. It concerns the polygons and the hydrographical network of sub-basins (Fig. 8).

Comparison between project results and published data
Physical characteristics of Macta watershed
Stream and sub-basin physical characteristics which are determined by HEC-GeoHMS and saved in attributed tabular allow estimating the main parameters required to hydrologic models, mentioned in the following Table 1.
The main obtained values are presented in Tables 2 and 3.
Hydrological parameters of Macta watershed
From streams and sub-basin physical characteristics, HEC-GeoHMS allows estimating some hydrologic parameters. It will be used with hydrologic modelling. Among these parameters are:
Sub-basin CN: This parameter is used to estimate the surface flow based on the soil type and the land use (Mendas et al. 2008).
Concentration time: estimated by the TR55 method (technical release) of the Natural Resources Conservation Service (NRCS).
Sub-basin lag time: estimated in two stages; the first one consists in computing a slopes grid of the watershed (Fig. 9), and the second one consists in estimating the lag time by the curve number method of the NRCS.
Fig. 9 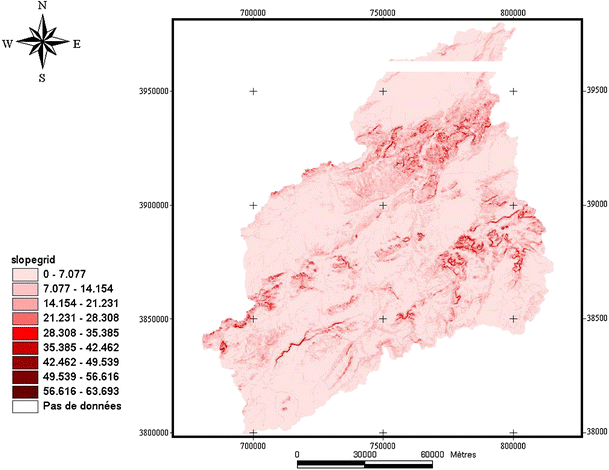
Macta watershed slopes

Main obtained hydrological parameters are illustrated in Table 4.
Macta watershed schematic
As soon as sub-basins and extracted basic topographic characteristics are delineated, the watershed schematic can be built for a possible hydrologic model use. Here, sub-basins are represented by points, whereas streams are represented by linear segments linking these points. The connectivity between points and links are established by a hydrological network elements built from upstream to downstream. Hydrologic element connectivity and related geographic information are captured in an ASCII text file that can be read by hydrologic model as basic data (Puech et al. 2004). Figure 10 shows the HMS Macta watershed schematic. It is the representation of hydrologic model of the watershed and its elements (reaches, junctions, etc.) and their connectivity.

Hydrologic elements of sub-basins and streams
Conclusion
Macta watershed and its sub-basins have been automatically delineated, the hydrographical network has been extracted, and some physical characteristics and hydrologic parameters have been estimated. All these data are saved in a databank useful for a hydrologic modelling. The time gain was of a great importance since a manual extraction is long and can be submitted to mistakes. The results of the physical elements, particularly the sub-basins and the hydrographical network, determined in this survey can be considered satisfactory. Previously delimited sub-basins were not exactly the same as those already published, but thanks to the functions by HEC-GeoHMS tools, the update is efficient, very flexible and in very fast manners. Results sharpness depends on the resolution and the quality of the used DEM and of the threshold predefined during data processing. However, the SRTM data with a resolution of 90 m can be considered as reliable for big watershed hydrologic studies. As for estimated hydrologic parameters, they can be valorised after the hydrologic model execution. It is therefore important to note that the obtained results are not definitive but remain experimental. The watershed is schematised in a manner to be used by a hydrologic model that, once the necessary data are available, can do hydrologic simulations. HEC-GeoHMS offered us the better possibility to exploit the geographical information stored in the GIS.
References
Bradley TH, Maidment DR (1999) Geospatial data in water availability modeling. Center for Researche Water Resources. Bureau of Engineering Research. The University of Texas at Austin J.J. Pickle Research Campus. Austin, TX 78712-4497, p 276
Cemagref (2006) Construction d’une base informatique géographique à vocation hydrologique. Cahier des charges, Cemagref—groupement d’Aix en Provence (Construction of a geographical database for hydrologic vocation. Load notebook, Cemagref—Aix en Provence group)
Charleux-Demargne J (2001) Qualité des Modèles Numériques de Terrain pour l’Hydrologie. Application à la Caractérisation du Régime de Crues des Bassins Versants. Université de Marne la Vallée [Quality of digital elevation models for hydrology. Application to the watershed flood characterization. University of Marne la Vallee]
Chaponnière A (2005) Fonctionnement hydrologique d’un bassin versant montagneux semi-aride, cas du bassin versant du Rehraya (Haut Atlas marocain). L’Institut National Agronomique Paris-Grignon [Hydrologic functioning of a semi-arid mountainous watershed, case of Rehraya watershed (Moroccan High Atlas)]. National Agronomic Institute Paris, Grignon
ESRI (1996) ArcView spatial analyst, advanced spatial analysis using raster and vector data, GIS by ESRI, using ArcView. Environmental Systems Research Institute, p 147
Farr TG, Kobrick M (2000) Shuttle radar topography mission produces a wealth of data. Am Geophys Union Eos 81:583–585
Gamache M (2005) Free and low cost datasets for international mountain cartography. Alpine Mapping Guild. Consulted online in January 2006 on http://www.terrainmap.com/downloads/Gamache_final_web.pdf
Goodchild MF, Kemp KK, Theriault M, Roche Y (1996) Systèmes d’information géographique, Notes de cours Volume1, Notions de base, LATIG, Département de géographie, Université Laval, Québec [Geographical Information Systems, Support for course, Volume 1, Basis notions, LATIG]. Department of Geography, University Laval, Quebec
HEC (2003) Hydrologic Engineering Center Geospatial Hydrologic Modeling Extension (HEC-GeoHMS). User’s manual. US Army Corps of Engineers Hydrologic Engineering Center, 609 Second Street Davis, CA 95616, p 267
Mendas A, Errih M, Bouchenak F (2008) Hydrologic model combined to a GIS for estimating hydrologic balance at watershed scale—application to the Macta watershed (North-Western Algeria). J Water Supply: Res Technol (AQUA), vol 57. ISSN 0003–7214
Puech C, Raclot D, Bailly JS (2004) Expertise sur l’utilisation des données spatiales dans le domaine de l’hydrologie, Cemagref—France [Appraisal on spatial data use in the hydrology domain, Cemagref—France]
Open Access
This article is distributed under the terms of the Creative Commons Attribution Noncommercial License which permits any noncommercial use, distribution, and reproduction in any medium, provided the original author(s) and source are credited.
Author information
Authors and Affiliations
Corresponding author
Additional information
An erratum to this article can be found at http://dx.doi.org/10.1007/s12518-010-0019-8
Rights and permissions
Open Access This is an open access article distributed under the terms of the Creative Commons Attribution Noncommercial License (https://creativecommons.org/licenses/by-nc/2.0), which permits any noncommercial use, distribution, and reproduction in any medium, provided the original author(s) and source are credited.
About this article
Cite this article
Mendas, A. The contribution of the digital elevation models and geographic information systems in a watershed hydrologic research. Appl Geomat 2, 33–42 (2010). https://doi.org/10.1007/s12518-010-0017-x
Received:
Accepted:
Published:
Issue Date:
DOI: https://doi.org/10.1007/s12518-010-0017-x