
Abstract
Following three generations of buyback contracts, the new model of Iranian petroleum contracts (IPC) was introduced by the Iranian cabinet to incentivize investments in the country. This paper analyzes the fiscal terms of the contract with technical information from one of the candidate fields for licensing. The financial simulation shows that, in general, the IPC resembles more a service contract than a production sharing contract as the contractor’s take is relatively low—below 5% across different scenarios of crude oil price. Second, the IPC is progressive in that as the overall profitability of the project improves the government takes an increasing share of the economic rent. The results are confirmed in a sensitivity analysis of each party’s profitability and takes on oil price, CAPEX, OPEX and the fee.
1 Introduction
Iran has the one of the largest oil reserves in the world.Footnote 1 Traditionally, Iran has relied on buyback contracts for awarding upstream petroleum licenses to international oil companies. A buyback contract is essentially a service contract under which a foreign company develops an oil or gas deposit and recovers its costs and a pre-negotiated remuneration fee from sales revenues, but has no share in the project’s profit. Once the field starts production, the investment is handed over to National Iranian Oil Company (NIOC) who will take over the operation of the fieldFootnote 2 (van Groenendaal and Mazraati 2006). It was first adopted by the Iranian government in 1993. For more than 20 years, the buyback contract was the main apparatus of petroleum licensing in Iran.
Technically speaking, a buyback contract is a type of risk service contract in that all costs are born by the foreign company who can only recover its costs and the agreed remuneration if the field produces at its agreed level and the price is high enough. In other words, the foreign company’s cost recovery and remuneration depends on the field’s performance. The terms of the buyback contract had been revised three times by the national oil company resulting in three generations of buyback contracts (Maddahinasab 2017). Despite these alterations, Iran was not very successful in raising the required investment for its petroleum industry. An oft-voiced critique from international oil and gas companies is that the period of the contractor’s involvement in the field is so short, usually between 5 and 7 years, that Iran’s oil and gas recovery will not be optimized, as the contractor is not incentivized to maximize the long-term recovery.Footnote 3
In order to attract foreign investment to the oil and gas sector, in 2017 the Iranian government introduced a new generation of upstream oil and gas contracts called Iranian petroleum contract (IPC) with more rewarding conditions to foreign investors. In this new framework, the Iranian authorities sought to rectify the deficiencies of the buyback contract. For example, the term of the contract is extended to a maximum of 20 years from the start of development. If enhanced oil recovery projects are to be implemented, the term can extend up to another 5 years and if exploration is included in the contract, then that period will be added to the contract.Footnote 4 The remuneration fee within the IPC framework is based on production rate and set as a fee per barrel of oil or per cubic foot of gas. In contrast, the fee was paid as a percentage of total capital costs under the buyback contract, which could lead to the so-called gold plating.Footnote 5 Elements of progressivity such as an R-factor are also included in the IPC remuneration scheme.
What are the implications of the new IPC framework to investors? Is the fiscal regime under the IPC framework progressive or regressive? To what extent the IPC resembles the traditional buyback contract or the more prevalent production sharing agreement? These questions are the focus of this paper.
Since the Iranian government revealed its plans of setting up a new contract in 2015, a number of papers have analyzed the contract terms, mostly from a legal and contractual perspective, focusing on such issues as the similarities and differences between the IPC, the buyback and production sharing contracts; risk sharing mechanisms, and the progressivity of the IPC. See, for example, Shahri (2015), Ebrahimi and Shahmoradi (2017), Maddahinasab (2017) and Asgharian (2017). Very few papers have focused on the financial implications of the IPC to the investor and the host government with the exception of Soleimani and Tavakolian (2017) and Sahebhonar et al. (2016).Footnote 6 Soleimani and Tavakolian (2017) compare the efficiency of the buyback contract to that of IPC using a number of financial metrics including the government take, the net present value (NPV), the internal rate of return (IRR), discounted payback period and the present value ratio. Although the paper ran several scenarios, it does not give a clear explanation of many of the underlying assumptions such as the capital expenditure, the operating expenditure. It is also unclear why the NPV and IRR of the contractor (in all cases of small, medium and large field) remain almost unaffected when the price scenarios change. Sahebhonar et al. (2016) deal with the financial aspects of the IPC using an Iranian offshore field in the Caspian Sea region, however, since it focuses on a specific type of fields (deep offshore), the generality of its results is limited.
This paper focuses on the financial implications of the IPC to the host government and investors. We calculate the “take” statistic, which shows the division of profits between the host government and the investor over the life cycle of the contract, and analyzes how it changes under different oil price scenarios. The analysis is illustrated using a financial model with technical information from the third phase development of a real oil field located in the South of Iran. The results demonstrate that, in general, the IPC is progressive that as the overall profitability of the project improves the government takes an increasing share of the economic rent. A sensitivity analysis of each party’s profitability and ‘takes’ on oil price, the base remuneration fee, the capital expenditure and the operating expenditure further corroborates this result.
The rest of the paper is organized as follows. After the introduction, Sect. 2 describes the fiscal arrangements of the IPC. Section 3 presents the model setup and assumptions for key parameters and scenarios. The results of financial modeling as well as a sensitivity analysis are reported in Sect. 4. Section 5 concludes.
2 The fiscal arrangement of IPC
In contrast to the buyback contract under which the investor does not play any role in the production phase, under the IPC the foreign company is allowed to participate in all phases of upstream activities including exploration, development and production. The investor recovers all its accrued costs from the proceeds of oil and gas from the field. In addition, it also benefits from the profit of the field via a per barrel remuneration fee. Figure 1 illustrates the division of the total revenue between the investor and the government. The details of each cost item and the remuneration fee are discussed below.
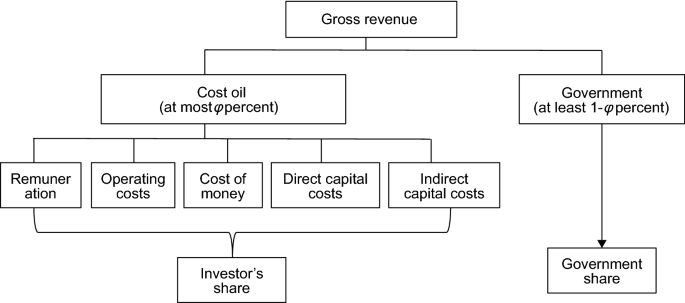
IPC fiscal structure
2.1 The cost categories of IPC
-
Direct capital costs: these include field development and appraisal costs needed for achieving the development goals, which are further divided into two categories.
-
Direct capital costs for achieving primary production goals: the costs that are evaluated before the contract is signed. These costs are stipulated in the contract, not changeable and will be totally recovered.
-
Direct capital costs for reaching next phase of targets: the costs that are required to achieve the next phase of targets are approved based on predictions, primary production, reservoir behavior and field development project. Submission of an annual work program and budget that is approved by the joint development committee (JDC) and NIOC is a condition for paying this portion of the capital cost. Deviation from the work program should not be more than 5%. The recovery of these costs is neither guaranteed nor fixed in the contract and depends on the reservoir behavior and market conditions and can be adjusted annually.
-
-
Indirect capital costs: include all costs paid by the foreign company to government agencies such as customs, pensions and national insurance costs, etc. These costs are also recoverable, but are limited to those paid within the country borders.
-
Cost of money: These are the financial costs, including interest payment relating to indirect costs or delay in cost recovery. The base interest rate for these costs is LIBOR plus an agreed premium.Footnote 7
-
Operating costs (OPEX): These include all costs and expenses incurred and paid by the contractor relating to the operation and maintenance of the field such as labor, consumables and energy.
All costs paid by the contractor will be recovered from field’s proceeds in the form of “cost petroleum.” According to Iranian Cabinet Resolution (2016), the amount of petroleum for cost recovery and payment of the remuneration fee will be capped at a maximum of 50% of crude or condensate and up to 75% of gas produced or equivalent revenues based on market prices.Footnote 8 That is, no more than 50% of oil revenue (75% of gas revenue) from the field can be used to recover the investor’s costs. Unrecovered costs can be carried forward to next year(s).
Direct or indirect capital costs incurred prior to the commencement of primary production will be amortized within 5–7 years from the date when the agreed targeted rate of production is materialized. Capital costs incurred after the primary production will be recovered in 5–7 years from the time of investment.
2.2 Remuneration
The remuneration fee is the main mechanism through which the contractor can get a rate of return. Under a buyback contract, the contractor is paid a fixed fee—a fixed percentage of total capital expenditure as agreed in the contract (Maddahinasab 2017). Under the IPC, the per barrel remuneration fee depends on a number of factors including the location of the field, whether the contract covers the exploration phase, the oil price, and how much cost the investor has cumulatively recovered (R-factor). If a field is located offshore or cross the country border, the fee is higher so as to encourage investors to accelerate production. Unlike buyback contracts where the fee is paid within 5–7 years of production, the IPC entitles the contractor to receive the fee from the first or incremental production date until the termination of the contract, which is typically 15–20 years. Table 1 lists the key factors affecting the base fee.
The R-factor is defined as follows: \( {\text{R}} = \frac{{{Investors}\;{cumulative}\;{revenue} }}{{{Investors}\;{cumulative}\;{expenditures} }} \). As the R-factor increases, the rate of remuneration fee decreases. This relationship prevents the contractor from gaining a windfall profit and is a common practice in most oil contracts across the world. The specifics of the R-factor adjustment mechanism varies by contract. From the contract template, in Table 2 we present an example of the IPC R-factor adjustment with hypothetical percentage values which will be used for financial modeling. In this example, if the base fee is $5 per barrel, it will be adjusted to $4.5/bbl if the R-factor is between 1.0 and 2.0, and $4/bbl if the R-factor is greater than 2.0.
The remuneration fee is also indexed to international oil prices and regional gas prices, although not linearly. The fee is indexed to the average export oil price of Iran with the following formula:
where AF is the remuneration fee adjusted for the increase or decrease in the price of exported oil; F is the contractual base fee per barrel; Pt is the annual average price of exported oil in year t; and P0 is the export oil price at year zero assumed in the contract.Footnote 9 Hence, the relationship between the adjusted remuneration fee and oil price is S-shaped. When 0.5P0 < Pt< 1.5P0, the adjusted fee is linear in price. When Pt>1.5P0 or Pt < 0.5P0, Eq. (1a) and (1b) effectively put a price ceiling and a price floor on the adjusted fee. As a result, the remuneration fee is progressive in that when the price is high (higher than 150% of the base price), a growing share of the net revenue accrues to the government. Conversely, when the price is low (lower than 50% of the base price), the investor’s interest is protected.
The fee is adjusted for both the R-factor and the price of oil in a multiplicative manner. It will be first adjusted by the R-factor of the previous quarter, then adjusted by the oil price of the current quarter according to the formulae.
3 Model setup
To examine how the fiscal terms of the IPC affect the rent distribution between the host government and the investor, we develop a cash flow model using technical information from the third phase development of a real oilfield located in the South of Iran.Footnote 10 We first compute the net present values accrued to both the government and the investor. From the net present values, we then calculate the government and investor “takes.” The “take” statistics, which summarize the shares of profit (total revenue minus total costs) between the two parties, is widely used in the industry (Johnston 1994; Mu 2020). For the contractor, the “take” is simply the share of the contractor’s net profit in the total profit of the project. For the government, “take” represents the share of all taxes, levies and other government revenues from the project. When calculated over the life cycle of a project, the “takes” shall be calculated on a present value basis.
3.1 The production profile and cost parameters
The field is estimated to have 5 billion barrels of oil initially in place (OOIP) and has been continuously producing for 13 years. There are currently 27 producing wells, 2 descriptive wells and 4 gas injection wells. The current production capacity is 150 thousand barrels per day (MBPD). According to NIOC, the third phase of the development plan aims at adding 4 producing wells and 2 appraisal wells in order to boost the peak production capacity by 70 MBPD, reaching 220 MBPD.
Because the field is already in production and no exploration is needed, the length of the contract is set at 20 years instead of the maximum of 25 years that is allowed by the IPC. The first 3 years of the contract period is for field development (e.g., well drilling and completion), while the remaining 17 years is for production. According to the model contract, the capital cost will be reimbursed to the investor within 7 years from the time when the production rate reaches the target level. This is the fourth year of the contract in this context. The production profile is shown in Fig. 2. The base production rate is 150 MBPD and will reach 210 MBPD and 220 MBPD in the fourth and fifth year, respectively. Once the production rate reaches peak, it remains in plateau for 5 years. Afterward, it will deplete at a rate of 3% per year. The cumulative incremental production from the field is 274.8 million barrels according to the technical assumption of the field.
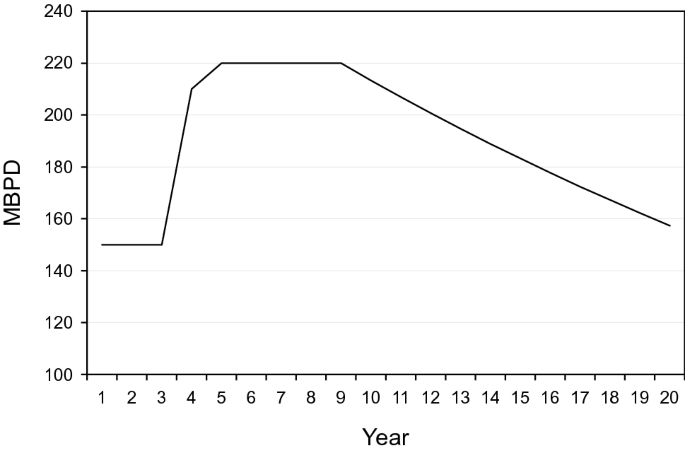
The production profile. Note: The figure shows the production profile of the sample field
Assumptions for the key economic parameters are summarized in Table 3. For simplicity, all cost figures are expressed in real dollar values. The marginal cost for adding capacity is assumed 15,700 dollars per barrel of production capacity per day, which is reasonable as some of the surface facilities (such as tanks, separators, etc.) are already in place. A $50 million per year of sustaining capital cost is considered for well and facility maintenance and working capital. The OPEX is assumed 6 dollars per barrel, and the cost of money is 6% per year. Indirect capital cost is assumed to be 25% of the total CAPEX. The discount rate is 10% per year, which is the prevalent discount rate usually accepted by international organizations (such as IMF) and international oil companies in their public models. As discussed earlier, the cost recovery cap is set at 50% of the annual proceeds for crude oil.
Based on assumptions about these cost parameters, the total undiscounted cost for this production enhancement project is about 4613 million dollars, which is equivalent to 16.8 dollars per barrel. Table 4 summarizes the cost structure.
3.2 Oil price and remuneration fee
To see how the “take” statistics change with the oil prices, we consider four scenarios of the oil price: a reference case, a high price scenario, a low price scenario and a flat price scenario. The reference case, the high price and the low price scenario all follow the price projections of the US Energy Information Administration (EIA). Figure 3 depicts EIA’s latest projections for Brent crude oil price in 2018 real dollars (EIA 2020). In the reference case scenario, the Brent oil price starts from $73.27/bbl in 2020 and gradually increases to $105.16/bbl in 2040. In contrast, it grows from $122.92/bbl in 2020 to $197.34/bbl in 2040 in the high price scenario and from $43.92/bbl to $47.75 in the low price scenario. In the flat price scenario, we assume the Brent price remains at $65/bbl throughout the contract period. To account for the lower quality of the crude from this field and the transportation cost, a $5/bbl deduction to the Iranian crude is applied in the reference case and in the flat price scenario. This deduction is adjusted to $7.5/bbl and $3/bbl in the high price and low price scenarios, respectively, to reflect changes in the price premium and transportation cost for different price scenarios.
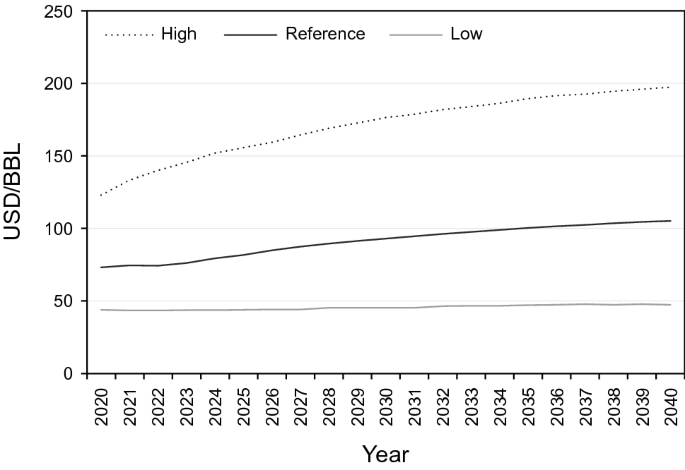
Crude oil price projection (2018 dollar). Note: The figure shows the assumptions of crude oil price used in “Annual Energy Outlook 2020” (EIA 2020)
As discussed in Sect. 2, the investor’s remuneration fee is determined and adjusted on the basis of oil price and R-factor. Based on our communications with senior officials of the NIOC, we consider a base remuneration fee of $5/bbl with a corresponding Iranian exported crude oil price of $60/bbl. With regards to the R-factor adjustment, the per barrel remuneration fee decreases as the R-factor increases. Figure 4 plots the R-factor along with the adjusted fee in the reference case. The adjusted fee drops between Year 8 and Year 9 because the R-factor reaches 1.0, and the fee is adjusted to 90% of the base fee.
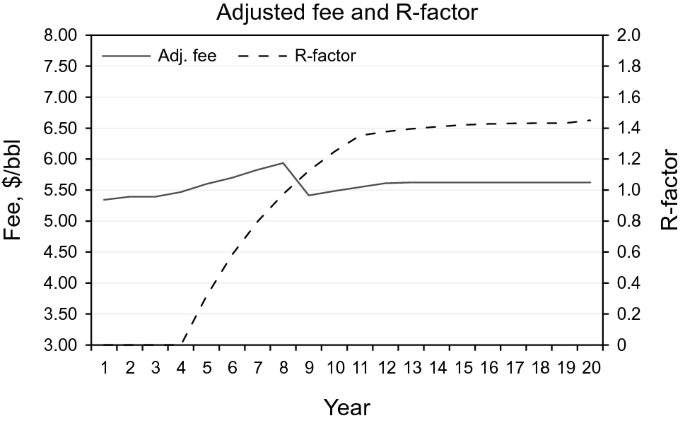
R-factor and adjusted remuneration fee
Given the above assumptions about oil prices, cost structure, and production profile, we compute the internal rate of return (IRR), net present value (NPV) both for the project as a whole and for the investor and government, respectively, under different price scenarios.
4 Results
4.1 Main results
Table 5 reports the main results of the simulations for all price scenarios. For each price scenario, we compute the IRR for the project as a whole and for the oil company, the NPVs, respectively, for the project, the oil company and the government. To examine the effect of discount rates on the net present values and takes, we compute both the undiscounted NPVs and the discounted NPVs assuming a 10% discount rate.
There are several important points worth noting. First, looking at the column of IRR, the project IRR is quite high and stands at 44% even in the low price scenario. This is consistent with the idea that a significant amount of rent existent in the upstream petroleum projects. The IRR for the contractor is also above its discount rate in all price scenarios, indicating good overall profitability for the contractor.
Second, comparing the second column of undiscounted values, the company takes (the shares of the company’s profit) is lower in the high oil price scenario than in the reference case and the low price scenario. And it is also lower in the reference case than in the low oil price scenario even though the absolute values of the company NPVs are higher in the higher oil price scenarios. This is to be expected since the remuneration fee is capped when the oil price is more than 150% of the base price, which is the case in the high price scenario, and the fee is also adjusted downwards as the R-factor increases above one. This pattern reflects the progressive nature of the fee mechanism.
Third, the third column shows the discounted NPVs and the corresponding government and company takes. Similar to Column 2, the absolute values of both the government and company NPVs are increasing as the oil price moves from low to high scenarios. However, although the company take in the high price scenario is lower than in the reference case, it is also lower in the low price scenario than in the reference case, which seems contradictory to the pattern shown in the second column. The puzzling result is due to the fact that in the low price scenario (in which the price is lower than the base price in all periods), the remuneration fee is adjusted downwards particularly in later periods when the R-factor is above 1.Footnote 11 When discounted, the lower fee results in a smaller share of company takes in the low price scenario.
Furthermore, in the flat price scenario where the Brent oil price is assumed to be fixed at $65/bbl throughout the contract period, the results such as the IRR and the parties’ takes lie between the reference case and the low price scenario, which is not surprising given that the assumed crude oil price ($65/bbl) lies between the two price scenarios.
Finally, across all price scenarios, the contractor’s takes are below 5% in all cases. The relatively low contractor’s take reveals that, from a financial perspective, the IPC resembles more a service contract than a profit sharing contract. A study by Tordo (2007) shows that the average final take of the contractors in service contracts in the world is around 2%–10%, while it is above 15% in PSCs. Figure 5 illustrates the share of each party’s net cash flow for the entire contract period for the reference case. If the primary goal of introducing the IPC is to attract more foreign investment into the Iranian oil and gas sector, the results indicate that the IPC is unlikely to be effective given the low share of company takes. Nonetheless, extension of the contract term would still be welcomed by the investors.
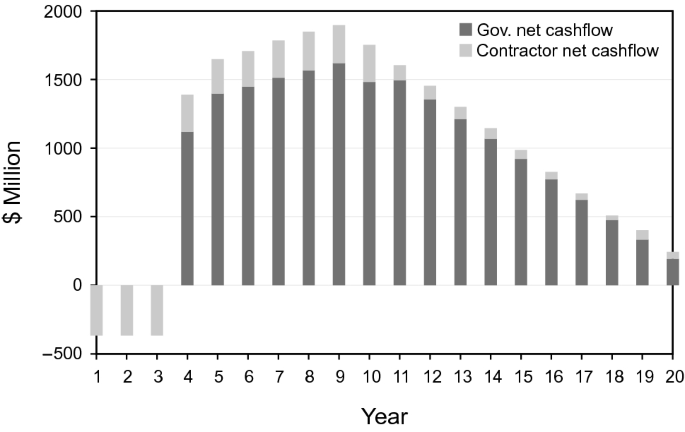
Government and company cash flow. Note: The figure depicts the shares of net cash flow of the host government and the contractor in the reference case scenario
4.2 Sensitivity analysis
Our last exercise is to examine the sensitivity of each party’s profitability and takes on changes in oil price, CAPEX, OPEX and the fee. To fix ideas, we use the flat price scenario as the base case for sensitivity analysis. Recall that in the flat price scenario the oil price is fixed at $65/bbl throughout the contract period. This helps us isolate the effect of price changes over time from changes in other factors. For each sensitivity case, we vary the parameters of interest, i.e., oil price, the fee, CAPEX and OPEX, from their base case by 50–200%, while holding other parameters constant from the base case.
-
Oil price
The sensitivity of each party’s net present values and ‘takes’ on changes in the benchmark oil prices is depicted in Fig. 6. As the benchmark oil price (Brent) varies from 50% to 200% of the base case ($65/bbl), both the government and the contractor’s NPVs increase. Because of the kinks built in the fee adjustment formula, the contractor’s NPV grows quickest when the oil price is below 60% of the base case and flattens when it is above 150% of the base case. In comparison, the government NPV is almost linearly increasing as oil price increases.
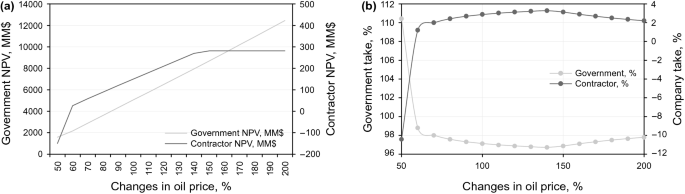
a The sensitivity of each party’s NPV to price changes. b The sensitivity of each party’s take to price changes. Note: The figure shows the sensitivity of each party’s take and NPV to the price of oil changing from 50% to 200% of the flat price scenario (where the oil price is held $65/bbl), assuming 10% discount rate. In each panel, the government NPV (take) is depicted on the left axis, whereas the contractor’s is on the right axis
Figure 6b shows the sensitivity of the ‘takes’ to changes in the oil price. If the benchmark oil price is 50% of the base case, i.e., $32.5/bbl, then the contractor has a negative NPV and therefore a negative ‘take.’ As the oil price increases, both the contractor and the government NPVs increase. Because the contractor’s remuneration fee is capped when the oil price is above 150% of the base year oil price and because the fee is adjusted to 0.9 from 1.0 as the R-factor crosses the 100% threshold, the share of company’s take declines when the oil price is higher than 150% of the base case crude oil price.
-
Base remuneration fee
When the base remuneration fee increases, the NPV of the contractor increases and that of the government decreases (Fig. 7a). Figure 7a also indicates that when the base remuneration fee falls below 80% of the assumed base fee of $5/bbl, the NPV of the contractor becomes negative. Similarly, as the base remuneration fee increases, the contractor’s take increases and that of government decreases (Fig. 7b). The remuneration fee is the main mechanism through which the contractor can obtain a share of profit. As the base remuneration fee changes, the contractor’s NPV and its share in the total project NPV change linearly in correspondence to the fee change.
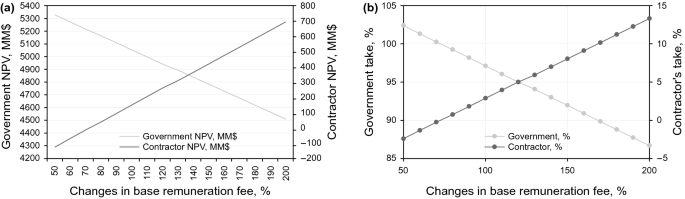
a The sensitivity of each party’s NPV to remuneration fee. b The sensitivity of each party’s take to remuneration fee. Note: The figure shows the sensitivity of each party’s take and NPV to changes in the base remuneration fee from 50% to 200% of the base case, assuming 10% discount rate. In each panel, the government NPV (take) is depicted on the left axis, whereas the contractor’s is on the right axis
-
CAPEX and OPEX
The sensitivity of both parties NPVs and takes to changes in the capital expenditure is depicted in Fig. 8. Not surprisingly, as the capital expenditure increases, holding other things constant, both the government and contractor’s NPVs decrease (Fig. 8a). The ‘takes’ depicted in Fig. 8b, on the other hand, show that as the capital expenditure increases (i.e., the total profitability of the project decreases) the government takes an increasing share of the discounted profit from the project while the contractor’s ‘take’ is declining. This is primarily due to the effect of discounting. Recall that the capital expenditure incurs in the development phase which is in the early years of the contract. The cash in-flow of the company (contractor) depends on the repayment of capital costFootnote 12 and the remuneration fee, both of which only occur in the production phase. As the benchmark oil price is fixed, the remuneration fee per barrel is largely fixed and the total remuneration accruing to the contractor changes with the production profile. Thus, if the CAPEX increases, it has a larger impact on the contractor’s net present value than on that of the government.
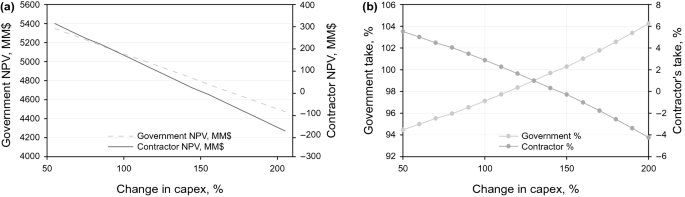
a The sensitivity of each party’s NPV to changes in CAPEX. b The sensitivity of each party’s take to changes in CAPEX. Note: The figure shows the sensitivity of each party’s take and NPV to changes in CAPEX from 50% to 200% of the base case where oil price is fixed at $65/bbl, assuming a10% discount rate. In each panel, the government NPV (take) is depicted on the left axis, whereas the contractor’s is on the right axis
Figure 9a, b depicted the sensitivity of the parties NPVs and takes to changes in the operating expenditure. The pattern is similar to the sensitivity of CAPEX exhibited in Fig. 8. As the OPEX increases, holding other things constant, both the government and the contractor’s NPVs decrease (Fig. 9a). Similar to an increase in CAPEX, an increase in OPEX leads to a declining share of the contractor’s take and increasing share of the government take due to the discount rate effect.
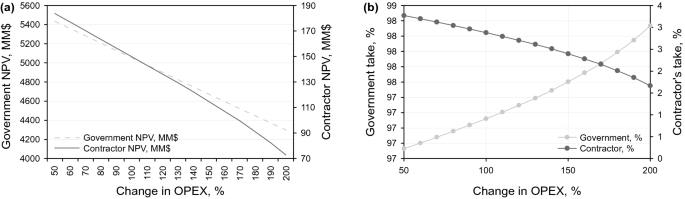
a The sensitivity of each party’s NPV to changes in OPEX. b The sensitivity of each party’s take to changes in OPEX. Note: The figure shows the sensitivity of each party’s take and NPV to changes in CAPEX from 50% to 200% of the base case where oil price is fixed at $65/bbl, assuming a 10% discount rate. In each panel, the government NPV (take) is depicted on the left axis whereas the contractor’s is on the right axis
In sum, the sensitivity analysis indicates, in general, as the profitability of the project improves, the government takes a larger share of the profit. Thus, the fiscal regime under the IPC is generally progressive rather than regressive.
5 Conclusion
This paper analyzes the fiscal regime under the new Iranian Petroleum Contract which evolves from the traditional buyback contract. There are both similarities and differences between the IPC and the buyback contract. Like buyback contracts, the contractor under the IPC regime recovers its direct and indirect capital cost, operating costs, banking costs and remuneration from the proceeds of the field. There are three differences between this contract and buyback. Firstly, there is no limit for CAPEX when the contract is signed. Secondly, the contractor’s remuneration is not fixed and depends on the production level and R-factor which is similar to Iraq’s service contracts. Thirdly, the term of the contract is extended to the production phase to incentivize the contractor for long-term behavior.
A financial model using technical information from the third phase development of an oil field located in the South of Iran is developed. There are two key results from this exercise. First, across all price scenarios, the contractor’s ‘take’ is relatively low—below 5%, indicating that the IPC resembles more a service contract than a production sharing contract. Second, in general the IPC is progressive in the sense that as the overall profitability of the project improves the government takes an increasing share of the economic rent. A sensitivity analysis of each party’s profitability and takes on oil price, CAPEX, OPEX and the fee corroborates the result.
Our analysis has profound policy implications for both the investors and the host government. First, although the IPC has introduced a number of changes to the contract term, CAPEX allowance and remuneration that could be welcomed by investors, the contractor’s take under the IPC is not much different from traditional service contracts and is unlikely to prove effective in attracting foreign investment. Second, since the remuneration fee is the main mechanism through which an investor can obtain a return, it is important that the investor negotiates a favorable remuneration fee. Third, our sensitivity analysis indicates that the government take is more sensitive to the fee, capital expenditure than the operating expenses. Thus, the hosting government must focus on the fee and the CAPEX rather than operating expenses in contract negotiations. On the other hand, if the government aims to improve the overall profitability the project hence the rent, they should also target capital expenditures instead of operating costs.
For future research, there are a number of avenues that this analysis can be extended. First, it would be useful to study the investor’s optimal behavior using a dynamic model where the investor’s investment and production decisions can be modeled as choice variables in response to the oil price, the remuneration fee and other contractual factors. Such a model could provide additional insight on how the contractual arrangements influence an investor’s behavior. Second, given the significant uncertainty in the oil price movement and other technical parameters such as the production rate, a stochastic simulation with the key variables would help quantify the range of possible outcomes and aid decision making for both the contractor and the hosting government under uncertainty.Footnote 13 Lastly, it would also be interesting to incorporate the technical aspects of the field into the financial modeling.Footnote 14 Since the contractual parameters (such as the fee and its sliding scale) vary with field technical difficulty, a model integrating the technical parameters of the field with contractual parameters could provide more accurate estimate of the contract implications.
Notes
According to BP Statistical Review of World Energy 2019, Iran’s proved oil reserve is ranked 4th in the world after Venezuela, Saudi Arabia and Canada. However, if we exclude Venezuela’s heavy oil from the Orinoco belt and Canadian oil sands, Iran is the second largest country in oil reserve, next only to Saudi Arabia.
Once the field reaches the targeted rate of production—which is agreed upon by the parties- and can keep for 21 days out of a period of 28 consecutive days, the foreign company will hand over the operation to NIOC.
In this paper, the word ‘investor,’ ‘contractor, and ‘foreign company’ will be used inter-changeably.
According to Clifford Chance (2017), the term of contract is up to 26 years, including 4 years for exploration, 2 years for appraisal and up to 20 years from the start of development operations. If necessary, it can be further extended by up to 7 years (2 years for the exploration phase and 5 years for enhanced oil recovery).
In taxation, “gold-plating” refers to the attempts by companies to inflate costs through overspending on projects.
LIBOR: London interbank offered rate which is a benchmark interest rate at which major global banks lend to one another in the international interbank market for short-term loans.
The base price is assumed $60/bbl.
- The name of the field is removed due to confidentiality limitations.
In the low price scenario, the adjusted fee ranges $3.76–3.86 per barrel from year 9.
Recall, the capital cost is amortized over a period of 7 years from the time when the daily production rate reaches a certain threshold.
See, for example, Park et al. (2009) in which a combination of technical factors, such as reservoir properties and well production rate and economic parameters, such as price, are analyzed in an integrated model to study the impact of uncertainties on petroleum developments.
References
Asgharian M. Developments of Iranian upstream contracts under the recently approved regulatory regime. Oil Gas Energy Law J (OGEL). 2017;15(3).
BP. Statistical review of world energy. 2019. https://www.bp.com/en/global/corporate/energy-economics/statistical-review-of-world-energy.html.
Ebrahimi SN, Shahmoradi E. A Comparative analysis of contractual considerations in oil and gas contracts with an emphasis on Iranian petroleum contracts. Oil Gas Energy Law J (OGEL). 2017;15(3).
Energy Information Administration (EIA). Annual energy outlook 2020, with projections to 2050; 2020.
Ghandi A, Lin Lawell CYC. An analysis of the economic efficiency of oil contracts: a dynamic model of the Rumaila oil field in Iraq. Working paper, University of California at Davis; 2017.
Ghandi A, Lin CYC. Do Iran’s buy-back service contracts lead to optimal production? The case of Soroosh and Nowrooz. Energy Policy. 2012;42:181–90. https://doi.org/10.1016/j.enpol.2011.11.070.
Hao H, Kaiser MJ. Modeling China’s offshore production sharing contracts using meta-analysis. Pet Sci. 2010;7(2):283–8.
Iranian Cabinet Resolution. The general principles, structure and the main framework for the Iranian upstream oil and gas contracts, H53367T/57225; 2016. https://doi.org/10.1007/s12182-010-0034-8.
Johnston D. International petroleum fiscal systems and production sharing contracts. PennWell Books; 1994.
Liu M, Wang Z, Zhao L, Pan Y, Xiao F. Production sharing contract: an analysis based on an oil price stochastic process. Pet Sci. 2012;9(3):408–15. https://doi.org/10.1007/s12182-012-0225-6.
Luo D, Zhao X. Modeling optimal oil production paths under risk service contracts. Pet Sci. 2013;10(4):596–602. https://doi.org/10.1007/s12182-013-0312-3.
Maddahinasab M. Fiscal analysis of new Iranian petroleum contract called IPC from a legal and contractual perspective. Oil Gas Energy Law J (OGEL). 2017;15(3).
Mu X. The economics of oil and gas. Newcastle upon Tyne: Agenda Publishing; 2020. p. I–Iv. https://doi.org/10.2307/j.ctvthhc9p.1.
Park C, Kang JM, Ahn T. A stochastic approach for integrating market and technical uncertainties in economic evaluations of petroleum development. Pet Sci. 2009;6(3):319–26. https://doi.org/10.1007/s12182-009-0051-7.
Sahebhonar H, Taherifard A, Farimani FM. Economic analysis of new Iranian petroleum contract (IPC): the case study of Caspian Sea fields. In: Energy economics emerging from the Caspian region: challenges and opportunities, 1st IAEE Eurasian conference, Aug 28–31, 2016. International Association for Energy Economics.
Shahri NN. Speculations on the contents of the new Iranian petroleum contracts: buy-back in disguise? Oil Gas Energy Law J (OGEL). 2015;13(6).
Soleimani M, Tavakolian M. Comparative financial analysis of IPC, the new Iran’s oil fields development and production enhancement framework IPC versus buyback contracts. SPE symposium: production enhancement and cost optimisation, 7–8 November, Kuala Lumpur, Malaysia; 2017. https://doi.org/10.2118/189239-MS.
Tordo S. Fiscal systems for hydrocarbons: design issues. The World Bank; 2007. https://doi.org/10.1596/978-0-8213-7266-1.
van Groenendaal WJ, Mazraati M. A critical review of Iran’s buyback contracts. Energy Policy. 2006;34(18):3709–18. https://doi.org/10.1016/j.enpol.2005.08.011.
Author information
Authors and Affiliations
Corresponding author
Additional information
Handling Editor: Qi Zhang
Edited by Xiu-Qiu Peng
Rights and permissions
Open Access This article is licensed under a Creative Commons Attribution 4.0 International License, which permits use, sharing, adaptation, distribution and reproduction in any medium or format, as long as you give appropriate credit to the original author(s) and the source, provide a link to the Creative Commons licence, and indicate if changes were made. The images or other third party material in this article are included in the article's Creative Commons licence, unless indicated otherwise in a credit line to the material. If material is not included in the article's Creative Commons licence and your intended use is not permitted by statutory regulation or exceeds the permitted use, you will need to obtain permission directly from the copyright holder. To view a copy of this licence, visit http://creativecommons.org/licenses/by/4.0/.
About this article

Cite this article
Farimani, F.M., Mu, X., Sahebhonar, H. et al. An economic analysis of Iranian petroleum contract. Pet. Sci. 17, 1451–1461 (2020). https://doi.org/10.1007/s12182-020-00486-2
Received:
Published:
Issue Date:
DOI: https://doi.org/10.1007/s12182-020-00486-2