
Abstract
The pressure-sensitive effect on the pore structure of sandstone was investigated using X-ray computed micro-tomography and QEMSCAN quantitative mineral analysis. In a physical simulation study, we extracted the pore network model from digital cores at different confining pressures and evaluated the effect of pressure sensitivity on the multiphase displacement process. In both the pore network model and QEMSCAN scanning, the pore structure was observed to be damaged under a high confining pressure. Due to their different scales, the pores and throats exhibited inhomogeneous changes; further, the throats exhibited a significant variation compared to that exhibited by the pores. Meanwhile, the heterogeneity of the pore structure under the two aforementioned activities was aggravated by the elastic–plastic deformation of the pore structure. The pressure-sensitive effect increased the proportion of mineral particles, such as quartz (the main component of the core skeleton), and reduced the proportion of clay minerals. The clay minerals were originally attached to the pore walls or interspersed in the pores; however, as the pressure increased, the clay minerals accumulated in the pores resulting in blockage of the pores. While simulating the multiphase displacement process, increasing the confining pressure was observed to severely restrict the flowability of oil and water. This study promises to improve the efficiency of reservoir development in terms of oil and gas exploitation.
1 Introduction
Stress sensitivity defines the influence of the pressure difference that is produced by the combination of the rock matrix stress and porous fluid pressure on the porous microstructure (Li and Tu 2008). When a reservoir is exploited, the fluids in the formation are recovered and the formation pressure is reduced, which changes the original stress equilibrium of the rock. As the pores shrink or even close under the elastic–plastic rock deformation, the reservoir properties are observed to deteriorate and the fluid flow ability is observed to reduce. The change of permeability in the reservoir rocks due to stress sensitivity during exploitation is extremely irreversible, especially in low-permeability reservoirs with poor properties. In low-permeability argillaceous sandstone reservoirs, a decrease of more than 60% in the permeability is irreversible (McLatchie et al. 1958; Shi and Sun 2001). Therefore, investigating the effect of pressure sensitivity on the reservoir and its fluids is essential for effective oil exploitation (Feng et al. 2013; Huang et al. 2014).
The pressure-sensitive phenomena were discovered in 1928, and several scholars have investigated the pressure sensitivities of reservoirs under a confining pressure (Biot and Willis 1957; Geertsma 1957). Pressure sensitivity is most commonly measured in conventional physical experiments (Xie and Chen 2013). The confining pressure on the core is incremented, and the permeability and porosity of the core are monitored in real time. The variations in physical properties and the stress sensitivity of the core are also analysed. Hall plotted the relation between pore compressibility and porosity in sandstones and limestones (Hall 1953). McLatchie et al. constructed a curve of k/k0 versus the confining pressure in pure and shaly sandstones (McLatchie et al. 1958). Actually, conventional macro-scale experiments can only evaluate the pressure sensitivity of rock by analysing the changing petrophysical properties of the rock. They cannot study the mechanisms of stress sensitivity or quantitatively characterise the changes in the pore structure. To overcome this defect, some scholars have coupled the rock skeleton and fluid in a numerical model and simulated the stress sensitivity phenomenon with the seepage state of the fluid and rock deformation (Cheng et al. 2013; Wang et al. 2013). However, numerical simulations have been used to develop a theoretical concept through mathematical calculation and model simplification, without any backup from physical experiments. As the models are necessarily simplified, their results will deviate from the behaviour of the actual reservoirs. Therefore, the changing pore structure and fluid under an increasing confining pressure must be studied at the micro-scale.
Previous studies have focused on the influencing factors and the laws underlying the macroscopic permeability change, which reflects the microscopic changes in all the pores and throats in the core. To accurately understand the mechanism of stress sensitivity in natural cores, we should investigate the process of inhomogeneous variation in the pores and throats and the mineral changes during stress increments.
Micro-scale pressure sensitivity effects are mainly investigated by micro-computed tomography (micro-CT) and QEMSCAN technology (Cai et al. 2014; Iglauer et al. 2011; Iglauer and Lebedev 2017; Lebedev et al. 2017a, b; Yang et al. 2017; Zhang et al. 2016a, b, 2018). A continuous series of scanning images captures the dynamic changes of the fluid phase and pores in the core. The core properties can be quantitatively characterised using software based on the CT number distribution (Andrew et al. 2014a, b). The QEMSCAN technology scans the core in a vacuum environment and can classify and quantitatively analyse the mineral components of the core surface. Using CT scanning technology, Li et al. derived the relation between the confining pressure and the physical properties of the pore structure in one-phase fluid pressure-sensitive experiments (Li et al. 2015). They focused on the pore-media changes rather than the pressure-sensitive effects on the seepage process of multiphase fluids in the cores, which are more concerning in oilfield development. Yang et al. studied the variation of pore structure and fluid after the pressure-sensitive effect in medium- and low-permeability sandstones and tight sandstones (An et al. 2016). They also employed the CT scanning technique, and their processing methods and results were similar to those of Li et al. The pressure-sensitive variation behaviour of the different minerals was not reported. The QEMSCAN technology has been mainly applied to perform water sensitivity, acid sensitivity and alkali sensitivity tests in damaged reservoirs (Fang et al. 2016; Ma et al. 2016; Wang et al. 2013). However, pressure sensitivity tests have not been performed using this technology.
This study combines micro-CT scanning with the QEMSCAN technology to identify the inhomogeneous variations in pores and throats under a confining pressure. It also explores the mineral composition of the core and the degree of mineral deformation. The effect of pressure sensitivity on the two-phase seepage is investigated by simulating the pore network models.
2 Experimental
2.1 Experimental procedure
Flow experiments were conducted on a core that was drilled from a larger core and dried at 80 °C for 48 h. The core was well sorted and relatively homogeneous. The physical dimensions and properties of the core are presented in Table 1. The displacement fluid was simulated formation water, and its composition and total dissolved solids are listed in Table 2.
The displacement experiment proceeded with the following steps:
-
(1)
Core A was sliced from the core. Further, the internal side of the section was smoothed and carbon-coated. QEMSCAN was used on this side to obtain the original mineral distribution of core.
In order to reduce the core damage and experimental error in the process of core cutting, the following measures were taken in the cutting process:
-
(a)
Dispensing cooling lubricants according to the reservoir physical properties. It is composed of emulgator and oil. This type cooling liquid can reduce the frictional resistance and accelerate the efflux rate of precipitated powder. In this way, the grinding wheel can reduce the damage on the core surface.
-
(b)
Choosing grinding wheel with an appropriate thickness to reduce the deflection and vibration of the grinding wheel.
-
(c)
During the cutting process, we maintained the cutting pressure to realise the stability of cutting speed.
-
(d)
After obtaining the cutting section, we carried on the drying process to guarantee the dryness of slice and used gas to clear up stemming caused by the cutting in the surface of the core.
The above measures taken during the cutting process would minimise the additional damage. The test results can satisfy the requirement of experimental error.
-
(2)
The experimental setup was connected as shown in Fig. 1. Core A and the remaining core were placed in the core holder and subjected to a confining pressure of 5 MPa for 2 h.
Fig. 1 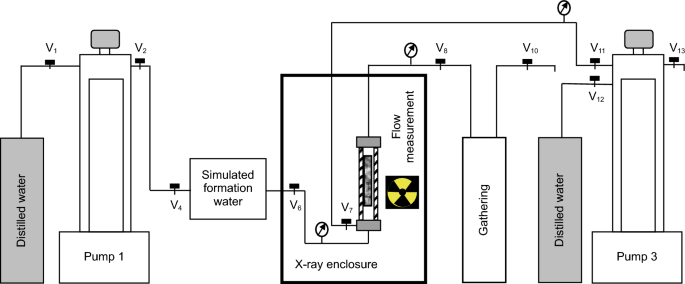
Schematic of the core-flooding process
-
(3)
The core was evacuated and completely saturated with the simulated formation water.
-
(4)
The flow rate of the fluid was gradually increased from 0.01 mL/min to a maximum value of 0.5 mL/min. After injecting several pore volumes of the fluid to reach a steady state, the inlet pressure, outlet pressure and outflow volume were recorded. The core was further scanned by X-ray CT at a resolution of 2.01 μm/pixel.
-
(5)
Step 3 was repeated as the confining pressure was incremented from 5 to 10, 15 and 20 MPa and was further decremented from 20 to 15, 10 and 5 MPa.
-
(6)
The core was removed from the core holder and dried at 80 °C. Further core B was cut from the remaining core. The scanning surface of section B was polished and carbon-coated; the surface was scanned using the QEMSCAN to obtain its mineral distribution after pressure changes. The scanning positions are depicted in Fig. 2.
Fig. 2 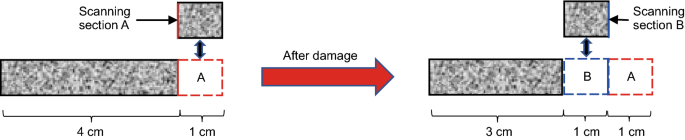
Scanning position of QEMSCAN samples


2.2 Image processing
Initially, we calculated both representative elementary volumes (REV) for the sample using the porosity data that were obtained under different confining pressures during the increasing process. Further, we generated a series of cubic samples having various side lengths and calculated the porosity for each sample. It has been demonstrated that the imaged volumes used in this study are larger than the REVs of the samples; see Fig. 3.

Variation of porosity with various sub-sample volumes under increasing confining pressure
Figure 4a is obtained by scanning the plug under a confining pressure of 15 MPa by X-ray CT. After three-dimensional reconstruction, the images were filtered using a non-local mean to eliminate noise (Buades et al. 2005), as depicted in Fig. 4b. The grey value of the rock was low, whereas the grey value of the pore space was quite high. During the segmentation process, a watershed method based on histogram thresholding was performed to extract the pore space and the solid (Andrew et al. 2015); see Fig. 4c. Further, we obtained the three-dimensional rendering of the pore and rock, as depicted in Fig. 4d. Finally, as per Fig. 4d, the pore network model of the core was established (Fig. 4e). The image processing was conducted using Image, J PerGeos1.5.0 and Icore.

Slices through the plug and the image processing workflow of images under 15 MPa confining pressure. a The original image (diameter = 2.52 μm); b Filtered original image; c Segmented filtered original image (the pore is blue and the grain is grey); d Three-dimensional rendering of the pore and grain (the pore is blue and the grain is grey; side length = 16.8 μm); e Pore network model of the core (the pore is yellow and the throat is light grey)
The permeability was obtained by simulating the one-phase fluid seepage process according to the pore network model of the core, and this permeability was compared with that of calculated using Darcy’s formula. If the results were inconsistent, the image was re-segmented until the permeabilities of both the methods coincided. The main processing steps are depicted in Fig. 5.

Main steps of image processing
The three-dimensional rendering of the core was obtained under different confining pressures, as depicted in Fig. 6. As the confining pressure increased, the pore size gradually decreased while the rock skeleton expanded. The volume of the large pores remained unchanged; however, the small pores and some micro-pores shrank significantly (red ellipse), whereas some even closed. As the confining pressure reduced, the pore sizes gradually increased and the rock skeleton decreased. Some closed pores reopened and expanded; however, the majority of them remained closed (light blue ellipse). This indicated a serious pressure-sensitive effect. Further, we obtained a pore map by extracting the image under confining pressure of 5 MPa and 20 MPa (See Fig. 7). The change in the pore space when the confining pressure is maximised can also be observed.

Digital cores during the increase (up) and decrease (down) of the confining pressure. The grey and blue phases denote the rock skeleton and pores, respectively

Pore map by extracting the image under confining pressures of 5 and 20 MPa
2.3 Pore network model
The pore network model is constructed from throats and pores by simplifying the complex and irregular pore structure to form a regular geometry with rectangular, circular and arbitrary triangular forms (Fatt 1956a, b, c; Oren and Bakke 2003; Sheppard et al. 2005). Its topological structure is equivalent to that of the digital core, which excludes the pores having a coordination number of zero. The number of pore throats that connect with each pore is the coordination number. The pore network model facilitates the simulation of fluid seepage and data analysis. It can be extracted by organising the maximally inscribed balls of the pores or throats that represent the volumes of the pores or throats (Dong and Blunt 2009; Silin et al. 2003). The cross-sectional shapes of the pores and throats were characterised by their geometric shapes that captured their topological structure. The pore network model of the digital core is depicted in Fig. 8.

Pore network model during the increase (above) and decrease (below) of the confining pressure. The yellow and grey phases denote the pores and throats, respectively
As depicted in Fig. 8, increasing the confining pressure gradually reduced the number of small pores (red circle) while the large pores remained almost unchanged. Decreasing the confining pressure gradually increased the number of pores (light blue circle), as some of the pores recovered their original state. However, most of the small pores remained closed, reflecting the strong stress sensitivity of the cores.
3 Results and discussion
To extract the pore network model, we detected the segmentation threshold that was decided by the permeability of the segmentation image. Figure 9 plots the experimentally measured permeabilities as functions of increasing and decreasing confining pressure. As the confining pressure increased from 0 to 20 MPa, the permeability decreased exponentially, with a total decline of 2345 mD and a maximum permeability damage rate of 83.9%. The latter result indicated strong stress sensitivity damage. As the confining pressure decreased, the permeability gradually increased again; however, it did not recover to its initial level. The maximum irreversible permeability damage rate was 38.5%, which seriously affected the flowability of the fluid. Therefore, the stress-sensitive effect on the pore structure and rock fluid in the pores cannot be neglected.

Relationship between permeability and confining pressure
3.1 Relationship between effective stress and pore structure
The pore structure has been analysed by quantitatively characterising the parameters of the pore structure in the pore network model. We observed that gradually increasing the confining pressure elicited different pressure-sensitive effects on the pores and throats, that is, the changes in the pores and throats were unbalanced.
3.1.1 Cumulative distribution of the pore and throat radius
Figure 10a, b depicts the cumulative distributions of the pore and throat radius as the confining pressure increased from 5 to 20 MPa. As the pressure increased, the curves moved upward. The proportion of small pores and throats increased, whereas the proportion of large pores and throats declined. This result reflects the squeezing of the pores and throats under an increasing external force and the gradual reduction in their volume. Pores with large radius became small-radius pores, while the volumes of the originally small pores or throats were diminished (sometimes to zero). The squeezed pore structure exhibited different deformations of the pores and throats; the cumulative contributions of the pore and throat radius increased by 6.69% and 11.30%, respectively. Thus, increasing the pressure affected the throats to a considerable and more obvious extent than the pores. Moreover, the deformation was higher in small throats than in large throats. This imbalance can be explained by the different size scales of the pores and throats. Under the same confining pressure, the deformation range was also larger in throats than in pores. Specifically, the throat and pore radius ranged from 4 to 115 μm and from 5 to 158 μm, respectively (Fig. 10a, b).

Cumulative contributions of the pore radius under increasing (a) and decreasing (c) confining pressure, and cumulative contributions of throat radius under increasing (b) and decreasing (d) confining pressure
Figure 10c, d depicts the cumulative distribution of the pore and throat radius as the confining pressure decreased from 20 to 5 MPa. The variations in radius were very similar to those in the pressure increasing process; however, the movement of curve was smaller, and the pore and throat volumes were not restored to their original states. This showed that the deformation of rock particles was not a single deformation.
3.1.2 Cumulative distribution of the throat lengths
Figure 11 depicts the cumulative contributions of the throat lengths under increasing and decreasing confining pressures. As the pressure increased, the proportion of short throats gradually increased while the proportion of the long throats decreased (Fig. 11a). In the initial state, most of the throats in the core were long; micro-throats constituted a small proportion. At high confining pressures, the long throats were shortened and the micro-throats were severely shortened and even closed at times.

Cumulative contributions of throat lengths under increasing (a) and decreasing (b) confining pressure
The same conclusions can be drawn from Fig. 11b. However, as the pressure decreased, the length recovery could not offset the length compression. For example, when the confining pressure increased from 10 to 15 MPa; 90.5% of the throats were micro-throats; however, the micro-throat contribution increased to 92.6% when the confining pressure decreased from 20 to 15 MPa. The lack of restoration to the original length, even when the confining pressure decreased to its initial value, was again attributable to the plastic deformation of minerals.
3.1.3 Coordination number of the pores
Figure 12a, b shows the coordination numbers of the pores under increasing and decreasing confining pressure, respectively. In both panels, the coordination number was concentrated in 1–10. As the confining pressure increased, the curve dipped at a coordination number of 5, and the proportion of pores with coordination numbers 3–9 slightly decreased (Fig. 12a). Meanwhile, the proportion of pores with coordination numbers 1 and 2 gradually increased. These trends indicate an overall decrease in the average coordination number (from 4.78 at 5 MPa to 2.89 at 20 MPa). Increasing the confining pressure reduced the volume of the throats connecting the pores. Consequently, the connectivity was lowered and the coordination number of the pores was decreased.

Coordination number of pores under increasing (a) and decreasing (b) confining pressure
As the confining pressure was reduced, the number of pores with coordination numbers 1–2 and 3–9 gradually increased and decreased, respectively, indicating partial recovery of the pore volume as the pressure relaxed. However, the coordination number was not restored to its pre-compressed level; at the same pressure, the proportion of pores with coordination number 1–2 was higher during the decreasing pressure process than during the increasing pressure process.
3.1.4 Shape factor of the pores and throats
The shape factor quantitatively characterises the shapes of the pores and throats. Figure 13 shows the shape factors of the pores and throats as the confining pressure increased and decreased. Increasing the confining pressure shifted the curves to the left (Fig. 13a, b). In particular, the median value of the pore (throat) shape factor decreased from 0.0465 (0.0518) at 5 MPa to 0.0413 (0.0457) at 20 MPa. As is well known, the shape factor is (0.0710, 0.0796) for a circular section, (0.0481, 0.0710) for a square section and (0, 0.0481] for a triangular section. Therefore, the left shift of the curve indicates that as the pressure increased, the mineral particles were deformed by varying extents, driving the overall section of the pore network model towards a triangular shape. It follows that the pore structure becomes more irregular under external pressure and that the shape factors of the pores and throats change by different extents.

Shape factors of the pores under increasing (a) and decreasing (c) confining pressure and shape factors of the throats under increasing (b) and decreasing (d) confining pressure
Decreasing the confining pressure elicited the opposite response to increasing the pressure (i.e., the curves shifted to the right; see Fig. 13c, d); however, the shape factor of the compressed material was not restored to its form at the time of initial pressure application due to the elastic–plastic deformation caused by the heterogeneous mineral distribution.
3.2 Mineral distribution and degree of deformation
QEMSCAN comprehensively detects the mineralogy and petrology of core samples in an automated manner. The technology not only microscopically analyses the morphological distribution of the sample but also provides a qualitative and semi-quantitative analysis of the different components in the sample. In this study, we scanned the core sections before increasing the pressure and after decreasing the pressure. The degree of core damage can be determined from the changes in the clay minerals and their components after the pressure changing.
According to the results of mineral distribution, the slices were mainly composed of quartz, feldspar, dolomite, muscovite and calcite. The clay minerals constituted illite, chlorite, smectite and kaolinite. (See Table 3.) The major clay minerals were illite and chlorite, accounting for 66.3% and 26.4% of the total clay minerals, respectively. Figure 14 depicts the distribution of each mineral before pressure changing. In the figure, the core skeleton comprised particles and cementation. Most of the pores were intergranular and distributed between the rock particles. Moreover, the chlorite and illite particles were attached to the surface of pores (Fig. 14a, b) or bridged in the pore space (Fig. 14c, d).

Mineral distribution in the core before pressure changing. a (105, 185), b (89, 579), c (425, 643), d (235, 890). Black circles denote the chlorite and illite distributions in the pores and throats, respectively; the numbers of (105, 185), (89, 579), (425, 643), (235, 890) are the position of each figure in whole QEMSCAN scanning picture (x, y)
Figure 15 depicts the mineral distribution in the core after pressure changing. Under the confining pressure, the illite and chlorite were aggregated into clumps, blocking the pore space and reducing the permeability. The altered mineral composition that is observed after the pressure changing response is exhibited in Fig. 16. The clay minerals were plastically deformed under pressure and their volume proportion decreased, while the proportions of quartz, feldspar and other mineral particles increased. Although the quartz and other minerals were elastically deformed, the core volume was reduced and the pore structure was altered by the changing of pressure. Consequently, the pores reduced in proportion and spatial occupancy and became clogged with clay minerals, considerably reducing the mobility of fluids in the core.

Mineral distribution in the core after pressure changing. a (57, 489), b (405, 293), c (486, 487), d (104, 654)

Variation of major mineral composition after the pressure sensitivity test
3.3 Results of two-phase flow simulation
The fluid in the pores of an exploited reservoir often exists in multiple phases. As the water-flooding process often retrieves water in addition to crude oil, measuring the pressure-sensitive effect of a one-phase fluid is observed to be insufficient. However, the pore structure of the real core is very complicated, and the section shape is extremely irregular. Therefore, directly simulating the seepage process of a two-phase fluid in the digital core is unrealistically difficult and requires enormous amounts of data. As a compromise, we established a pore network model by simplifying the section shape of the pores and throats to obtain a regular shape in which the flow seepage process can be easily simulated.
The two-phase seepage in the pore network model (Fig. 8) was based on invasion–percolation theory (Valvatne and Blunt 2004; Blunt 1998; Yao et al. 2007). The seepage stage was divided into two stages: oil-driving water that establishes the saturation of irreducible water and oil displacement by water imbibition. This study focuses on the relative permeability of the water-flooding stage, as this stage is dominantly important in reservoir development. As depicted in Fig. 17a, increasing the confining pressure reduced the overall permeability of the water and oil phases, and the intersection of the oil and water permeability curves shifted downwards. Both of these phenomena were caused by continuous deformation of the pore structure under the confining pressure. Consequently, the mobility of the fluid that was flowing in the pores was continuously reduced. Meanwhile, from 5 to 20 MPa, the irreducible water saturation increased from 15.8% to 18.5%, whereas the residual oil saturation rose from 16.0% to 25.3%. This trend was also caused by the deformation of the pore structure. As the confining pressure increased, part of the fluid was trapped in the pores and throats of the deformed, reduced connectivity pore structure. At high pressures, the deformation of the pore structure became more serious and contained more residual liquid.

Relative permeabilities of the water-flooding stage under increasing (a) and decreasing (b) confining pressure
As the confining pressure decreased (Fig. 17b), the relative permeability curves of the oil and water behaved similar to those observed under an increasing pressure. However, the non-uniform deformation of the mineral particles prevented complete restoration of the relative oil–water permeability.
To explore the effect of pressure sensitivity on a two-phase fluid, we varied the pressure from 5 to 20 MPa and established the relations between water saturation and water cut. We also calculated the flooding efficiency using the Berkeley–Lievert equation. The results are depicted in Fig. 18 and Table 4, respectively.

Relations between water saturation and water cut under increasing (a) and decreasing (b) confining pressure
Increasing the confining pressure decreased the saturation at the water-flood front location (Fig. 18) and reduced the flooding efficiency (see Table 4). High confining pressure also reduced the water displacement efficiency, impeding the effective development of the reservoir.
4 Conclusions
This study investigated the pressure-sensitive effect on the pore structure of sandstone using micro-CT scanning and QEMSCAN technology. A pore network model was simulated under different confining pressures. Increasing the confining pressure decreased the radii and shape factors of the pores and throats, shortened the lengths of the throats and reduced the coordination numbers of the pores. Releasing the confining pressure partially recovered all these parameters; however, complete recovery was prohibited by elastic–plastic deformation of the core.
Additionally, we observed inhomogeneous variation of the pores and throats during the pressure-sensitive process. Owing to the different size scales of pores and throats, the throats were altered more than the pores. Furthermore, the elastic–plastic deformation of the pore structure was responsible for the serious non-recoverability of the structure, even after the pressure had decreased to its initial state. Therefore, the inhomogeneous changes in the pores and throats also aggravated the heterogeneity of the pore structure.
The QEMSCAN retrieved the mineral composition of the core and the degree of deformation of each mineral. The pressure-sensitive effect elastically deformed the mineral particles such as quartz (the component of the core skeleton) and increased the proportion of the total mineral volume. As the pressure increased, the clay minerals that were attached to the pore walls or interspersed in the pores became agglomerated in the pores, thereby blocking them. The high confining pressure also reduced the volume ratio of the clay minerals to total minerals, reduced the overall core volume, reduced the pore volume and impeded the seepage process of the fluid.
In the pore network model, we also simulated the effect of pressure sensitivity on the multiphase displacement process. Increasing the confining pressure decreased the flowability of the oil and water phases. At high confining pressures, the pore structure was more seriously deformed and retained more liquid than that observed at low pressures.
References
An S, Yao J, Yang Y, Zhang L, Zhao J, Gao Y. Influence of pore structure parameters on flow characteristics based on a digital rock and the pore network model. J Nat Gas Sci Eng. 2016;36(Part A):156–63. https://doi.org/10.1016/j.jngse.2016.03.009.
Andrew M, Bijeljic B, Blunt MJ. Pore-scale contact angle measurements at reservoir conditions using X-ray microtomography. Adv Water Resour. 2014a;68(2):24–31. https://doi.org/10.1016/j.advwaters.2014.02.014.
Andrew M, Bijeljic B, Blunt MJ. Pore-scale imaging of trapped supercritical carbon dioxide in sandstones and carbonates. Int J Greenh Gas Control. 2014b;22(2):1–14. https://doi.org/10.1016/j.ijggc.2013.12.018.
Andrew M, Menke H, Blunt MJ, Bijeljic B. The imaging of dynamic multiphase fluid flow using synchrotron-based X-ray microtomography at reservoir conditions. Transp Porous Media. 2015;110(1):1–24. https://doi.org/10.1007/s11242-015-0553-2.
Biot MA, Willis DG. The elastic coefficients of the theory of consolidation. J Appl Mech. 1957;24:594–601.
Blunt MJ. Physically-based network modeling of multiphase flow in intermediate-wet porous media. J Pet Sci Eng. 1998;20(3–4):117–25. https://doi.org/10.1016/S0920-4105(98)00010-2.
Buades A, Coll B, Morel JM. A non-local algorithm for image denoising. IEEE Comput Soc Conf Comput Vis Pattern Recognit. 2005;2(7):60–5.
Cai Y, Liu D, Mathews JP, Pan Z, Elsworth D, Yao Y, et al. Permeability evolution in fractured coal: combining triaxial confinement with X-ray computed tomography, acoustic emission and ultrasonic techniques. Int J Coal Geol. 2014;122:91–104. https://doi.org/10.1016/j.coal.2013.12.012.
Cheng Y, Wu B, Li N, Yuan Z, Xu T. Research into the propagation of hydraulic fractures under coal-bed stress sensitivity. J China Coal Soc. 2013;38(9):1634–9 (in Chinese).
Dong H, Blunt MJ. Pore-network extraction from micro-computerized-tomography images. Rev E Stat Nonlinear Soft Matter Phys. 2009;80(2):36–7. https://doi.org/10.1103/PhysRevE.80.036307.
Fang W, Jiang H, Li J, Li W, Li J, Zhao L, et al. A new experimental methodology to investigate formation damage in clay-bearing reservoirs. J Pet Sci Eng. 2016;143:226–34. https://doi.org/10.1016/j.petrol.2016.02.023.
Fatt I. The network model of porous media I. Capillary pressure characteristics. Pet Trans. 1956a;207:144–59.
Fatt I. The network model of porous media II. Dynamic properties of a single size tube network. Pet Trans. 1956b;207:160–3.
Fatt I. The network model of porous media III. Dynamic properties of networks with tube radius distributions. Pet Trans. 1956c;207:164–81.
Feng Q, Liu Q, Li H, Zhang J, Tao H, Luo Y. Effect of permeability stress sensitivity on gas–water well productivity. J Pet Technol. 2013;20(1):89–91 (in Chinese).
Geertsma J. The effect of fluid pressure decline on volumetric changes of porous rocks. Trans Soc Pet Eng. 1957;210:331–40.
Hall HN. Compressibility of reservoir rocks. J Pet Technol. 1953;5(1):17–9.
Huang X, Li J, Lei D, Qi Z, Yue X. Influence of stress sensitivity on gas well productivity for low permeability gas reservoirs. Fault Block Oil Gas Field. 2014;21(6):786–9 (in Chinese).
Iglauer S, Lebedev M. High pressure-elevated temperature X-ray micro-computed tomography for subsurface applications. Adv Colloid Interface Sci. 2017;256:393–410. https://doi.org/10.1016/j.cis.2017.12.009.
Iglauer S, Paluszny A, Pentland CH, Blunt MJ. Residual CO2 imaged with X-ray micro-tomography. Geophys Res Lett. 2011;38(21):1440–1. https://doi.org/10.1029/2011GL049680.
Lebedev M, Zhang Y, Mikhaltsevitch V, Inglauer S, Rahman T. Residual trapping of supercritical CO2: direct pore-scale observation using a low cost pressure cell for micro computer tomography. Energy Procedia. 2017a;114:4967–74. https://doi.org/10.1016/j.egypro.2017.03.1639.
Lebedev M, Zhang Y, Sarmadivaleh M, Barifcani A, Al-Khdheeawi E, Iglauer S. Carbon geosequestration in limestone: pore-scale dissolution and geomechanical weakening. Int J Greenh Gas Control. 2017b;66:106–19. https://doi.org/10.1016/j.ijggc.2017.09.016.
Li C, Tu X. Two types of stress sensitivity mechanisms for reservoir rocks: being favourable for oil recovery. Lithol Reserv. 2008;20(1):111–3 (in Chinese).
Li R, Gao Y, Yang Y, Li Y, Yao J. Experimental study on the pressure sensitive effects of cores based on CT scanning. Pet Drill Tech. 2015;43(5):37–43 (in Chinese).
Ma K, Jiang H, Li J, Zhao L. Experimental study on the micro alkali sensitivity damage mechanism in low-permeability reservoirs using QEMSCAN. J Nat Gas Sci Eng. 2016;36:1004–17. https://doi.org/10.1016/j.jngse.2016.06.056.
McLatchie AS, Hemstock RA, Young JW. The effective compressibility of reservoir rock and its effects on permeability. J Pet Technol. 1958;10(6):49–51. https://doi.org/10.2118/894-G.
Oren PE, Bakke S. Reconstruction of Berea sandstone and pore-scale modelling of wettability effects. J Pet Sci Eng. 2003;39(3–4):177–99. https://doi.org/10.1016/S0920-4105(03)00062-7.
Sheppard AP, Sok RM, Averdunk H. Improved pore network extraction methods. Proc Int Symp Soc Core Anal. 2005;20:21–5.
Shi Y, Sun X. Stress sensitivity analysis of the Changqing tight clastic reservoir. Pet Explor Dev. 2001;5:85–7 (in Chinese).
Silin DB, Jin G, Patzek TW. Robust determination of the pore space morphology in sedimentary rocks. In: Proceedings of the SPE annual technical conference and exhibition. Society of Petroleum Engineers of AIME; 2003. p. 2135–49.
Valvatne PH, Blunt MJ. Predictive pore-scale modelling of two-phase flow in mixed wet media. Water Resour Res. 2004;40(7):187. https://doi.org/10.1029/2003WR002627.
Wang J, Liu H, Liu R, Xu J. Numerical simulation for low-permeability and extra-low permeability reservoirs considering starting pressure and stress sensitivity effects. Chin J Rock Mech Eng. 2013;32(2):3317–27 (in Chinese).
Xie Y, Chen Z. Experiment study of permeability sensitivity in a loose sandstone gas reservoir. Fault Block Oil Gas Field. 2013;20(4):488–91 (in Chinese).
Yao J, Tao J, Li A. Research on oil–water two-phase flow using a 3D random network model. Acta Pet Sin. 2007;28(2):94–7 (in Chinese).
Yang Y, Liu Z, Sun Z, An S, Zhang W, Liu P, et al. Research on stress sensitivity of fractured carbonate reservoirs based on CT technology. Energies. 2017;10(11):1833. https://doi.org/10.3390/en10111833.
Zhang Y, Xu X, Lebedev M, Sarmadivaleh M, Barifcani A, Iglauer S. Multi-scale X-ray computed tomography analysis of coal microstructure and permeability changes as a function of effective stress. Int J Coal Geol. 2016a;65:149–56. https://doi.org/10.1016/j.coal.2016.08.016.
Zhang Y, Lebedev M, Sarmadivaleh M, Barifcani A, Iglauer S. Swelling-induced changes in coal microstructure due to supercritical CO2 injection. Geophys Res Lett. 2016b;43(17):9077–83. https://doi.org/10.1002/2016GL070654.
Zhang Y, Lebedev M, Al-Yaseri A, Yu H, Nwidee LN, Sarmadivaleh M, et al. Morphological evaluation of heterogeneous oolitic limestone under pressure and fluid flow using X-ray microtomography. J Appl Geophys. 2018;150:172–81. https://doi.org/10.1016/j.jappgeo.2018.01.026.
Author information
Authors and Affiliations
Corresponding author
Additional information
Edited by Yan-Hua Sun
Rights and permissions
Open Access This article is distributed under the terms of the Creative Commons Attribution 4.0 International License (http://creativecommons.org/licenses/by/4.0/), which permits unrestricted use, distribution, and reproduction in any medium, provided you give appropriate credit to the original author(s) and the source, provide a link to the Creative Commons license, and indicate if changes were made.
About this article

Cite this article
Li, JJ., Liu, Y., Gao, YJ. et al. Pore-scale study of the pressure-sensitive effect of sandstone and its influence on multiphase flows. Pet. Sci. 16, 382–395 (2019). https://doi.org/10.1007/s12182-018-0266-6
Received:
Published:
Issue Date:
DOI: https://doi.org/10.1007/s12182-018-0266-6