
Abstract
The macula is a unique and important region in the primate retina that achieves high resolution and color vision in the central visual field. We recently reported data obtained from microarray analysis of gene expression in the macula of the human fetal retina (Kozulin et al., Mol Vis 15:45–59, 1). In this paper, we describe the preliminary analyses undertaken to visualize differences and verify comparability of the replicates used in that study, report the differential expression of other gene families obtained from the analysis, and show the reproducibility of our findings in several gene families by quantitative real-time PCR.
Introduction
The macula is an anatomically and functionally distinct region in the primate retina at the center of which is the highly specialized fovea centralis, where there is a peak density of cone photoreceptors. The high packing density of inner and outer segments in the foveal cone mosaic enables a high degree of spatial resolution that is preserved by the “midget” bipolar/ganglion cell circuit. Good visual acuity, however, is also dependent on a clear optical path for incoming light. A lack of large blood vessels in the fovea reduces shadowing of the foveal cone mosaic, avoiding “angioscotomas” in the central visual field [2]. Previous investigations of the developing human and monkey retinas have found that during normal development the growth of retinal blood vessels into the developing macular region is “retarded” [3, 4]. We have also observed that astrocytes, which lead the migration of vascular endothelial cells across the retina, appear to strike a molecular “no-go” barrier that prevents them from entering the foveal region during development [5] and that as a result the foveal region in monkeys and humans is not normally vascularized [5, 6].
Despite these evident specializations of both the neural circuitry and the retinal vessels at the macula, both of which are essential to its functionality, little is known about the genes that generate and regulate the development and maintenance of these features. To address this, we carried out a microarray analysis of gene expression in the developing human macula [1]. We reported the upregulation of axon/vascular guidance genes and some negative regulators of angiogenesis at the developing macula [1]. Here, we provide more information concerning the constraints involved when using rare tissue samples in this type of study and the strategies we used to validate the data as well as provide further analysis of the gene families we found to be differentially regulated in the macula samples.
Materials and methods
Human retinas
Four human retinas were obtained at surgery for termination of pregnancy, with informed maternal consent and the approval of Human Ethics Committees of The University of Sydney and The Australian National University. A single retina was obtained from each fetus aged 19–20 weeks’ gestation (WG). Gestational age was determined by ultrasound prior to surgery and confirmed by postmortem measurements of foot length. RNA was extracted from three sample locations in each retina—“macula,” “nasal,” and “surround” (Fig. 1)—between 90 and 120 min postmortem, as described previously [1]. Due to the difficulties involved in obtaining suitable donor retinas, we obtained the retinas on two separate occasions; two were donated on one day in 2006 and another two on an occasion in 2007. Thus, six cDNA samples (three samples from each of two retinas) were hybridized to microarrays on two separate occasions, i.e., in two “batches”—one in 2006 and another in 2007. The ages of three of the donor retinas were estimated at 19 WG, while the fourth was estimated at 20 WG. These ages are approximate and generally regarded as ±1 week.

Drawing of a 20 WG human retina, showing the patterning of retinal axons (gray) and of the retinal vessels (red). The position of the developing fovea is indicated. The circles indicate the approximate size and locations of the nasal and macula tissue samples excised for RNA extraction and differential gene expression analysis. The retina remaining after the nasal and macula biopsies were removed was used as the third sample region (surround tissue sample). Notice that the macula region is avascular, compared with the nasal region, even though the two sample areas are equidistant from the optic disk
Hybridization and preprocessing
Double-stranded cDNA was generated from each of the samples and transcribed to obtain biotin-labeled cRNA. These cRNAs were fragmented, combined with hybridization and spike controls, and then hybridized to 12 HG-U133 Plus 2.0 GeneChip® microarrays (Affymetrix, Inc., Santa Clara, CA, USA) for 16 h under controlled conditions. Following hybridization, the arrays were washed, stained, and scanned as described previously [1]. The microarray dataset can be accessed in the NCBI Gene Expression Omnibus repository ([7], accession number GSE12621). The quality controls used have been described previously [1]. Affymetrix CEL files were imported into Partek® Genomics Suite™ 6.3 (Partek Inc., St. Louis, MO, USA) using the default Partek normalization parameters. Briefly, probe-level data were preprocessed, including background correction, normalization, and summarization using robust multiarray average (RMA) analysis, and adjusted for probe sequence and GC content (GC-RMA). Adjusted and normalized “perfect match” values were summarized for each probe set to generate a single measure of expression and then log-transformed, base 2. A two-way analysis of variance (ANOVA) was used for differential expression analysis; the ANOVA variables were the sample region (macula, nasal, and surround) and hybridization batch. A significance level of P < 0.01 was used to measure difference in gene expression.
“Batch effect” in the microarray dataset
Because the four donor retinas were collected and processed in two separate batches, differences in sample preparation, reagent lot, and GeneChip® lot had the potential to introduce additional variables into the array data (batch effect). We used two approaches to evaluate the GC-RMA-processed data for batch effects. First, an analysis of signal intensity, both within and between the array batches, and second, filtering of the processed data to visualize “hierarchical clusters” and to carry out principal component analysis (PCA).
-
1.
Signal intensity—density plots
Density plots were generated using the GC-RMA-processed signal intensity data. “Within-batch (2006)” variation at each of the three sample locations was determined by comparing differences in probe set signal intensity data in array 1 with array 2. Similarly, “within-batch (2007)” variation was determined by comparing signal intensity data in array 3 with array 4. “Interbatch variation” was measured by comparing signal intensity data across all four donor samples. The density plots were generated using the kernel density estimation in R version 2.7.0 (The R Foundation for Statistical Computing, http://www.r-project.org). Bandwidth (bin) size for each curve was determined using the method of Silverman [8].
-
2.
Filtering the batch effect
Visualization of the sample differences in the GC-RMA-processed data was achieved by filtering, using Partek software. The “batch effect filter” uses a mixed-model ANOVA to estimate the effects of batch and adjusts the data to render the batches as equivalent. Because the batch effect filter processes the data in a similar manner to the ANOVA, which is integral to subsequent data processing, we used this approach to obtain a view of the clustering of gene expression profiles in our samples. We used two methods of visualization—“hierarchical clustering” and “principal component analysis.”
Hierarchical clustering
We used the agglomerative clustering method, whereby the two most similar items are combined at each stage. Once the first cluster is formed, the next two most similar items/clusters are combined; this pattern of combination is reiterated until all objects are clustered. Interobject/cluster distance and dissimilarity were measured using average linkage and the Euclidean distance metric, respectively. Objects that are very similar are, thus, combined with short dendrogram branches, while relatively dissimilar groups are indicated by elongated dendrogram branches.
Principal component analysis
PCA is a method of reducing the number of observed variables in a dataset to a smaller number of principal components (PC) that account for most of the observed variance. PCA reduces the dimensionality of the dataset into n PC, where n equals the number of datasets—in this case, the number of arrays is n = 12. The PC are ordered by the amount of variance explained—such that the first PC accounts for the largest amount of variance and the 12th for the smallest amount—and are uncorrelated. The variances of the PC are given by the eigenvalues, and the rotations of the PC are given by the eigenvectors [9, 10]. We used Partek software for PCA, using normalized eigenvector scaling and a correlation dispersion matrix.
Quantitative real-time PCR
Microarray differential gene expression results were verified using quantitative real-time polymerase chain reaction (QRT-PCR). The detailed protocols for cDNA synthesis, primer design, and equipment and settings have been described previously [1]. Product amplification was measured using either an Invitrogen (Carlsbad, CA, USA) SYBR® Green-based kit (individual reagents or premade master mixes) or Taqman® probes (Applied Biosystems, Melbourne, Australia). We used cDNA from human fetal retinas aged between 17 and 20 WG as template. Each QRT-PCR reaction volume was 20 µl with 0.4 µl cDNA, except reactions made with SYBR® Green ER™ supermix which contained a 25-µl reaction volume with 0.5 µl cDNA. Taqman reactions were performed in triplicate with template from three different specimens. Because of the limited availability of human fetal mRNA, some QRT-PCR reactions were run in triplicate using template from only one or two specimens. Amplification was normalized relative to a glyceraldehyde-3-phosphate dehydrogenase (GAPDH) reference gene and analyzed with the Pfaffl [11] method of relative quantification. GAPDH was amplified using custom primers (SYBR Green) or a Taqman probe according to the amplification system used for each run. The specificity of amplification was determined by melt curve analysis (SYBR Green) or 1% agarose gel electrophoresis (Taqman). Primers and Taqman probes used for genes that we have not reported previously are listed in Tables 1 and 2, respectively.
Biological process clustering
We used the functional annotation tool on the Database for Annotation, Visualization, and Integrated Discovery (DAVID) website [12, 13] to cluster groups of genes highly represented in the macula vs. surround and macula vs. nasal differential expression gene lists. The genes were clustered according to functional roles or “biological process” as specified by the Gene Ontology Consortium [14] using an Expression Analysis Systematic Explorer (EASE) score threshold of 0.1.
In the 19–20 WG retinas used in the current study, we know that there are significant differences in cell function between macular and nonmacular locations because it is well documented that retinal differentiation proceeds in a centroperipheral pattern, centered on the macula. By 19 WG, the majority of cells in the macula have ceased mitosis and have differentiated as neurons. In contrast, retinal progenitor cells in nonmacular locations are still proliferating at 19 WG [15, 16]. The mature state of cells in the macula suggests that biological processes related to metabolism, neurotransmission, and phototransduction would be differentially regulated in the macula, relative to nonmacular regions. For this reason, genes that clustered under those headings, together with genes that regulate cell cycle and cell proliferation, were excluded from further differential analyses. The remaining list of genes was then subcategorized again according to Gene Ontology Consortium biological processes using the DAVID web tool and 0.1 EASE score threshold.
KEGG pathway and InterPro protein database analysis
The remaining gene lists were also subcategorized according to the pathways described by the Kyoto Encyclopedia of Genes and Genomes (KEGG) [17] and the InterPro protein database [18]. The KEGG and InterPro databases were consulted to determine the dominant molecular/reaction pathways and dominant protein families/domains/regions (respectively) that are represented in and encoded by the differentially expressed genes. This additional clustering was performed using the DAVID web tool and 0.1 EASE score threshold.
Results
Batch effect in the microarray dataset
-
1.
Signal intensity—density plots
The frequency distributions of these differences are shown in Fig. 2. Curves in red show differences in signal intensity between arrays 1 and 2. Curves in green show the differences in intensity between arrays 3 and 4, and curves in black, the interbatch differences for macula (Fig. 2a), surround (Fig. 2b), and nasal (Fig. 2c) samples. The data indicate that, in all sample regions, the differences in signal intensities are small and similar within and between batches. That is, in all comparisons, the modal difference in signal intensity ranged between 0.030 and 0.047. The overwhelming majority of probe sets had very small differences in signal intensity value.
-
2.
Filtering the batch effect
Fig. 2 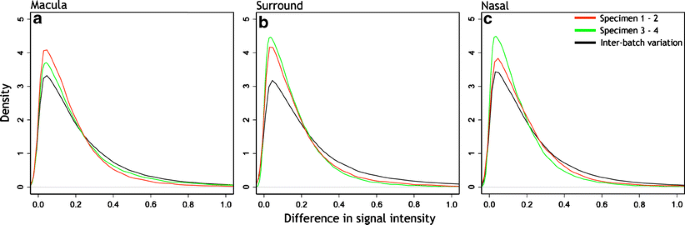
Density plots of interbatch and intrabatch signal intensity variance. The red lines show the difference in signal intensity from the arrays between specimens 1 and 2 (batch 1); the green lines show the difference in signal intensity from the arrays between specimens 3 and 4 (batch 2), and the black lines show the difference in signal intensity between the batches. The plots were normalized such that the area under each curve is 1. The Y-axis shows normalized density or frequency for each signal variance bin. Bin size ranged from 0.0127 to 0.0169. The peak of each curve indicates modal signal variance, which is similar for each of the three comparisons in each sample region. The peak values show minor differences in signal intensity variance between arrays or between batches, indicating no need to adjust for signal intensity levels between batches. Peak values ranged between: a macular arrays, 0.042 and 0.046; b surround arrays, 0.030 and 0.044; c nasal arrays, 0.032 and 0.047

Hierarchical clustering
Dendrograms obtained using Partek software showing the clustering of gene expression profiles from the 12 samples of human fetal retina are shown in Fig. 3. Figure 3a is a dendrogram showing clustering of gene expression profiles before application of the batch filter. Each of the two major clusters in the dendrogram comprises samples from only one batch (2006, specimens 1 and 2, or 2007, specimens 3 and 4). Within these major clusters, the macula samples cluster separate from the nasal and surround samples, which tend to cluster together. Analysis of the data adjusted for the batch effect is shown in Fig. 3b. This dendrogram shows two primary clusters, one entirely comprising macula samples and the other comprising a combination of nasal and surround samples. The data show that the gene expression profiles in the four macula samples are more similar to each other than to other locations of the same donor retinas.

Hierarchical clustering of the microarray gene expression profiles. The sample region (left column) and specimen (right column) is indicated for each array in the dendrograms. a. Hierarchical clustering before application of the batch effect filter. Clustering is greatest between arrays within specimens and batch. The four most similar pairs of arrays (shortest dendrogram branches) are the nasal and surround arrays from each specimen. The greatest dissimilarity in the dendrogram exists between the two batches (specimens 1 and 2 versus specimens 3 and 4) since the final (leftmost) cluster exists between these two groups of arrays. b Hierarchical clustering after application of the batch effect filter. The macula arrays exhibit greater similarity with each other than with the nasal or surround arrays, even from the same specimen
Principal component analysis
Results of the PC analysis are shown in Fig. 4. Typically, only the first few PCs are visualized, since these account for most of the variance in the data. Figure 4 shows plots of the first three PC of the log-transformed GC-RMA-processed data, on X–Y–Z axes, before (Fig. 4a) and after (Fig. 4b) the batch effect filter was applied to the data. In these plots, points near each other are similar, while points far apart are different in a large number of variables. On the plot, color indicates sample location, and shape indicates specimen number. Figure 4a shows batch-induced separation of the six arrays prepared in 2006 (tetrahedrons and cubes) to the right, with the six prepared in 2007 (octahedrons and spheres) grouping to the left. The proportions of total variance explained by PC 1, 2, and 3 were 28.2%, 15.9%, and 9.0%, respectively.

Principal component analysis of the microarrays. Each data point/shape represents a microarray, with all 12 arrays presented on the PCA plot before (a) and after (b) the batch effect filter was applied. Macula (red), nasal (blue), and surround (green) arrays are distinguished by color, and specimens 1 (tetrahedron), 2 (cube), 3 (octahedron), and 4 (sphere) are distinguished by shape. Once the data are adjusted for batch (b), macula arrays aggregate to the left and nasal and surround arrays aggregate to the right of PC 1 (X-axis). The macula array of specimen 4 shows some separation from the other macula arrays along PC 2 (Y-axis). Given PC 1 describes the largest amount of data variance (20.7%), the aggregation of the arrays is mostly accounted for by sample location. The percentage values in parentheses indicate the proportion of total variance described by each PC. PC 1 principal component 1 (X-axis); PC 2 principal component 2 (Y-axis); PC 3 principal component 3 (Z-axis)
PCA after correction of the data for the batch effect is shown in Fig. 4b. This plot shows that the largest source of variation in the gene expression data was sample location, reflected in the tight aggregation of nasal and surround samples to the right, along the X-axis (PC axis 1), and the grouping of macula samples to the left. The macula sample from specimen 4 is separated from the other macula samples along the Y-axis (PC axis 2) but still groups more closely with the other three macula samples than with the nasal/surround samples along the X-axis. The proportions of total variance explained by PC 1, 2, and 3 are 20.7%, 14.0%, and 12.2%, respectively.
Quantitative real-time PCR
Table 3 is a summary of differential gene expression results prepared for parts of other studies [1, 19] (Kozulin et al., manuscript in preparation) and included here to demonstrate consistency of the microarray differential expression data, with differential expression levels quantified by QRT-PCR. The data show good agreement between levels measured by QRT-PCR and the microarray, particularly where P < 0.01 (probe sets not indicated*). Figure 5 shows the results for other genes for which differential expression is not reported elsewhere. QRT-PCR (dark gray bars) shows strong consensus with the direction of modulation (upregulation or downregulation) as well as the magnitude of modulation for most of these genes.

Comparison of microarray (P < 0.01, light gray/hatched bars) and QRT-PCR (dark gray) measures of gene expression in the macula, relative to the surround. Error bars show standard error of the mean. Standard error for the microarray data is derived from the distribution of fold changes measured across the four hybridized specimens. a, b QRT-PCR performed in triplicate from the template of one human retinal specimen at 17.5 WG (CD80, FOXG1B, SLIT2, UNC5A) or 19 WG (EGF, PTGDS), using a SYBR Green kit. c QRT-PCR performed in triplicate from the template of two different specimens (19 WG), using SYBR Green. d QRT-PCR performed in triplicate from the template of three different specimens (19 WG), using Taqman probes. The data show, in general, good consensus between the microarray and QRT-PCR findings. Best consensus was present in the data obtained in triplicate from three biological samples (d). Further experiments would be needed to clarify the expression levels of CD80 and FOXG1B; however, these genes are not presently the subject of ongoing investigations. BAI2 brain-specific angiogenesis inhibitor 2; CD80 CD80 molecule; EGF epidermal growth factor; FOXG1B forkhead box G1; GUCA1C guanylate cyclase activator 1C; OPN1MW opsin 1 (cone pigments), medium-wave-sensitive; PLXNA4 plexin A4; PTGDS prostaglandin D2 synthase 21 kDa (brain); SLIT2 slit homolog 2 (Drosophila); UNC5A unc-5 homolog A (C. elegans); WNT5A wingless-type MMTV integration site family, member 5A
Biological process clustering
Approximately 3,550 genes were found to be significantly differentially regulated in the macula vs. surround and macula vs. nasal comparisons, at P < 0.01. Clustering of these gene lists (DAVID database) generated a set of biological process clusters (see [1], Table 4). Clusters of genes associated with the differentiated state of the macula, relative to the periphery, were identified (listed in Table 4) and removed from the list of differentially expressed macular genes, leaving approximately 1,850 genes in each list of differentially expressed macular genes of interest. These remaining genes of interest were reclustered according to biological process, resulting in about 100 small gene clusters, which were then consolidated into their parent categories. Communication and regulatory processes feature prominently in this refined gene list. The ten most highly represented of these biological processes are shown in Table 5.
KEGG pathway and InterPro protein database analysis
The proportions of macular genes of interest that cluster into highly represented KEGG pathways are shown in Fig. 6. Pathways associated with axon guidance and regulation of the actin cytoskeleton represent between 13% and 23% of the macular genes of interest. The remaining clusters have roles in cell adhesion.

KEGG molecular/reaction pathways highly represented in the lists of macular genes of interest. Percentage values indicate the proportion of genes that clustered to each pathway for the a macula vs. surround and b macula vs. nasal gene lists. Human KEGG pathway ID numbers: ABC transporters—general, hsa02010; apoptosis, hsa04210; axon guidance, hsa04360; cell adhesion molecules, hsa04514; ECM–receptor interaction, hsa04512; focal adhesion, hsa04510; regulation of actin cytoskeleton, hsa04810; ribosome, hsa03010; tight junction, hsa04530
Gene clustering according to the InterPro protein database resulted in 71 and 98 clusters from the macula vs. surround and macula vs. nasal gene lists, respectively. The top 20 of these clusters from each list of genes of interest are listed in Table 6. Cadherins and immunoglobulin superfamily molecules feature prominently on both lists.
Discussion
The macula is uniquely adapted for high-acuity vision and, probably as a result of its high level of specialization, is vulnerable to a number of degenerative diseases that specifically affect the macula. These include age-related macular degeneration, Stargardt’s macular dystrophy, Best vitelliform macular dystrophy, and macular telangiectasia. Despite this, the gene expression profiles that characterize the normal and healthy macula have been the subject of relatively few investigations [20–26]. One of the more critical adaptations of the macula appears to be the exclusion of large retinal vessels and definition of a foveal avascular region. This apparent constraint upon the capacity to deliver high-volume retinal blood flow to the macula is at odds with the very high density of neural elements [27, 28], which carry very high metabolic load [29]. This apparent paradox is explained by observing that the main function of the macula is to deliver high-acuity vision, such that both high photoreceptor/neural densities and the absence of large retinal vessels which would shadow the photoreceptor mosaic have arisen in the macula as a result of evolutionary pressure. A compensatory measure appears to be an extremely high density of microvessels in the central macula [30], carrying with it a vulnerability to microvascular disorders, which may underscore some of the macula vulnerabilities, particularly with respect to immunological responses. For these reasons, we have pursued analyses of gene expression in the developing human macula, at a stage of development when differentiation of the principal cell components is complete but during a period when the characteristics of the macular retinal vasculature are still developing.
Rare tissue samples, batch effect, “expected” findings, and QRT-PCR
A major constraint we had to overcome in this study related to difficulties involved in obtaining retinal specimens from different individuals of comparable ages, in suitable condition to enable accurate biopsy of the macular region, and of suitable quality to undertake the microarray hybridizations. We also wished to avoid differences that may be introduced by “banking” specimens, or RNA, for long periods of time prior to hybridization. The resolution was to process specimens in two batches—since obtaining specimens in pairs is not uncommon. We made several attempts to achieve this and finally carried out the study on two sets of retinas, obtained several months apart, in 2006 and 2007. The “batch analyses” reported here were conducted in order to verify our techniques and to assure ourselves that the two-batch approach did not confound the data prior to the analyses to identify the macular “genes of interest.” Those analyses are informative in that they show first that the signal intensity from the microarrays was not significantly different between individual microarrays or between batches (Fig. 2). Secondly, they enabled us to visualize the effect of “batch” on the data (Figs. 3a and 4a) and, most importantly, that the statistical filtering available through the Partek suite adequately addresses these differences (Figs. 3b and 4b).
While internal quality controls showed that the hybridized microarrays were of high quality, the most important proof of the microarray data is the comparative findings obtained by QRT-PCR. QRT-PCR has verified the direction of modulation of all the genes for which we have made the comparison. In the majority of cases, levels of expression (fold changes) detected by QRT-PCR were within the range of the error bars obtained from the microarray data. Some differences in levels of expression were expected because some of the QRT-PCR runs were made using cDNA from retinas of different ages to the ones used for the microarrays. This compromise was necessary due to the difficulties involved in obtaining fetal retinal tissues in suitable condition to facilitate biopsy and of suitable quality for QRT-PCR. Thus, the different fold-change measures obtained for CD80 (Fig. 5a) and FOXG1B (Fig. 5b) by QRT-PCR compared with the microarrays could be due to the use of template derived from a single retina at 17.5 WG. The opsin gene OPN1MW was amplified using template from two 19 WG retinas, and the relatively higher levels of fold change detected by QRT-PCR possibly reflect higher sensitivity of the approach.
A factor that commonly frustrates microarray studies is the very large number of genes found to be differentially regulated. In the present study, we found more than 3,500 genes differentially regulated in the macula. A standard approach might be to define a level of fold change (e.g., twofold) and a level of significance (e.g., P < 0.001) to identify the significant genes of interest. However, such an approach applied to our dataset would have identified clusters of genes with roles in “cell proliferation” and “cell division” that are differentially expressed in the macula. Such a finding would be anticipated, since it is long established that there is no cell proliferation or cell division in the developing macula by midgestation, but both processes continue in peripheral retina until about 30 WG. One of the strengths of our study, we believe, is that with the knowledge that these biological process clusters would be differentially expressed (downregulated) in the macula, we could (1) use this information to gauge the levels of fold change that might be expected in significant gene clusters and (2) simplify the further analysis by eliminating these categories. Furthermore, at an early stage of the verification process, we ran QRT-PCR for genes that we expected to be upregulated in the macula—because of its more advanced state of differentiation—and compared the findings. Two such genes are shown in Fig. 5c.
Biological process clustering of the gene lists, after removal of expected genes, showed that a large number of genes with roles in “cell communication” and “regulatory processes” are differentially regulated in the macula during development. More specific insight into these families was obtained using KEGG pathway and InterPro gene clustering, showing that genes involved in regulation of the actin cytoskeleton and genes involved in cell adhesion are highly represented in the list of macular genes of interest.
Significance of the different clusters/gene families
Axon and vascular guidance genes
We have addressed the significance of the differential expression of axon guidance genes previously [1] and the role that one of these (EPHA6) may play in development of the retinal projections, and vascular growth in the retina is the subject of a separate study [19]. There is growing consensus that axon guidance molecules provide guidance cues to developing vasculature [31]. Many guidance factors act through repellent mechanisms that drive cells expressing binding partners away from each other, along gradients of ligand and/or receptor expression, and it has been shown that in the developing visual system relative levels of ligand and receptor expression guide outgrowing axons, rather than levels of expression per se [32]. We propose that the group of 25 “axon guidance factors” on our list of macular genes of interest includes genes that regulate both axon and vascular patterning. Our hypothesis is that axon guidance genes mediate axon guidance out of the retina, which takes place between about 8 and 25 WG, and regulate the growth of vessels into the macula between about 15 and 30 WG. In both instances, we propose that the regulatory mechanism is largely repellent, serving initially to guide axons away from the macula and subsequently to slow retinal vessel growth into the macula and prevent large vessels from traversing the central macula and fovea. Our findings suggest, therefore, that the reduced density of large vessels evident in the macula has coevolved with mechanisms that guide axons away from the macula, keeping the nerve fiber layer of the macula region relatively thin, and favoring a clear optical path for light directed at the macular photoreceptor array.
Regulation of the actin cytoskeleton
Growth cone guidance is controlled by cues that influence actin cytoskeletal dynamics [33]. These regulatory genes function at the molecular level to adjust actin filament architecture within axonal growth cones and, with the assistance of microtubules, change the direction of axon growth [34, 35]. It is also likely that they assist with vascular guidance, given the similarity in the basic guidance mechanism of vasculature and neuronal growth cones [36]. A high representation of genes associated with regulation of actin cytoskeleton in the macula suggests an active and spatially regulated guidance function at midgestation. Because the majority of ganglion cells in the macula would have axons that have already reached the optic disk by midgestation, it seems likely that these cytoskeletal regulatory genes are mediating the development or refinement of neural and glial cell processes in the sample region or at the growing tips of retinal blood vessels on the peripheral margin of the macula biopsy.
Cell adhesion molecules
The functional significance of differential expression of cell adhesion molecules (CAMs) in the developing macula at midgestation is not clear. One possibility is that CAMs have a role in the formation and early maintenance of retinal circuits at this stage of development. In addition, we know that at midgestation retinal cells are displaced centripetally toward the incipient fovea. Prior to formation of the foveal depression at 25–27 WG, there is an increase in numerical density of cells in all retinal layers in the macula that results in a thickening of the retinal profile [15, 37–39], despite the opposing effect of retinal stretch which tends to spread cells across the retina as it grows [40]. One possible role for the CAMs may be to mediate adhesion of adjacent cells, resisting the effects of retinal stretch. The macula biopsy region may also include on its margin some axons from peripheral retina still navigating the optic nerve head and proximal optic nerve. It is possible, therefore, that to some degree the high levels of CAM expression we detect in the macula is also associated with axon outgrowth. During this phase, axons grow parallel to the retinal surface, along the inner limiting membrane formed by Müller cell processes, which are thought to have a role in guidance [41]. Once the pioneering axons have reached the choroidal fissure, which later forms the optic disk, future axons can also use the preformed “pioneer axons” as a guide, mediated by CAMs.
There are five main classes of CAMs, including cadherins, integrins, and immunoglobulin superfamily CAMs. The cadherins and integrins are highly represented among our macular genes of interest, while immunoglobulin-like genes appear as representatives of the immunoglobulin superfamily.
Cadherins
Cadherins are calcium-dependent, homophilic cell–cell adhesion molecules that regulate a range of morphogenetic processes, through association with adherens junctions and the actin cytoskeleton [42, 43]. Six classic cadherins are significantly differentially regulated in the macula—cadherins 2 and 6, which are downregulated, and 8, 12, 13, and 18, which are upregulated. One of these, cadherin-2 or NCAD, mediates tracking of retinal axons along pathways established by pioneer axons in the developing optic nerve [44, 45], but little is known about the role of other cadherins in the developing vertebrate visual system. For example, cadherin 6 expression has been detected in fetal zebra fish retina and is thought to contribute to retinal cell development [46], but little work has been done on the remaining cadherins in the retina (cadherin 8, 12, 13, 18) beyond measures of gene expression [47–50].
While cadherins are important contributors to central nervous system (CNS) development, there is a caveat to their high representation in the protein group clustering. A large number of protocadherins, a less well-studied subfamily of cadherins prominent in the central nervous system [43], are represented in the differential expression data. However, their prominence is exaggerated because the interrogated region is in the conserved cytoplasmic 3-exon region that is shared by all 22 members of the gamma subset of protocadherins [51] and is represented by only four probe sets (205717_x_at, 209079_x_at, 211066_x_at, 215836_s_at). Thus, all gamma protocadherin genes that appear in the InterPro cadherin cluster were unevenly interrogated by a small number of probe sets. The one probe set that interrogated a region outside the conserved region produced significant differential expression in the macula (probe set 1552735_at), interrogating a protocadherin gamma A4 (PCDHGA4) isoform precursor. Thirteen members of the alpha subset of protocadherins were also present in the InterPro cadherin cluster, but all 13 genes were interrogated by only one probe set (223435_s_at) probing the conserved cytoplasmic 3-exon region.
Integrins
Collagen genes as well as others associated with basal lamina, such as laminin [52], or extracellular matrix interacting proteins/proteoglycans, such as the CD44 family of isoforms [53], are prevalent in the KEGG pathway clusters “focal adhesion” and “ECM–receptor interaction.” These pathways are associated with cell–cell interaction and may be associated with extension of cell processes and the formation of cell–cell contacts or in neuronal cell packing, as alluded to above. Integrins are expressed by Müller cells [54] although little is known about their functions in this context. The differentially expressed genes include integrin subunits α2, α3, α6, β1, and β8, combinations of which include heterodimers that are receptors for laminin [55, 56].
Immunoglobulin superfamily
Immunoglobulin superfamily (IgSF) CAMs contain at least one Ig-like domain, constitute the largest family of CAMs, and are widely expressed in the developing and mature nervous system. Many also contain fibronectin type III (FNIII) repeats and are categorized based on domain number and organization [57]. The structure, function, and categories of IgSF CAMs are reviewed in Brümmendorf and Rathjen [58] and Walsh and Doherty [59]. IgSF CAMs that showed significant differential expression in the macula included DSCAM, CD47, CD58, CD80, EMB, as well as members of the subfamilies of contactins, ICAMs, NCAMs, IgLONs, and L1. The microarray data correctly reflect what is known about NCAM, an important and well-characterized molecule involved in cell growth and morphogenesis in the CNS [59]. A 21% downregulation was measured in the macula, and this is likely because of localized NCAM expression in type 1B astrocytes in fetal optic nerve head [60, 61] and which are likely to carry this expression into the retina, along with the retinal vessels, which are fewer in number in the macula. Given the large size and diverse range of functions of IgSF CAMs other than cell adhesion, such as synapse plasticity and axonal growth, guidance, and fasciculation, further investigation of the role these molecules play in retinal development is warranted.
Resource for emerging gene linkage studies
Genome-wide linkage or association studies seek to identify polymorphisms in genes that may be the root cause of a disease process or which may cluster with a few or several other genes and/or environmental factors to cause disease. Outstanding here are the linkage analyses associating a single nucleotide polymorphism in the gene encoding complement factor H with risk of developing age-related macular degeneration [62–64]. In that case, a gene that is widely expressed in a variety of tissues and which mediates a fundamental role in the innate immune response was implicated in the disease process. A large number of similar association studies are currently in progress in a variety of areas, which seek to identify genes associated with a range of ocular disorders, including myopia and glaucoma. Gene expression in the primate retina has not been widely investigated, and since the macula is a retinal specialization not present in the popular mouse models, data from this study provide a valuable resource, where the retinal expression patterns of disease-associated genes are not known.
References
Kozulin P, Natoli R, O’Brien KM, Madigan MC, Provis JM. Differential expression of anti-angiogenic factors and guidance genes in the developing macula. Mol Vis. 2009;15:45–59.
Adams DL, Horton JC. The representation of retinal blood vessels in primate striate cortex. J Neurosci. 2003;23:5984–97.
Engerman RL. Development of the macular circulation. Invest Ophthalmol. 1976;15:835–40.
Provis JM, Leech J, Diaz CM, Penfold PL, Stone J, Keshet E. Development of the human retinal vasculature: cellular relations and VEGF expression. Exp Eye Res. 1997;65:555–68.
Provis JM, Sandercoe T, Hendrickson AE. Astrocytes and blood vessels define the foveal rim during primate retinal development. Invest Ophthalmol Vis Sci. 2000;41:2827–36.
Provis JM, Hendrickson AE. The foveal avascular region of developing human retina. Arch Ophthalmol. 2008;126:507–11.
NCBI. Gene expression omnibus. http://www.ncbi.nlm.nih.gov/geo; 2009.
Silverman BW. Density estimation. London: Chapman and Hall; 1986.
Bernstein IH, Garbin CP, Teng GK. Applied multivariate analysis. New York: Springer; 1988.
Partek. Partek® documentation (user manual). St. Louis: Partek; 2008.
Pfaffl MW. A new mathematical model for relative quantification in real-time RT-PCR. Nucleic Acids Res. 2001;29:2002–7.
Dennis G Jr, Sherman BT, Hosack DA, Yang J, Gao W, Lane HC, et al. DAVID: Database for Annotation, Visualization, and Integrated Discovery. Genome Biol. 2003;4:P3. http://david.abcc.ncifcrf.gov.
Huang da W, Sherman BT, Lempicki RA. Systematic and integrative analysis of large gene lists using DAVID bioinformatics resources. Nat Protoc. 2009;4:44–57.
The Gene Ontology Consortium. Gene ontology: tool for the unification of biology. Nat Genet. 2000;25:25–9. http://www.geneontology.org.
Provis JM, van Driel D, Billson FA, Russell P. Development of the human retina: patterns of cell distribution and redistribution in the ganglion cell layer. J Comp Neurol. 1985;233:429–51.
Sandercoe TM, Madigan MC, Billson FA, Penfold PL, Provis JM. Astrocyte proliferation during development of the human retinal vasculature. Exp Eye Res. 1999;69:511–23.
Kanehisa M, Goto S. KEGG: Kyoto encyclopedia of genes and genomes. Nucleic Acids Res. 2000;28:27–30. http://www.kegg.com/kegg.
Hunter S, Apweiler R, Attwood TK, Bairoch A, Bateman A, Binns D, et al. InterPro: the integrative protein signature database. Nucleic Acids Res. 2009;37:D211–5. http://www.ebi.ac.uk/interpro.
Kozulin P, Natoli R, Madigan MC, O’Brien KMB, Provis JM. Gradients of Eph-A6 expression in primate retina suggest roles in both vascular and axon guidance. Mol Vis. 2009, in press.
Bernstein SL, Borst DE, Wong PW. Isolation of differentially expressed human fovea genes: candidates for macular disease. Mol Vis. 1995;1:4.
Bernstein SL, Borst DE, Neuder ME, Wong P. Characterization of a human fovea cDNA library and regional differential gene expression in the human retina. Genomics. 1996;32:301–8.
Bernstein SL, Wong P. Regional expression of disease-related genes in human and monkey retina. Mol Vis. 1998;4:24.
Sharon D, Blackshaw S, Cepko CL, Dryja TP. Profile of the genes expressed in the human peripheral retina, macula, and retinal pigment epithelium determined through serial analysis of gene expression (SAGE). Proc Natl Acad Sci U S A. 2002;99:315–20.
Yoshida S, Yashar BM, Hiriyanna S, Swaroop A. Microarray analysis of gene expression in the aging human retina. Invest Ophthalmol Vis Sci. 2002;43:2554–60.
Bowes Rickman C, Ebright JN, Zavodni ZJ, Yu L, Wang T, Daiger SP, et al. Defining the human macula transcriptome and candidate retinal disease genes using EyeSAGE. Invest Ophthalmol Vis Sci. 2006;47:2305–16.
Hornan DM, Peirson SN, Hardcastle AJ, Molday RS, Cheetham ME, Webster AR. Novel retinal and cone photoreceptor transcripts revealed by human macular expression profiling. Invest Ophthalmol Vis Sci. 2007;48:5388–96.
Curcio CE, Sloan KR, Kalina RE, Hendrickson A. Human photoreceptor topography. J Comp Neurol. 1990;292:497–523.
Provis JM, Penfold PL, Cornish EE, Sandercoe TM, Madigan MC. Anatomy and development of the macula: specialisation and the vulnerability to macular degeneration. Clin Exp Optom. 2005;88:269–81.
Yu DY, Cringle SJ, Su EN. Intraretinal oxygen distribution in the monkey retina and the response to systemic hyperoxia. Invest Ophthalmol Vis Sci. 2005;46:4728–33.
Yu PK, Balaratnasingam C, Morgan WH, Cringle SJ, McAllister IL, Yu DY. The structural relationship between the microvasculature, neurons and glia in the human retina. Invest Ophthalmol Vis Sci. 2009. doi:10.1167/iovs.09-3978
Gelfand MV, Hong S, Gu C. Guidance from above: common cues direct distinct signaling outcomes in vascular and neural patterning. Trends Cell Biol. 2009;19:99–110.
Pfeiffenberger C, Cutforth T, Woods G, Yamada J, Renteria RC, Copenhagen DR, et al. Ephrin-As and neural activity are required for eye-specific patterning during retinogeniculate mapping. Nat Neurosci. 2005;8:1022–7.
Dickson BJ. Molecular mechanisms of axon guidance. Science. 2002;298:1959–64.
Okabe S, Hirokawa N. Actin dynamics in growth cones. J Neurosci. 1991;11:1918–29.
Tanaka E, Sabry J. Making the connection: cytoskeletal rearrangements during growth cone guidance. Cell. 1995;83:171–6.
Gerhardt H, Golding M, Fruttiger M, Ruhrberg C, Lundkvist A, Abramsson A, et al. VEGF guides angiogenic sprouting utilizing endothelial tip cell filopodia. J Cell Biol. 2003;161:1163–77.
Cornish EE, Hendrickson AE, Provis JM. Distribution of short-wavelength-sensitive cones in human fetal and postnatal retina: early development of spatial order and density profiles. Vision Res. 2004;44:2019–26.
Cornish EE, Madigan MC, Natoli R, Hales A, Hendrickson AE, Provis JM. Gradients of cone differentiation and FGF expression during development of the foveal depression in macaque retina. Vis Neurosci. 2005;22:447–59.
Hendrickson A, Provis JM. Comparison of development of the primate fovea centralis with peripheral retina. In: Sernagor E, Eglen S, Harris B, Wong R, editors. Retinal development. Cambridge: Cambridge University Press; 2006. p. 126–49.
Provis JM, Diaz CM, Dreher B. Ontogeny of the primate fovea: a central issue in retinal development. Prog Neurobiol. 1998;54:549–80.
Stuermer CA, Bastmeyer M. The retinal axon’s pathfinding to the optic disk. Prog Neurobiol. 2000;62:197–214.
Yagi T, Takeichi M. Cadherin superfamily genes: functions, genomic organization, and neurologic diversity. Genes Dev. 2000;14:1169–80.
Gumbiner BM. Regulation of cadherin-mediated adhesion in morphogenesis. Nat Rev Mol Cell Biol. 2005;6:622–34.
Matsunaga M, Hatta K, Nagafuchi A, Takeichi M. Guidance of optic nerve fibres by N-cadherin adhesion molecules. Nature. 1988;334:62–4.
Redies C, Takeichi M. N- and R-cadherin expression in the optic nerve of the chicken embryo. Glia. 1993;8:161–71.
Liu Q, Londraville R, Marrs JA, Wilson AL, Mbimba T, Murakami T, et al. Cadherin-6 function in zebra fish retinal development. Dev Neurobiol. 2008;68:1107–22.
Miskevich F, Zhu Y, Ranscht B, Sanes JR. Expression of multiple cadherins and catenins in the chick optic tectum. Mol Cell Neurosci. 1998;12:240–55.
Faulkner-Jones BE, Godinho LN, Tan SS. Multiple cadherin mRNA expression and developmental regulation of a novel cadherin in the developing mouse eye. Exp Neurol. 1999;156:316–25.
Aijaz S, Allen J, Tregidgo R, van Heyningen V, Hanson I, Clark BJ. Expression analysis of SIX3 and SIX6 in human tissues reveals differences in expression and a novel correlation between the expression of SIX3 and the genes encoding isocitrate dehydrogenase and cadherin 18. Genomics. 2005;86:86–99.
Rizzolo LJ, Chen X, Weitzman M, Sun R, Zhang H. Analysis of the RPE transcriptome reveals dynamic changes during the development of the outer blood–retinal barrier. Mol Vis. 2007;13:1259–73.
Wu Q, Maniatis T. Large exons encoding multiple ectodomains are a characteristic feature of protocadherin genes. Proc Natl Acad Sci U S A. 2000;97:3124–9.
Martin GR, Timpl R. Laminin and other basement membrane components. Annu Rev Cell Biol. 1987;3:57–85.
Culty M, Miyake K, Kincade PW, Sikorski E, Butcher EC, Underhill C. The hyaluronate receptor is a member of the CD44 (H-CAM) family of cell surface glycoproteins. J Cell Biol. 1990;111:2765–74.
Guidry C, Bradley KM, King JL. Tractional force generation by human Müller cells: growth factor responsiveness and integrin receptor involvement. Invest Ophthalmol Vis Sci. 2003;44:1355–63.
Gehlsen KR, Dickerson K, Argraves WS, Engvall E, Ruoslahti E. Subunit structure of a laminin-binding integrin and localization of its binding site on laminin. J Biol Chem. 1989;264:19034–8.
Hall DE, Reichardt LF, Crowley E, Holley B, Moezzi H, Sonnenberg A, et al. The alpha 1/beta 1 and alpha 6/beta 1 integrin heterodimers mediate cell attachment to distinct sites on laminin. J Cell Biol. 1990;110:2175–84.
Fusaoka E, Inoue T, Mineta K, Agata K, Takeuchi K. Structure and function of primitive immunoglobulin superfamily neural cell adhesion molecules: a lesson from studies on planarian. Genes Cells. 2006;11:541–55.
Brümmendorf T, Rathjen FG. Cell adhesion molecules 1: immunoglobulin superfamily. Protein Profile. 1995;2:963–1108.
Walsh FS, Doherty P. Neural cell adhesion molecules of the immunoglobulin superfamily: role in axon growth and guidance. Annu Rev Cell Dev Biol. 1997;13:425–56.
Ye H, Hernandez MR. Heterogeneity of astrocytes in human optic nerve head. J Comp Neurol. 1995;362:441–52.
Kobayashi S, Vidal I, Pena JD, Hernandez MR. Expression of neural cell adhesion molecule (NCAM) characterizes a subpopulation of type 1 astrocytes in human optic nerve head. Glia. 1997;20:262–73.
Hageman GS, Anderson DH, Johnson LV, Hancox LS, Taiber AJ, Hardisty LI, et al. A common haplotype in the complement regulatory gene factor H (HF1/CFH) predisposes individuals to age-related macular degeneration. Proc Natl Acad Sci U S A. 2005;102:7227–32.
Haines JL, Hauser MA, Schmidt S, Scott WK, Olson LM, Gallins P, et al. Complement factor H variant increases the risk of age-related macular degeneration. Science. 2005;308:419–21.
Klein RJ, Zeiss C, Chew EY, Tsai JY, Sackler RS, Haynes C, et al. Complement factor H polymorphism in age-related macular degeneration. Science. 2005;308:385–9.
Acknowledgments
The authors thank Dr. Riccardo Natoli for his excellent technical advice and Dr. Tancred Frickey for his help in carrying out the signal intensity analysis. We acknowledge the Biomolecular Resource Facility of the John Curtin School of Medical Research, The Australian National University, for their role in the hybridizations and reading of the microarrays. The study was supported by the Ophthalmic Research Institute of Australia and the Australian Research Council Centers of Excellence Program (CE0561903). We also thank the tissue coordinators and human tissue donors, without whose cooperation these studies would not be possible.
Open Access
This article is distributed under the terms of the Creative Commons Attribution Noncommercial License which permits any noncommercial use, distribution, and reproduction in any medium, provided the original author(s) and source are credited.
Author information
Authors and Affiliations
Corresponding author
Rights and permissions
Open Access This is an open access article distributed under the terms of the Creative Commons Attribution Noncommercial License (https://creativecommons.org/licenses/by-nc/2.0), which permits any noncommercial use, distribution, and reproduction in any medium, provided the original author(s) and source are credited.
About this article
Cite this article
Kozulin, P., Provis, J.M. Differential gene expression in the developing human macula: microarray analysis using rare tissue samples. j ocul biol dis inform 2, 176–189 (2009). https://doi.org/10.1007/s12177-009-9039-1
Received:
Accepted:
Published:
Issue Date:
DOI: https://doi.org/10.1007/s12177-009-9039-1