
Abstract
GRIDA3 (Shared Resources Manager for Environmental Data Analysis and Applications) is a multidisciplinary project designed to deliver an integrated system to forge solutions to some environmental challenges such as the constant increase of polluted sites, the sustainability of natural resources usage and the forecast of extreme meteorological events. The GRIDA3 portal is mainly based on Web 2.0 technologies and EnginFrame framework. The portal, now at an advanced stage of development, provides end-users with intuitive Web-interfaces and tools that simplify job submission to the underneath computing resources. The framework manages the user authentication and authorization, then controls the action and job execution into the grid computing environment, collects the results and transforms them into an useful format on the client side. The GRIDA3 Portal framework will provide a problem-solving platform allowing, through appropriate access policies, the integration and the sharing of skills, resources and tools located at multiple sites across federated domains.
Introduction
Some leading challenges of environmental sciences are: sustainable use of natural resources; environmental pollution and degradation; forecast of extreme meteorological events; tapping new non-renewable sources of energy. They require computing power, sensing devices and storage capacity that a single organization, public or private, hardly might acquire. E-science, i.e. the systematic development of research methods that exploit advances in Information and Communication Technologies (ICT) to enable better research (Atkinson et al. 2008), can be seen as the combination of three different features: the large-scale sharing of computational resources, the provision of access to massive, distributed and heterogeneous datasets (in the order of Tera to Petabytes) and the use of digital platforms for collaboration and communication (Wouters 2004).
According to the definitions given by Kesselman and Foster (2001), grid computing is a kind of coordinated resource sharing (data, hardware, application) and problem solving, across active and geographically dispersed, multi-institutional virtual organizations. In general, e-science and grid technology promise to change the way organizations deals with complex computational problems. Unfortunately, the vision of large scale resource sharing is not yet a reality in many areas. Grid computing is an evolving area of computing, where standards and technology are still being developed to enable this new paradigm.
GRIDA3, a shared resources manager for environmental data analysis and applications (http://grida3.crs4.it), is a multidisciplinary project whose framework—EnginFrame—is designed to deliver, through the use of distributed computing and datagrid technologies, an integrated system to support the solution of a variety of environmental issues.
The main technological objectives of the framework are:
-
the adoption of the paradigm of distributed information system made up of acquisition devices, database and software for simulation, data management and visualization;
-
the supply of a wide area virtual organization system in support of involved institutions, for the coordinated and reliable sharing of computing resources and data, both from literature and from data acquisition surveys, and sharing of innovative numerical applications;
-
the provision of a uniform, transparent, easy and yet protected access to all available resources.
The final project result will be an advanced problem-solving platform allowing the integration of human know-how, simulation and visualization software, instrumentation and high performance resources for data communication, storage, and computation via a Web portal.
GRIDA3 is developed to deliver services to a wide range of users from decision makers without technological expertise to technical and scientific experts.
The users can access, set up, run, and control ready-made applications on GRIDA3 computing resources via a standard compliant Web interface, virtually from anywhere using a Web browser.
The grid-enabled Web applications currently under development span over five domains:
-
AGISGRID, dealing with the development of a series of applications based on GIS (Geographic Information System) technologies;
-
AQUAGRID, focused on subsurface hydrology and water resources management;
-
BONGRID, related to remediation and monitoring of contaminated sites;
-
EIAGRID, aimed to enable geophysicists to perform a real-time subsurface characterization by an on-the-fly seismic data processing (e.g. applied to hydrogeological research);
-
PREMIAGRID, centred on the implementation of a probabilistic system in order to forecast extreme events.
Each tool was implemented using previously developed stand alone applications which performed for each field the required computation and provided solutions on a specific area. Such applications have been ported within the framework, namely the grid portal, thus shifting the user interaction from desktop oriented to Web based paradigm fostering user participation.
The next section describes the enabling technologies which allowed us to build GRIDA3, and the following one is dedicated to a detailed description of each environmental application deployed on the portal. Finally, the conclusions from completed tasks and future developments are discussed in the last section.
GRIDA3 infrastructure
The GRIDA3 infrastructure comprises a complex set of technologies structured in a four-layer system architecture (Fig. 1), completely transparent to end-users.

Multi-tier architecture of the GRIDA3 infrastucture
The lowest level infrastructure provides the computing, the storage, net connections, and the basic services systems, all shown in Fig. 2.

Hardware infrastructure
The computing system, currently under test, guarantees a low latency grid with 32 nodes (able to reach 1.1 Tflops performance), connected at 2Gbps and using IPMI (Intelligent Platform Management Interface) (Hewlett Packard 1998) to allow node re-configuration. The high speed storage, based on a distributed file system, is directly connected to the grid, sharing the same network switch. The backup and snapshot management are provided by a medium speed storage. Basic services consist of user authentication and authorization (LDAP—Lightweight Directory Access Protocol), Web servers (Apache HTTP Server and Apache Tomcat), security (DMZ—DeMilitarized Zone and firewalls).
The second level is the grid management. The GRIDA3 portal is based on the EnginFrame framework, which is available through a proprietary licence, except for the academic and research worlds that have free of charges licence (http://www.enginframe.com/docum/). The main building block of EnginFrame is the service, based on an XML (eXtensible Mark-up Language) (Goldfarb and Prescod 2000) representation of any computing related facility (e.g. a Finite Element Model (FEM) solver, a parallel Computational Fluid Dynamics (CFD) solver, a query to Load Sharing Facility (LSF) to find pending jobs).
The use of XML allows the decoupling of EnginFrame from the current grid environment, hiding the specific grid technology solution (Beltrame et al. 2006).
EnginFrame (Fig. 3) offers a user-friendly layout that allows the end user to access distributed computing and storage resources through all kind of appliances (desktop, laptop, mobile phone) using Web browsers, to provide the same Graphic User Interface (GUI) to several back-ends, and to ensure security at all levels.

Components of EnginFrame
The architecture of EnginFrame is logically divided into three tiers:
-
Client Tier, user’s browser and application software;
-
Server Tier, built on top of APACHE/TOMCAT servlet-enabled Web server for supporting Java server-side operations. This tier manages client-server interactions (as authentication, data management, job submission, job tracking, output rendering and delivering) and server-resources interactions (as Web services use, responding to user’s actions, performing resource brokering, managing integration of data and services from different services and resources);
-
Resource Tier, where a number of “Agents” manages computing resources on behalf of users, interacting with the underlying Operating System or Job Scheduler, and translating the user’s clicks on a Web page into actions such as ‘start job’, ‘move data’, ‘show host load’, etc, extensively using XML for service definition.
The EnginFrame grid portal runs on Apache Tomcat and provides the framework to develop and deploy the GRIDA3 applications; it separates the presentation of the services composing the applications from the grid-enabled business logic (back-end). The back-end is built with a set of modular plug-ins able to support the most common developers needs complementing them with a set of Web-based widgets. In GRIDA3, the main plug-ins are the authentication-authorization module relying on LDAP and the management of jobs submitted to the grid relying on LSF (Load Sharing Facility).
The authorization system provides fine grained access control and flexible profiling, the authentication system provides session level single sign-on across multiple services. After authentication EnginFrame drives the action and job execution into the grid computing environment, then collects the results and transforms them into an appropriate format useful to the client. When jobs are terminated, results are staged in the EnginFrame spooler area, a file system scratch area where data are made available through the browser for visualization, postprocessing, or download.
Most of the information managed by EnginFrame is described by dynamically generated XML documents. Servers generate content in form of HTTP code for the client browser and monitor resource activities in the back-end. To allow access to interactive or batch applications EnginFrame is compatible with X-protocol LAN environment. The interaction of the user with the application PREMIAGRID is depicted as example in Fig. 4.

four steps of the user interaction with the application PREMIAGRID
Accessing the GRIDA3 Webpage a registered end-user, for each application, can:
-
log on in the Web site generated by the EnginFrame Server, which means being authenticated and authorized to access and use computing and storage resources;
-
browse service offerings and related information as on a normal Web site;
-
select services from the left side frame;
-
interact with the selected application (e.g. upload data from remote, insert parameters, select input files, submit jobs, monitor job and computing resources status) as shown in Fig. 4a. Specified parameters are passed to the resources as environment variables;
-
monitor the job execution workflow, status (Fig. 4b), and cluster load (Fig. 4d);
-
get output (Fig. 4c). After the service is executed, the results are collected and delivered to the user on a private spooler zone which allows browsing and downloading output files.
The quantity of data items and their placement at the data owner sites together with CRS4 expertise on Data-grid coming from the creation of the DatacroSSIng (DSS) portal (Manca et al. 2004) brought us to use SRB (Storage Resource Broker) (Rajasekar et al. 2003) for data virtualization of the grid federation system. SRB is a middleware giving a uniform interface to share, copy, synchronize, and store heterogeneous data on a distributed system. The data retrieval is based on data attributes and the user does not have to care where the data item is stored and how it is retrieved. Our confidence about the coupling of SRB and EnginFrame is based on a previous successful experience (Beltrame et al. 2006).
The third level is the applications level (Fig. 1). This level contains a set of scripts as well as algorithms to run different applications. The features of each application are fully described in the next sections.
The fourth and last level is focusing on the Web user interaction. The complex technologies below are completely transparent to end-users; this feature is realized thanks to Web interfaces tailored to end-users that access and control their computing and engineering resources via intuitive Web2.0 interfaces, virtually from any device using a standard Web browser (e.g. desktop, laptop, PDA or smartphone).
This also holds for users with neither specific expertise of physical models nor technological background. “Web2.0” refers to the second generation of Web-based communities and services, giving the Web developers the capability to realize graphical interfaces with the same level of interactivity as desktop applications and create mash-ups using services provided in the Web by third parties. A mash-up is a Web application that combines data from more than one source into a single integrated toolFootnote 1 (Blake and Nowlan 2008). The GRIDA3 framework integrates Google Maps and GeoNamesFootnote 2 services. Embedding Google Maps makes it possible to manipulate points of interest, add content and overlap sub-layers. For instance, in the AQUAGRID-PHREEQC application the user can obtain geographical coordinates of the water sample to insert into the database, just by clicking on the map.
The structure of the currently displayed Web page (Fig. 4) is completely accessible and can be modified on-the-fly by the command processing performed directly by the browser without any server request for new pages. On the other hand, the server interaction takes advantage from the Asynchronous JavaScript and XML (AJAX) paradigm. A browser utility creates JavaScript functions sending requests to services exposed by the same server where the Web page has been downloaded. The response of an AJAX request ranges from a simple URI to a block of XML/HTML, from JSON data to a JavaScript code.
Project results
Porting the five applications to the grid via the portal framework is an interesting challenge in front of the already stable conception of desktop stand alone oriented software. The already living experiences has been gone over in order to fit on the Web design. When moving the applications to the Web and in particular to the EnginFrame framework it is necessary to think on different aspects, which were less important in the past implementation. No changes were needed in the core of each application. In fact most of the attention was dedicated to user interaction, participation, needs, etc. bringing us to focus on user profiling and to identify user categories. This concept drove the application development adding new functionalities and enlarging the required framework features to make them cross-usable (e.g. Mapserver, msCross (Manca et al. 2006), PostgreSQL). For instance, it is important to think the application considering different user experience levels such as guest users, basic, experts, etc. Such considerations impact on the design of user interfaces, more and more affected by the sequences of transactions the user might perform, by the allowed actions for each category of users, by the type of input/output data.
GUI and EnginFrame developers wrote XML scripts to describe and implement all these applications: actions in the XML file call external shell scripts written by application developers in several languages as XML, Perl, shell or Java through which input parameters are read and commands related to the requested service are executed.
For customizing more complex services the XML file calls auxiliary Java files that define specific features like including descriptive figures into the input parameter fields, choosing dates from a pop-up calendar, or displaying a progress bar for file uploading.
The integration of LSF middleware for job management was carried out by including LSF commands into the executable instructions. Using LSF under EnginFrame enables useful features such as displaying the job evolution or cluster load directly in the browser.
The quality of the framework was obviously improved because of the expertise gained during the plugging of the tool in a specific field like earth sciences is. More over some features requested by application porting has been integrated in Enginframe.
AGISGRID deployment
The aim of AGISGRID (http://grida3.crs4.it/enginframe/agisgrid/index.xml) is to provide authorized users the access to environmental databases and applications based on GIS technologies. AGISGRID is dedicated to support public and private users, such as local administrations and universities, about land planning and addressing the localization of specific environmental problems.
Apart from SRB and EnginFrame, the AGISGRID enabling technologies are:
-
GRASS (Neteler and Mitasova2002), a Free Software/Open Source GIS released under GNU license (General Public License—Smith 2007) used to build and run the codes for the specific applications;
-
PostgreSQL (PostgreSQL Global Development Group 2007), a Free Software/Open-Source object-relational database system that has the features of traditional commercial database systems with enhancements to be found in next-generation DBMS systems. Here it is used to store the soil and geochemical database;
-
Mapserver (Kropla 2005) to visualize the outputs of the applications execution.
AGISGRID has three different sub-applications, described in the next paragraphs: Land Suitability (Fig. 5), Georesources and Environmental Geochemistry and Desertification Risk Assessment.

Mapserver visualization of the application output: fitness of Monastir area for vineyard use
Land suitability
The aim of this application is to contribute to the prevention and mitigation of soil degradation effects that in Sardinia, as well as in other Mediterranean areas, are mainly caused by anthropogenic factors (mostly agriculture, forestry and pastoral activities, industrial activity, and urbanization) (Vacca et al. 2002). A case study of the Land Suitability application is given in Fig. 5.
This application allows the evaluation of the fitness of a given type of land for a defined use, according to the FAO framework (FAO 1976). Moreover, it has the benefit of being simple and easily understandable for the land planning makers, identified as the main users of the application. The application produces suitability maps for 11 alternative uses: agriculture, vineyards, cereals, horticulture, citrus fruit growing, pasture improvement on four different parent materials, housing, industrial and commercial building. The cross analysis of the produced suitability maps allows the user to easily denote the most suitable uses for each under-study land unit. As a consequence, this analysis may be useful to direct municipal urban planning towards a rational land use, e.g. protecting the prime agricultural soils from urban and industrial expansion.
Georesources and environmental geochemistry
At present, stream sediments are one of the most common investigation tools of environmental geochemistry. Their relevance is mainly due to their composite nature and origin, in fact they may be considered representative of mean geochemical characteristics of lithologies outcropping inside the hydrographical basin relative to sampling point; furthermore, many chemical compounds and elements tend to concentrate on the finest sediments, like stream sediments (Salminen et al. 2005). The Sardinian stream sediments dataset is made of over 33 k samples.
For a certain area, this application achieves the automatic identification of some heavy metals natural anomalies through four steps:
-
implementation of a high-resolution Digital Elevation Model (DEM), a digital representation of ground surface topography, for the morphological definition of area of interest;
-
automatic reconstruction of the hydrography for the settlement of river basins underlying the point of sampling;
-
identification of the background for each element through geostatistical analysis and of any lithology in the considered area, providing lithological data are available;
-
definition of anomalies at different scales.
This work would provide decision makers a tool for planning the regional areas.
Desertification risk assessment
This is an application based on ESAs (Environmentally Sensitive Areas) methodology (Kosmas et al. 1999). To obtain the ESAs Desertification Index (ESA_DI), four quality maps must be produced: Soil Quality Index (SQI), Climate Quality Index (CQI), Vegetation Quality Index (VQI) and Management Quality Index (MQI). Combining the above mentioned geographic layers in a formula
the resulting output is a map showing critical, fragile, and potential Environmentally Sensitive Areas to desertification. The Quality Index maps and the final ESAs map can be really useful to direct land planning at catchment basin scale.
AQUAGRID deployment
AQUAGRID (http://grida3.crs4.it/enginframe/aquagrid/index.xml) is a computational service for subsurface hydrology and water resources management.
It is based on two different modules:
-
the CODESA-3D module focused on groundwater modelling and contaminant transport;
-
the PHREEQC module related to geochemical data analysis and interpretation.
The AQUAGRID application allows registered end-users to execute a set of services related to some pilot sites by simply selecting them on a Google Maps (Lecca et al. 2007). Its main objective is to provide an instrument to foster the quality of freshwater resource management, especially in coastal regions and in abandoned mines.
This service targets researchers, water managers and decision makers, helping them to find solutions to problems like the planning and management of optimal aquifer development and exploitation schemes, the design of operative monitoring networks, and the selection of the most effective remediation modus operandi.
CODESA-3D module
Based on the CODESA-3D hydrogeological model, this module aims to simulate complex and large density-dependent groundwater flow and contaminant transport problems in aquifer systems (Lecca 2000).
Probabilistic techniques based on Montecarlo methods are implemented in order to assess and quantify the impact of input uncertainty connected with field-data into the output of the model.
Two different pilot case studies, respectively located in Sardinia (Oristano aquifer) and Tunisia (Korba aquifer), are deployed. Authorized end-users can choose the case study by simply selecting the marker on a Google Maps, then they can check the job status while running and the process output text files and images when finished. The implemented workflow is shown in Fig. 6, and its enabling technologies include:
-
CODESA-3D, a three-dimensional finite element simulator for coupled groundwater flow and solute transport in variably saturated porous media on unstructured domains;
-
PEST (Doherty 2002), a nonlinear parameter estimation package that can be used to estimate parameters for about any existing computer model, whether or not a user has access to the model’s source code;
-
PARAVIEW (Henderson 2004), an Open-Source, multi-platform application designed for 2D-3D visualization of data sets varying from small to very large size;

Workflow of AQUAGRID CODESA-3D module
PHREEQC module
The second module of AQUAGRID provides the user several tools to carry on geochemical simulations based on field campaigns conducted by the Department of Earth Sciences of Cagliari University.
Using a combobox menu the user selects the case study to submit. Each case study is composed by several groundwater samples. The selection dynamically loads the georeferenced locations of the corresponding samples on a Google Maps mashup. Just highlighting by a mouse click each sample the user is allowed to inspect its basic sample metadata (name, date, etc) in the framed box located below the map (Fig. 7). Finally, by pushing the submit button the selected data are forwarded to the server side of the application and the server launches the simulation of speciation for the whole set of samples, with the selected output option allowing to collect the synthetic results relevant to the analysis in a single file. After the job completion, the user can see input and output results as text files and graphs and download them (Fanfani et al. 2008). A further Web form is provided wherein the user can insert values of water samples in order to create his own case study.

GUI of AQUAGRID-PRHREEQC application, with code details into the black window
The enabling technologies of the second module are:
-
POSTGRESQL (PostgreSQL Global Development Group 2007), already described in AGISGRID application paragraph;
-
PHREEQC (Parkhurst 1995), a C program designed to perform a wide variety of low-temperature aqueous geochemical calculations. PHREEQC, based on an ion-association aqueous model, can calculate speciation and saturation-indices, batch-reaction, inverse modelling, one-dimensional transport involving reversible and irreversible reactions;
-
XMGRACE (Grace 2008), a 2D plotting tool for the X Window System and M*tif that runs on virtually any version of Unix-like OS. In AQUAGRID it is used to plot binary e ternary graphs for input and output data.
BONGRID deployment
BONGRID (http://grida3.crs4.it/enginframe/bongrid/index.xml) is a site-remediation service oriented towards all potential stakeholders (engineers or decision makers) providing them tools to solve concerns in the contaminated soil and groundwater remediation field.
Health consequences from exposure to soil and groundwater contamination may include carcinogenic effects, developmental damage to the brain and nervous system, liver diseases, gastrointestinal pathologies, etc. In addition, soil and groundwater contamination may adversely affect soil ecology, agricultural production, or product and water quality. In order to avoid such hazards, strong efforts should be made to develop remediation techniques of contaminated soils and groundwater. For this reason the development of economically feasible remediation technologies represents a very interesting technological and scientific issue. BONGRID activities are aimed to the use of mathematical models to assist the decision makers in the choice of the most suitable remediation technique as shown in Fig. 8. The BONGRID application, which is strictly linked with AQUAGRID being the natural conclusive step of a groundwater remediation plan as shown in Fig. 9, is focused on the implementation of a grid-enabled demonstrative application for the simulation, optimization, and effective design of contaminated groundwater remediation techniques based on the use of adsorption units. In particular, the performance of natural zeolite-bearing materials packed beds for the remediation of heavy metal contaminated groundwater may be simulated by the BONGRID application when different operating conditions are considered.

Typical workflow of a GRIDA3 remediation procedure

Five steps implemented remediation process
The BONGRID module is based on an isothermal heterogeneous axial-dispersion model, where parallel pore and surface diffusion is considered to take place in spherical and uniformly sized adsorbent particles. Local equilibrium between pore fluid and adsorbent surface is also assumed.
The BONGRID code involves a non linear Partial Differential Equations (PDE) system which is converted into a set of ordinary differential equations at the internal node points by means of the “method of lines” that takes advantage of a central finite difference scheme for the spatial derivatives. The resulting Ordinary Differential Equations (ODE) system is integrated numerically as an initial value problem by using Gear’s method. The BONGRID application allows registered users to run, on a high performance cluster of PCs, a set of computational codes in which different operating conditions of the packed bed may be considered, thus performing single simulations or sensitivity analyses. Through an user friendly interface, the user may input column size, pollutant concentration, liquid flow value, zeolite granulometry, bed void fraction, process time, and then submit the jobs. Once the computation is over, the user may access results and evaluate the effects of the used set of operating conditions on the packed bed performance. The effect of bed void fraction variation (Fig. 10) is reported in terms of lead concentration as a function of time in the outlet stream, on the performance of a column employed for the remediation of lead contaminated groundwater. When compared to the sequential job, the use of a grid architecture allows the user to simultaneously submit different jobs using different values of operating conditions.

Effect of bed void fraction variation, in terms of lead concentration as a function of time in the outlet stream
In this way the choice of the optimal operating conditions may be performed in shorter time. Moreover, by employing suitable optimization procedures, the code allows the design of adsorption columns as a function of the desired contaminant removal yield and rate. Work along these lines is currently in progress.
EIAGRID deployment
Seismic reflection profiling has a broad spectrum of applications ranging from shallow targets of a few meters depth to targets with a depth of several kilometers. Nevertheless, it is primarily used by the hydrocarbon industry since the complexity of data acquisition and processing poses severe problems for environmental and geotechnical engineering. Professional seismic processing software is expensive and demands large experience from the user. Furthermore, in-field processing equipment that could be used for instant data Quality Control (QC) and subsequent optimization of the acquisition parameters is often not available for this kind of studies. Thus, in many cases the data quality will be suboptimal.
The EIAGRID portal (http://grida3.crs4.it/enginframe/eiagrid/index.xml) provides an innovative solution to this problem combining state-of-the-art processing methods and modern remote grid computing technology. In field-processing equipment is substituted by remote access to high performance grid computing facilities that can be ubiquitously controlled by a user-friendly Web-browser interface and wireless data transmission technology.
The principal services of EIAGRID are:
-
(a)
seismic data uploading, format conversion, and storage;
-
(b)
management of projects, containing data, processing work-flow, and results;
-
(c)
seismic data visualization, preprocessing, and subsurface imaging.
The complexity of data-manipulation and processing and thus also time demanding user interaction is minimized using a highly automated data-driven velocity analysis and an imaging approach based on the Common-Reflection-Surface (CRS) stack (Jäger et al. 2002), (Heilmann 2007).
Furthermore, the huge computing power provided by the grid deployment allows parallel testing of alternative parameter settings and processing sequences and parameter settings to speed-up the unavoidable trial-and-error process otherwise carried out in a time-consuming sequential manner. The GRIDA3 framework offers all features that are essential for seismic data management and processing: multiple or single data-file uploading, input parameter consistence control, checking of job status during the calculus, visualization, storing, sharing and downloading of results.
The fundamental steps of the presented application are depicted in Fig. 11.

EIAGRID service: data acquisition, raw data upload, remote grid processing, and download the of processed images
Data acquisition and upload
A typical seismic 2D survey is carried out by applying a multitude of so-called common-shot experiments. This EIAGRID service allows to upload the recorded data to the remote computing facilities immediately after each shot.
This is done via wireless data transmission using a Web-based GUI. In this way a single shot-gather or the complete range of shots can be preprocessed and visualized while the acquisition still takes place. For the wireless data transmission high speed protocols such as EDGE (Enhanced Data Rates for GSM Evolution), UMTS (Universal Mobile Telecommunications System), or HSUPA/HSDPA (High-Speed Uplink/Downlink Packet Access) are required, particularly for the raw data upload (for a comprehensive overview see, e. g., Yacoub 2001, Halonen et al. 2003; Rysavy Research 2008). After a certain amount of data is collected, the uploaded shot-gathers are concatenated on the server and, within a few minutes, a preliminary subsurface image is produced.
Data visualization and preprocessing
For data visualization and preprocessing we chose the free software package Seismic Un*x (SU) provided by the Colorado School of Mines (Cohen and Stockwell 2000). This package features a multitude of data visualization, manipulation, and processing tools that are applied via command line in a UNIX like manner. We included a small subset of these tools with a customized choice of options into the EIAGRID GUI. In this way a technician without any experience in SU can perform basic preprocessing steps from any hardware configuration that supports a Web-browser.
CRS stack and migration
The CRS theory provides a framework to derive a formula approximating the time of flight of signals traveling in a heterogeneous 2D medium. Stacking is applied in a data-driven manner: for each sample of the Zero-Offset (ZO) section three physically interpretable stacking parameters are determined from the seismic signals by means of a data-driven optimization loop as depicted in Fig. 12.

Data-driven stacking parameter determination. Each set of stacking parameters le within a given search range defines a hypothetical second-order reflection response. The optimum parameter set maximizes the coherence between this prediction and the actually measured data
As a result, neither manual picking in velocity spectra nor a priori information concerning the unknown macro-velocity model are required. The stacked ZO section obtained for a test data set acquired in the Flumendosa River Delta, Sardinia (Italy), is depicted in Fig. 13a. The stacking parameter sections (picture omited) were used for CRS-based residual static correction (Koglin et al. 2006) to build a time migration velocity model and to define optimum migration apertures (Spinner 2007). By this means, user interaction is reduced and imaging errors due to a wrong choice of processing parameters are prevented. A result of the limited aperture Kirchhoff time migration scheme is depicted in Fig. 13b. A newly developed georeferencing tool will soon allow to correlate these results with georeferenced data from other applications.

a CRS stacked zero-offset section and b Prestack time migration result, both generated from an environmental data set recorded close to Muravera in the South-East of Sardinia (see also Deidda et al. 2006)
PREMIAGRID deployment
PREMIAGRID (http://grida3.crs4.it/enginframe/premiagrid) aims at the implementation of a grid-enabled Web demonstrative application focused on meteorological modelling. More specifically, the main goal is the implementation of an eight-member ensemble made up of three mesoscale models: Bolam (Buzzi et al. 1994), MM5 (Grell et al. 1994), RAMS (Pielke et al. 1992), the last one used twice with different setups. All of them can be fed with two sets of boundary and initial conditions originating from ECMWF (European Centre for Medium-Range Weather Forecasts, UK) and NCEP (National Centers for Environmental Prediction, USA). The results from the runs are accessible in various numerical or graphical formats through a user friendly Web portal.
The multi-model multi-analysis approach is a relatively new method in the limited area ensemble meteorological forecast: the single deterministic forecasts can be combined using specific techniques to get a probabilistic forecast (Palmer 1993), and thus to estimate the probability of certain events to develop. An assessment of the probabilistic skill of the PREMIAGRID ensemble has already been addressed and a detailed discussion of the results can be found in (Marrocu and Chessa 2008).
The PREMIAGRID application involves the implementation of a complex pipeline whose main items can be summarized as follow:
-
data from the ECMWF and NCEP global models are downloaded using crontab scripts at four synoptic hours (00,06,12,18 UMT) and stored locally in a dedicated database;
-
these data are then passed to the pre-processing module that generates for each of the ensemble members the proper initial and boundary conditions;
-
from this point each of the eight model-configurations can be run and the output results are post-processed to get eight different forecasts;
-
these individual deterministic forecasts are then combined using appropriate post-processing techniques to get a probabilistic forecast;
-
at the end of the computation, the results of the eight deterministic forecasts and the ensemble post-processing techniques are shown automatically on the Web page in graphical form. Figure 14 shows the geopotential height at the 500mb pressure level as an example. The model output data can be also accessed and downloaded in different binary formats by authorized users with the appropriate credentials.
Fig. 14 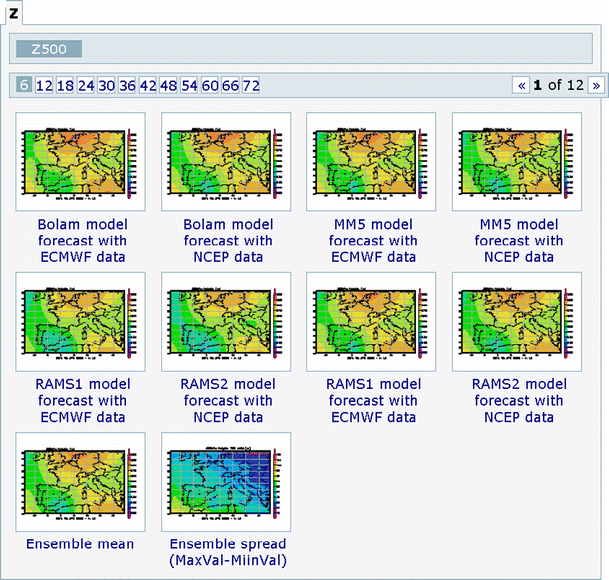
Screen shot of a portion of the Web page showing results of the execution of the PREMIAGRID service. In this case the deterministic forecasts for the geopotential height at 500 mb for the 8 ensemble members (Bolam with ECMWF data, Bolam with NCEP data, MM5 with ECMWF data, etc), the average of the ensemble members (ensemble mean) and the difference between the maximum and the minimum value (ensemble spread) of the ensemble, are shown

The service PREMIAGRID can be run on demand by the user who only has to set three parameters:
-
1.
a generic location on the world where to centre the domain of integration, by a simple clicking on a Google Maps of the globe;
-
2.
the starting date of integration, by available data for initial and boundary conditions shown on the calendar;
-
3.
the period of integration, from 6 h to 72 h.
These features make the system very flexible and customizable to the needs of different users.
The access to the available computational resources through the portal offers an opportunity to use a service based on operational models, as well as a way to share measured and/or forecast meteorological data within the Virtual Organization.After customization and implementation of the appropriate access policies, this service can be made available to different end users: public (civil protection) and/or private (e.g. newspapers, television stations, tour operators). It also can be used for operational purposes, running meteorological models at higher spatial resolution and/or nested over different sub-regions.
Conclusions and future work
The most valuable arguments for deploying typical stand alone applications Earth Sciences in a grid problem solving environment are the improvement of the quality of research and the widening of the scientific goals. Here we illustrated how these objectives are achieved using tools like GRIDA3 where developers and researchers have the possibility to be organically linked, overcoming the fragmentation of knowledge, in order to share know-how, skills, data, computational models, simulation results, and other project resources. We also showed that flexible, reliable and usable in a quite easy way tools of GRIDA3 can be customized to the needs of applications coming from different fields.
For each application analyzed in the GRIDA3 project, the use of grid technology have lead to significant improvements:
-
integrating geochemical and soil data, located in several University nodes, in a single application helps to validate the outcomes of the stream sediments samples and to study new correlations between chemical elements and several parameters such as human health and food quality (AGISGRID);
-
reducing the in-the-field data acquisition time of seismic data through optimization of the turnaround, entails a high decrease of the costs of acquisition campaigns and minimizes their impact especially on inhabited areas (EIAGRID);
-
giving easy access to distributed computational and data resources offers the opportunity to implement methodologies as ensemble prediction systems not only to big international institutions, but also to national or regional ones (PREMIAGRID);
-
deploying typical desktop tools within a grid infrastructure allows the extension of functionalities through the re-use and integration of packages (e.g. render simulation outputs as thematic maps overlaying geographical information layers on the project Web-GIS platform) and the chaining between different applications (AQUAGRID, BONGRID).
The integration of tools specifically needed for each application stimulated the enlargement of the features of the framework and the cross-usability of the tools.
GRIDA3 is still under development. At this stage and for the aims of the project, external users can only benefit from already deployed applications with a small level of interactivity. The future work will be devoted to widen the potentialities of each deployed application (e.g. workflow engines; a data management tool to facilitate user-friendly Web access and management of large amounts of data; tests on Integrated Rule-Oriented Data System—iRODS datagrid middleware; GUI usability tests) and to enlarge the number of GRIDA3 applications, allowing also external users to integrate their ones into the system.
Notes
http://en.wikipedia.org/wiki/Mashup_(web_application_hybrid)—accessed September 01, 2008.
GeoNames is a geographical database freely accessible through various Web services.
References
Atkinson MP, Britton D, Coveney P, De Roure DE, Garnett N, Geddes N, Gurney R, Ingram D, Haines K, Hughes L, Jeffreys P, Lyon LJ, Osborne I, Perrott R, Procter RN, Trefethen AE (2008) Century-of-information research—a strategy for research and innovation in the century of information (CIR3). Available at the Web site of National e-Science Centre. http://wikis.nesc.ac.uk/escienvoy/Century_of_Information_Research_Strategy_%28CIR%29:_a_strategy_to_meet_the_research_challenges_and_opportunities_in_the_century_of_information. Accessed September 01, 2008
Beltrame F, Maggi P, Melato M, Molinari E, Sisto R, Torterolo L (2006) SRB data grid and compute grid integration via the enginframe grid portal. Technical Report SDSC TR-2006–1, February 2006, pp 15–20
Blake MB, Nowlan MF (2008) Predicting service mashup candidates using enhanced syntactical message management, scc, pp 229–236, 2008 IEEE International Conference on Services Computing Vol. 1, 2008
Buzzi A, Fantini M, Malguzzi P, Nerozzi F (1994) Validation of a limited area model in cases of Mediterranean cyclogenesis: surface fields and precipitation scores. Meteorol Atmos Phys 53:137–153
Cohen JK, Stockwell JJW (2000) Seismic Un*x Release 34: a free package for seismic research and processing. Center for Wave Phenomena, Colorado School of Mines. Geophys J Int 125:431–442
Deidda GP, Ranieri G, Uras G, Cosentino P, Martorana R (2006) Geophysical investigations in the Flumendosa River Delta, Sardinia, Italy. Seismic reflection imaging. Geophysics 71(4):121–128
Doherty J (2002) PEST model independent parameter estimation. Watermark Numerical Computing
FAO (1976) A framework for land evaluation. Soils bulletin 32. Food and Agriculture Organization of the United Nations, Rome
Fanfani L, Biddau R, Lecca G, Murgia F (2008) AQUAGRID: A problem solving platform for mine water (Sardinia first case study). Proceedings of the 10th International Mine Water Association Congress, in press
Goldfarb CF, Prescod P (2000) The XML handbook. Prentice Hall PTR, Upper Saddle River
Grace Team (2008) Grace user’s guide (for Grace-5.1.22). Available at the site: http://plasma-gate.weizmann.ac.il/Grace/doc/UsersGuide.html#toc4.2. Accessed September 01, 2008
Grell GA, Dudhia J, Stauffer DR (1994) A description of the fifth-generation Penn State/NCAR Mesoscale Model (MM5). NCAR Tech. Note NCAR/TN-3981STR, 121 pp. [Available from MMM Division, NCAR, P.O. Box 3000, Boulder, CO 80307]
Halonen T, Romero J, Melero J (2003) GSM, GPRS, and EDGE performance: Evolution towards 3G/UMTS. Wiley, West Sussex
Heilmann Z (2007) CRS-stack-based seismic reflection imaging for land data in time and depth domains. Available at Karlsruhe University site. http://digbib.ubka.uni-karlsruhe.de/volltexte/1000005850—Accessed September 03, 2008
Henderson A (2004) “The paraview guide: a parallel visualization application” Kitware, Incorporated
Hewlett Packard (2008) IPMI: Intelligent platform management interface white paper
Jäger R, Mann J, Höcht G, Hubral P (2001) Common-reflection-surface stack: Image and attributes. Geophysics 66(1):97–109
Kesselman C, Foster I (2001) The anatomy of the grid, Proceedings of the 7th International Euro-Par Conference Manchester on Parallel Processing, Pages: 1–4
Koglin I, Mann J, Heilmann Z (2006) CRS-stack-based residual static correction. Geophys Prospect 54:697–707
Kosmas C, Ferrara A, Briassouli H, Imeson I (1999) Methodology for mapping ESAs to desertification. In: Kosmas C, Kirkby M, Geeson N (eds) The MEDALUS (Mediterranean Desertification and Land Use) project, manual on key indicators of desertification and mapping environmentally sensitive areas to desertification. EUR 18882:31–47
Kropla B (2005) Beginning mapServer: Open source GIS development. 418 p, Apress L. P
Lecca G (2000) Implementation and testing of the CODESA-3D model for density-dependent flow and transport problems in porous media, CRS4-TECH-REP-00/40, Cagliari, Italy
Lecca G, Murgia F, Maggi P, Piras A (2007) AQUAGRID: The subsurface hydrology grid service of the Sardinian regional grid infrastructure. Proceedings of the Third EELA Conference. In: Gavela R, Marechal B, Barbera R, Ciuffo LN, Mayo R (eds), pp 357–365
Manca S, Cau P, Bonomi E, Mazzella A (2006) The Datacrossing DSS: a data-GRID based decision support system for groundwater management. Proceedings the 2nd IEEE International Conference on e-Science and Grid Computing, Dec. 4–6, 2006, Amsterdam, Netherlands
Marrocu M, Chessa P (2008) A multi-model/multi-analysis limited area ensemble: Calibration issues. Meteor Appl 15:171–179
Neteler M, Mitasova H (2002) Open source GIS: a GRASS GIS approach, 464 p. Kluwer Academic, Dordrecht, Boston. ISBN 1-4020-7088-8
Palmer T (1993) Ensemble prediction. Proc. 1992 ECMWF Seminar, Reading, UK, ECMWF
Parkhurst DL (1995) User’s guide to PHREEQC—a computer program for speciation, reaction-path, advective-transport, and inverse geochemical calculations. U.S. Geological Survey Water-Resources Investigations Report 95-4227, 143 p
Pielke RA, Cotton WR, Walko RL, Tremback CJ, Lyons WA, Grasso LD, Nicholls ME, Moran MD, Wesley DA, Lee TJ, Copeland JH (1992) A comprehensive meteorological modelling system—RAMS. Meteor Atmos Phys 49:69–91
PostgreSQL Global Development Group (2007) PostgreSQL reference manual. Vol. 1–3. Network Theory Ltd
Rajasekar A, Wan M, Moore R, Schroeder W, Kremenek G, Jagatheesan A, Cowart C, Zhu B, Chen S, Olschanowsky R (2003) Storage resource broker—Managing distributed data in a grid. Computer Society of India Journal, Special Issue on SAN, 33(4):42–54
Rysavy Research (2008) EDGE, HSPA and LTE Broadband Inovation. Available online at: http://www.rysavy.com/Articles/2008_09_Broadband_Innovation.pdf. Accessed September 01, 2008
Salminen R, Batista MJ, Bidoc M, Demetriades, A, De Vivo B, De Vos W, Gilucis A, Gregorauskiene V, Halamic J, Heitzmann P, Lima A, Jordan G, Klaver G, Klein P, Lis J, Locutura J, Marsina K, Mazreku A, Mrnkova J, O’connor PJ, Olsson S, Ottesen RT, Petersell V, Plant JA, Reeder S, Salpeteur I, Sandström H, Siewers U, Steenfelt A, Tarvainent T (2005) Geochemical atlas of Europe. Part 1: Background information, methodology and maps. In: R. Salminen (ed.) Geological Survey of Finland. Espoo, 525 pp
Smith B (2007) A quick guide to GPLv3. 6 pages, Free Software Foundation, Inc. Available at GNU Operating System site: http://www.gnu.org/licenses/quick-guide-gplv3.html—Accessed September 01, 2008
Spinner M (2007) CRS-based minimum-aperture Kirchhoff migration in the time domain. Available at Karlsruhe University site. http://digbib.ubka.uni-karlsruhe.de/volltexte/1000007099—Accessed September 03, 2008
Vacca A, Loddo S, Serra G, Aru, A (2002) Soil degradation in Sardinia (Italy): main factors and processes. In: Zdruli P, Steduto P, Kapur S (eds) 7th International Meeting on soils with mediterranean type of climate (Selected Papers), Options Méditerranéennes, Series: Mediterranean Seminars, Volume A50, Valenzano (BA), Italy, ISBN 2-85352-248-2, ISSN 1016-121X, 413–423
Wouters P (2004) What is the matter with e-Science?—Thinking aloud about informatisation in knowledge creation. Proceedings of Society for Social Studies of Science, & EASST CONFERENCE Paris. August 2004 Available at pantaneto site http://www.pantaneto.co.uk/issue2023/wouters.htm.—Accessed September 01, 2008
Yacoub MD (2001) Wireless technology. Protocols, standards, and techniques. CRC Press LLC, Boca Raton
Acknowledgements
This work is funded by the government of the Regione Autonoma della Sardegna (RAS) and by GRIDA3 (Italian Ministry of Research and Education—MIUR prog. n. 1,433/2006) project. The support of the colleagues of the Network and High Performance Computing Program and of NICE-s.r.l is gratefully acknowledged.
Author information
Authors and Affiliations
Corresponding author
Additional information
Communicated by: H. A. Babaie
Rights and permissions
Open Access This is an open access article distributed under the terms of the Creative Commons Attribution Noncommercial License ( https://creativecommons.org/licenses/by-nc/2.0 ), which permits any noncommercial use, distribution, and reproduction in any medium, provided the original author(s) and source are credited.
About this article
Cite this article
Murgia, F., Biddau, R., Concas, A. et al. GRIDA3—a shared resources manager for environmental data analysis and applications. Earth Sci Inform 2, 5–21 (2009). https://doi.org/10.1007/s12145-009-0020-0
Received:
Accepted:
Published:
Issue Date:
DOI: https://doi.org/10.1007/s12145-009-0020-0